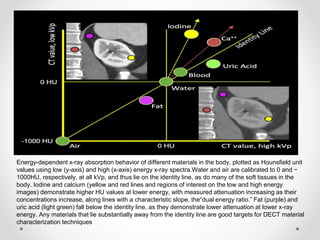
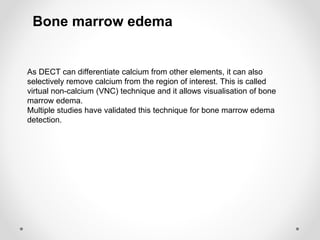
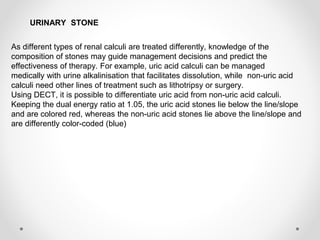
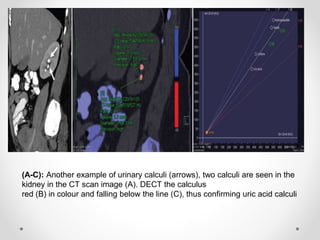
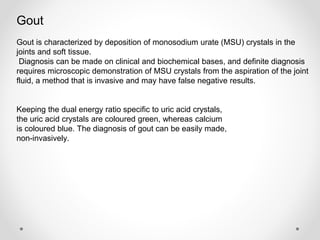
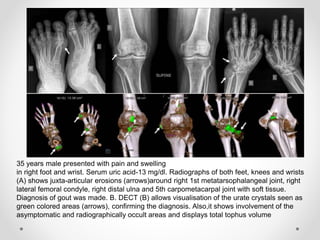
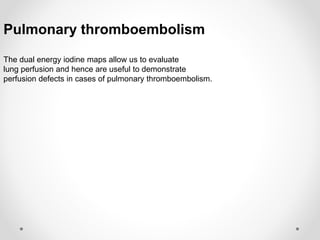
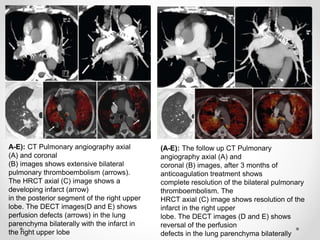
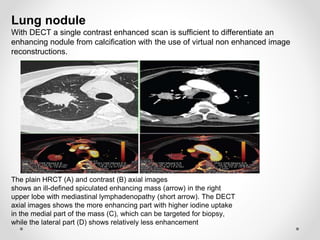
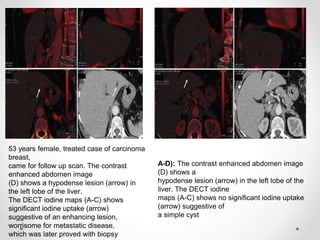
DUAL ENERGY CT
1
Dual energy CT, also known as spectral CT, is a computed tomography
technique that uses two separate x-ray photon energy spectra, allowing the
interrogation of materials that have different attenuation properties at
different energies.
Whereas conventional single energy CT uses single X-ray photon energy
spectra and produces a single image set, dual energy data (attenuation
values at two energy spectra) can be used to reconstruct numerous image
SINGLE ENERGY CT
2
The settings of 80 and 140 kVp are generally used because
they provide maximum difference and least overlap between
the spectra with standard tubes.
BASIS OF DECT
○ Attenuation is energy dependent- at 80 kVp, iodine signal is
2X of 140 kVp
○ CT numbers do not vary with beam energy for soft tissues but do for
high “z” materials
○ By analysing absorption properties of different material at different x-
ray energies, materials can be distinguished. (basis material
decomposition)
○ Human body is made up of many different elements- mainly carbon,
oxygen , hydrogen , nitrogen, phosphorous and calcium which are
arranged in many different combinations.
○ Hydrogen, carbon, nitrogen and oxygen have similar k- edges which
are well below the energies currently used in DECT (80 kVp and 140
kVp), thus not well appreciated.
○ The k edges of calcium and iodine are higher than those of soft
tissues and although they are lower than those, they are
distinguished from soft tissues at DE imaging.
PRINCIPLE OF DECT
○The principle of dual energy CT is based on differential absorption of
energy(Linear attenuation coefficient) at variable KVP settings.
○For example: Let us consider a substance (A)with K-edge at 60 kv another
(B)with K-edge 130 kv, if we imagine multiple combination of A and/or B at 80KVp
and 140KVp ,there will be differential attenuation at both these energy settings.
○The object containing larger amount of substance A will show higher
attenuation at 80KVp and lower attenuation at 140 KVp, whereas object
containing larger amount of substance B will show higher attenuation at 80KVp
and at 140KVp as well.
○The CT number of blood mixed iodine becomes 1550HU similar to the value of
bone at 140 kvp. so it is nearly impossible to determine weather the object of interest
is bone or iodine blood mixed structure.
○If we take another scan of same object with on 80kvp setting , the measures CT
number will be different .if the object of interest is made with bone the CT number
will be 2200HU and the object is mixture of iodine and blood , the CT number will be
2800HU due to different behaviour of linear attenuation co-efficient as a function of
energy for different materials.
Energy-dependent x-ray absorption behavior of different materials in the body, plotted as Hounsfield unit
values using low (y-axis) and high (x-axis) energy x-ray spectra.Water and air are calibrated to 0 and −
1000HU, respectively, at all kVp, and thus lie on the identity line, as do many of the soft tissues in the
body. Iodine and calcium (yellow and red lines and regions of interest on the low and high energy
images) demonstrate higher HU values at lower energy, with measured attenuation increasing as their
concentrations increase, along lines with a characteristic slope, the“dual energy ratio.” Fat (purple) and
uric acid (light green) fall below the identity line, as they demonstrate lower attenuation at lower x-ray
energy. Any materials that lie substantially away from the identity line are good targets for DECT material
characterization techniques
Applications in Clinical
Practice
Bone removal in angiography
As DECT has the ability to differentiate different materials
from one another, calcium in the bones is readily separated
from iodine in the contrast media. Hence the bones in
any angiography study can be easily removed.
• Similarly, calcified plaques can
be removed for better visualisation of the lumen
A routine cerebral CT angiography study (A) shows
carotid and cerebral arteries overlapped by bones making it difficult
to visualise them. With DECT bone removal tool, all the bones are
effectively and selectively removed allowing clear visualisation of the
arteries with AVM (arrow) as shown in this MIP image (B). Similarly
the arteries with AVM (arrow) can also be evaluated in VRT image
(C) with bone removal
As DECT can differentiate calcium from other elements, it can also
selectively remove calcium from the region of interest. This is called
virtual non-calcium (VNC) technique and it allows visualisation of bone
marrow edema.
Multiple studies have validated this technique for bone marrow edema
detection.
Bone marrow edema
(A-D): CT image in coronal reconstruction (A) and 3D
reconstruction (B) shows fractures (arrows) involving the neck and the
greater tuberosity of the right humerus. With DECT, the bone marrow
edema (arrows) can be seen in the the neck and the greater tuberosity
of the humerus as seen in DECT coronal reconstruction (C) and DECT
Using DECT, the artefacts from metal can be significantly reduced to almost nil. As
the artefacts are more at lower energy x-ray beams, the monochromatic images at
higher keV settings show significantly less artefacts.
Additionally, iterative reconstruction protocols such as iMAR (interactive metal
artefact reduction) can be used that further reduce the metal artefacts. When both
the techniques are used together, the final result shows almost nil metal artefacts.
Ideal for peri prosthetic soft tissue assesment.
Metal artefact reduction
metal artefact reduction in a patient with bilateral total hip replacement. Higher
keV images shows less metal artefacts and addition of iterative reconstruction
(iMAR) further reduces
the metal artefacts and when both techniques are combined, the final
image shows almost nil artefacts
As different types of renal calculi are treated differently, knowledge of the
composition of stones may guide management decisions and predict the
effectiveness of therapy. For example, uric acid calculi can be managed
medically with urine alkalinisation that facilitates dissolution, while non-uric acid
calculi need other lines of treatment such as lithotripsy or surgery.
Using DECT, it is possible to differentiate uric acid from non-uric acid calculi.
Keeping the dual energy ratio at 1.05, the uric acid stones lie below the line/slope
and are colored red, whereas the non-uric acid stones lie above the line/slope and
are differently color-coded (blue)
URINARY STONE
(A-C): Another example of urinary calculi (arrows), two calculi are seen in the
kidney in the CT scan image (A). DECT the calculus
red (B) in colour and falling below the line (C), thus confirming uric acid calculi
Gout
Gout is characterized by deposition of monosodium urate (MSU) crystals in the
joints and soft tissue.
Diagnosis can be made on clinical and biochemical bases, and definite diagnosis
requires microscopic demonstration of MSU crystals from the aspiration of the joint
fluid, a method that is invasive and may have false negative results.
Keeping the dual energy ratio specific to uric acid crystals,
the uric acid crystals are coloured green, whereas calcium
is coloured blue. The diagnosis of gout can be easily made,
non-invasively.
35 years male presented with pain and swelling
in right foot and wrist. Serum uric acid-13 mg/dl. Radiographs of both feet, knees and wrists
(A) shows juxta-articular erosions (arrows)around right 1st metatarsophalangeal joint, right
lateral femoral condyle, right distal ulna and 5th carpometacarpal joint with soft tissue.
Diagnosis of gout was made. B. DECT (B) allows visualisation of the urate crystals seen as
green colored areas (arrows), confirming the diagnosis. Also,it shows involvement of the
asymptomatic and radiographically occult areas and displays total tophus volume
Pulmonary thromboembolism
The dual energy iodine maps allow us to evaluate
lung perfusion and hence are useful to demonstrate
perfusion defects in cases of pulmonary thromboembolism.
A-E): CT Pulmonary angiography axial
(A) and coronal
(B) images shows extensive bilateral
pulmonary thromboembolism (arrows).
The HRCT axial (C) image shows a
developing infarct (arrow)
in the posterior segment of the right upper
lobe. The DECT images(D and E) shows
perfusion defects (arrows) in the lung
parenchyma bilaterally with the infarct in
the right upper lobe
(A-E): The follow up CT Pulmonary
angiography axial (A) and
coronal (B) images, after 3 months of
anticoagulation treatment shows
complete resolution of the bilateral pulmonary
thromboembolism. The
HRCT axial (C) image shows resolution of the
infarct in the right upper
lobe. The DECT images (D and E) shows
reversal of the perfusion
defects in the lung parenchyma bilaterally
Lung nodule
With DECT a single contrast enhanced scan is sufficient to differentiate an
enhancing nodule from calcification with the use of virtual non enhanced image
reconstructions.
The plain HRCT (A) and contrast (B) axial images
shows an ill-defined spiculated enhancing mass (arrow) in the right
upper lobe with mediastinal lymphadenopathy (short arrow). The DECT
axial images shows the more enhancing part with higher iodine uptake
in the medial part of the mass (C), which can be targeted for biopsy,
while the lateral part (D) shows relatively less enhancement
53 years female, treated case of carcinoma
breast,
came for follow up scan. The contrast
enhanced abdomen image
(D) shows a hypodense lesion (arrow) in
the left lobe of the liver.
The DECT iodine maps (A-C) shows
significant iodine uptake (arrow)
suggestive of an enhancing lesion,
worrisome for metastatic disease,
which was later proved with biopsy
A-D): The contrast enhanced abdomen image
(D) shows a
hypodense lesion (arrow) in the left lobe of the
liver. The DECT iodine
maps (A-C) shows no significant iodine uptake
(arrow) suggestive of
a simple cyst

DUAL ENERGY CT-1.pptx

  • 1.
    DUAL ENERGY CT 1 Dualenergy CT, also known as spectral CT, is a computed tomography technique that uses two separate x-ray photon energy spectra, allowing the interrogation of materials that have different attenuation properties at different energies. Whereas conventional single energy CT uses single X-ray photon energy spectra and produces a single image set, dual energy data (attenuation values at two energy spectra) can be used to reconstruct numerous image
  • 2.
  • 3.
    The settings of80 and 140 kVp are generally used because they provide maximum difference and least overlap between the spectra with standard tubes.
  • 4.
    BASIS OF DECT ○Attenuation is energy dependent- at 80 kVp, iodine signal is 2X of 140 kVp ○ CT numbers do not vary with beam energy for soft tissues but do for high “z” materials ○ By analysing absorption properties of different material at different x- ray energies, materials can be distinguished. (basis material decomposition) ○ Human body is made up of many different elements- mainly carbon, oxygen , hydrogen , nitrogen, phosphorous and calcium which are arranged in many different combinations. ○ Hydrogen, carbon, nitrogen and oxygen have similar k- edges which are well below the energies currently used in DECT (80 kVp and 140 kVp), thus not well appreciated. ○ The k edges of calcium and iodine are higher than those of soft tissues and although they are lower than those, they are distinguished from soft tissues at DE imaging.
  • 5.
    PRINCIPLE OF DECT ○Theprinciple of dual energy CT is based on differential absorption of energy(Linear attenuation coefficient) at variable KVP settings. ○For example: Let us consider a substance (A)with K-edge at 60 kv another (B)with K-edge 130 kv, if we imagine multiple combination of A and/or B at 80KVp and 140KVp ,there will be differential attenuation at both these energy settings. ○The object containing larger amount of substance A will show higher attenuation at 80KVp and lower attenuation at 140 KVp, whereas object containing larger amount of substance B will show higher attenuation at 80KVp and at 140KVp as well. ○The CT number of blood mixed iodine becomes 1550HU similar to the value of bone at 140 kvp. so it is nearly impossible to determine weather the object of interest is bone or iodine blood mixed structure. ○If we take another scan of same object with on 80kvp setting , the measures CT number will be different .if the object of interest is made with bone the CT number will be 2200HU and the object is mixture of iodine and blood , the CT number will be 2800HU due to different behaviour of linear attenuation co-efficient as a function of energy for different materials.
  • 6.
    Energy-dependent x-ray absorptionbehavior of different materials in the body, plotted as Hounsfield unit values using low (y-axis) and high (x-axis) energy x-ray spectra.Water and air are calibrated to 0 and − 1000HU, respectively, at all kVp, and thus lie on the identity line, as do many of the soft tissues in the body. Iodine and calcium (yellow and red lines and regions of interest on the low and high energy images) demonstrate higher HU values at lower energy, with measured attenuation increasing as their concentrations increase, along lines with a characteristic slope, the“dual energy ratio.” Fat (purple) and uric acid (light green) fall below the identity line, as they demonstrate lower attenuation at lower x-ray energy. Any materials that lie substantially away from the identity line are good targets for DECT material characterization techniques
  • 7.
    Applications in Clinical Practice Boneremoval in angiography As DECT has the ability to differentiate different materials from one another, calcium in the bones is readily separated from iodine in the contrast media. Hence the bones in any angiography study can be easily removed. • Similarly, calcified plaques can be removed for better visualisation of the lumen
  • 8.
    A routine cerebralCT angiography study (A) shows carotid and cerebral arteries overlapped by bones making it difficult to visualise them. With DECT bone removal tool, all the bones are effectively and selectively removed allowing clear visualisation of the arteries with AVM (arrow) as shown in this MIP image (B). Similarly the arteries with AVM (arrow) can also be evaluated in VRT image (C) with bone removal
  • 9.
    As DECT candifferentiate calcium from other elements, it can also selectively remove calcium from the region of interest. This is called virtual non-calcium (VNC) technique and it allows visualisation of bone marrow edema. Multiple studies have validated this technique for bone marrow edema detection. Bone marrow edema
  • 10.
    (A-D): CT imagein coronal reconstruction (A) and 3D reconstruction (B) shows fractures (arrows) involving the neck and the greater tuberosity of the right humerus. With DECT, the bone marrow edema (arrows) can be seen in the the neck and the greater tuberosity of the humerus as seen in DECT coronal reconstruction (C) and DECT
  • 11.
    Using DECT, theartefacts from metal can be significantly reduced to almost nil. As the artefacts are more at lower energy x-ray beams, the monochromatic images at higher keV settings show significantly less artefacts. Additionally, iterative reconstruction protocols such as iMAR (interactive metal artefact reduction) can be used that further reduce the metal artefacts. When both the techniques are used together, the final result shows almost nil metal artefacts. Ideal for peri prosthetic soft tissue assesment. Metal artefact reduction
  • 12.
    metal artefact reductionin a patient with bilateral total hip replacement. Higher keV images shows less metal artefacts and addition of iterative reconstruction (iMAR) further reduces the metal artefacts and when both techniques are combined, the final image shows almost nil artefacts
  • 13.
    As different typesof renal calculi are treated differently, knowledge of the composition of stones may guide management decisions and predict the effectiveness of therapy. For example, uric acid calculi can be managed medically with urine alkalinisation that facilitates dissolution, while non-uric acid calculi need other lines of treatment such as lithotripsy or surgery. Using DECT, it is possible to differentiate uric acid from non-uric acid calculi. Keeping the dual energy ratio at 1.05, the uric acid stones lie below the line/slope and are colored red, whereas the non-uric acid stones lie above the line/slope and are differently color-coded (blue) URINARY STONE
  • 14.
    (A-C): Another exampleof urinary calculi (arrows), two calculi are seen in the kidney in the CT scan image (A). DECT the calculus red (B) in colour and falling below the line (C), thus confirming uric acid calculi
  • 15.
    Gout Gout is characterizedby deposition of monosodium urate (MSU) crystals in the joints and soft tissue. Diagnosis can be made on clinical and biochemical bases, and definite diagnosis requires microscopic demonstration of MSU crystals from the aspiration of the joint fluid, a method that is invasive and may have false negative results. Keeping the dual energy ratio specific to uric acid crystals, the uric acid crystals are coloured green, whereas calcium is coloured blue. The diagnosis of gout can be easily made, non-invasively.
  • 16.
    35 years malepresented with pain and swelling in right foot and wrist. Serum uric acid-13 mg/dl. Radiographs of both feet, knees and wrists (A) shows juxta-articular erosions (arrows)around right 1st metatarsophalangeal joint, right lateral femoral condyle, right distal ulna and 5th carpometacarpal joint with soft tissue. Diagnosis of gout was made. B. DECT (B) allows visualisation of the urate crystals seen as green colored areas (arrows), confirming the diagnosis. Also,it shows involvement of the asymptomatic and radiographically occult areas and displays total tophus volume
  • 17.
    Pulmonary thromboembolism The dualenergy iodine maps allow us to evaluate lung perfusion and hence are useful to demonstrate perfusion defects in cases of pulmonary thromboembolism.
  • 18.
    A-E): CT Pulmonaryangiography axial (A) and coronal (B) images shows extensive bilateral pulmonary thromboembolism (arrows). The HRCT axial (C) image shows a developing infarct (arrow) in the posterior segment of the right upper lobe. The DECT images(D and E) shows perfusion defects (arrows) in the lung parenchyma bilaterally with the infarct in the right upper lobe (A-E): The follow up CT Pulmonary angiography axial (A) and coronal (B) images, after 3 months of anticoagulation treatment shows complete resolution of the bilateral pulmonary thromboembolism. The HRCT axial (C) image shows resolution of the infarct in the right upper lobe. The DECT images (D and E) shows reversal of the perfusion defects in the lung parenchyma bilaterally
  • 19.
    Lung nodule With DECTa single contrast enhanced scan is sufficient to differentiate an enhancing nodule from calcification with the use of virtual non enhanced image reconstructions. The plain HRCT (A) and contrast (B) axial images shows an ill-defined spiculated enhancing mass (arrow) in the right upper lobe with mediastinal lymphadenopathy (short arrow). The DECT axial images shows the more enhancing part with higher iodine uptake in the medial part of the mass (C), which can be targeted for biopsy, while the lateral part (D) shows relatively less enhancement
  • 20.
    53 years female,treated case of carcinoma breast, came for follow up scan. The contrast enhanced abdomen image (D) shows a hypodense lesion (arrow) in the left lobe of the liver. The DECT iodine maps (A-C) shows significant iodine uptake (arrow) suggestive of an enhancing lesion, worrisome for metastatic disease, which was later proved with biopsy A-D): The contrast enhanced abdomen image (D) shows a hypodense lesion (arrow) in the left lobe of the liver. The DECT iodine maps (A-C) shows no significant iodine uptake (arrow) suggestive of a simple cyst