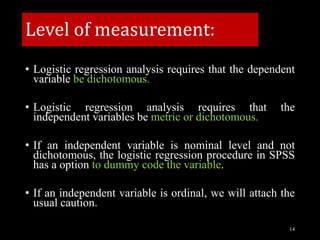
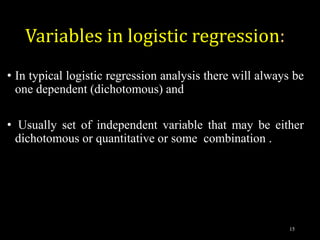
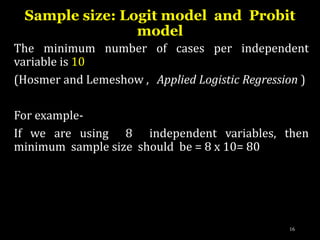
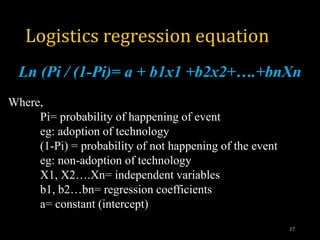
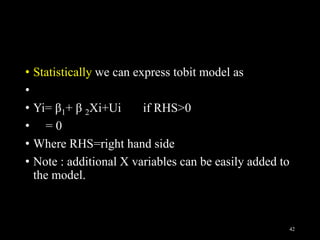
This document provides an overview of regression analysis and different types of regression models used when the dependent variable is dichotomous (can only take two values, such as 0 and 1). It defines regression analysis and discusses linear regression assumptions. It then introduces logistic regression, probit regression, and tobit regression as alternatives to linear regression when the dependent variable is dichotomous. The key differences between these models and their applications are summarized.
Binary outcome models are widely used in many real world application. We can used Probit and Logit models to analysis this type of data. Specially, dose response data can be analyze using these two models.
Brief notes on heteroscedasticity, very helpful for those who are bigners to econometrics. i thought this course to the students of BS economics, these notes include all the necessary proofs.
Ragui Assaad- University of Minnesota
Caroline Krafft- ST. Catherine University
ERF Training on Applied Micro-Econometrics and Public Policy Evaluation
Cairo, Egypt July 25-27, 2016
www.erf.org.eg
The Indian economy is classified into different sectors to simplify the analysis and understanding of economic activities. For Class 10, it's essential to grasp the sectors of the Indian economy, understand their characteristics, and recognize their importance. This guide will provide detailed notes on the Sectors of the Indian Economy Class 10, using specific long-tail keywords to enhance comprehension.
For more information, visit-www.vavaclasses.com
Unit 8 - Information and Communication Technology (Paper I).pdfThiyagu K
This slides describes the basic concepts of ICT, basics of Email, Emerging Technology and Digital Initiatives in Education. This presentations aligns with the UGC Paper I syllabus.
Synthetic Fiber Construction in lab .pptxPavel ( NSTU)
Synthetic fiber production is a fascinating and complex field that blends chemistry, engineering, and environmental science. By understanding these aspects, students can gain a comprehensive view of synthetic fiber production, its impact on society and the environment, and the potential for future innovations. Synthetic fibers play a crucial role in modern society, impacting various aspects of daily life, industry, and the environment. ynthetic fibers are integral to modern life, offering a range of benefits from cost-effectiveness and versatility to innovative applications and performance characteristics. While they pose environmental challenges, ongoing research and development aim to create more sustainable and eco-friendly alternatives. Understanding the importance of synthetic fibers helps in appreciating their role in the economy, industry, and daily life, while also emphasizing the need for sustainable practices and innovation.
The French Revolution, which began in 1789, was a period of radical social and political upheaval in France. It marked the decline of absolute monarchies, the rise of secular and democratic republics, and the eventual rise of Napoleon Bonaparte. This revolutionary period is crucial in understanding the transition from feudalism to modernity in Europe.
For more information, visit-www.vavaclasses.com
2024.06.01 Introducing a competency framework for languag learning materials ...Sandy Millin
http://sandymillin.wordpress.com/iateflwebinar2024
Published classroom materials form the basis of syllabuses, drive teacher professional development, and have a potentially huge influence on learners, teachers and education systems. All teachers also create their own materials, whether a few sentences on a blackboard, a highly-structured fully-realised online course, or anything in between. Despite this, the knowledge and skills needed to create effective language learning materials are rarely part of teacher training, and are mostly learnt by trial and error.
Knowledge and skills frameworks, generally called competency frameworks, for ELT teachers, trainers and managers have existed for a few years now. However, until I created one for my MA dissertation, there wasn’t one drawing together what we need to know and do to be able to effectively produce language learning materials.
This webinar will introduce you to my framework, highlighting the key competencies I identified from my research. It will also show how anybody involved in language teaching (any language, not just English!), teacher training, managing schools or developing language learning materials can benefit from using the framework.
Instructions for Submissions thorugh G- Classroom.pptxJheel Barad
This presentation provides a briefing on how to upload submissions and documents in Google Classroom. It was prepared as part of an orientation for new Sainik School in-service teacher trainees. As a training officer, my goal is to ensure that you are comfortable and proficient with this essential tool for managing assignments and fostering student engagement.
Operation “Blue Star” is the only event in the history of Independent India where the state went into war with its own people. Even after about 40 years it is not clear if it was culmination of states anger over people of the region, a political game of power or start of dictatorial chapter in the democratic setup.
The people of Punjab felt alienated from main stream due to denial of their just demands during a long democratic struggle since independence. As it happen all over the word, it led to militant struggle with great loss of lives of military, police and civilian personnel. Killing of Indira Gandhi and massacre of innocent Sikhs in Delhi and other India cities was also associated with this movement.
Welcome to TechSoup New Member Orientation and Q&A (May 2024).pdfTechSoup
In this webinar you will learn how your organization can access TechSoup's wide variety of product discount and donation programs. From hardware to software, we'll give you a tour of the tools available to help your nonprofit with productivity, collaboration, financial management, donor tracking, security, and more.
How to Create Map Views in the Odoo 17 ERPCeline George
The map views are useful for providing a geographical representation of data. They allow users to visualize and analyze the data in a more intuitive manner.
2. What is Regression Analysis ?
• Technique of estimating the unknown value of
dependent variable from the known value of
independent variable is called regression analysis.
Eg : The effect of a price increase upon demand, or
the effect of changes in the money supply upon the
inflation rate
2
3. Regression Lines
A regression line is a line that best describes the
linear relationship between the two variables.
y = a + bx
3
a
Y=a+bX
Y=a-bX
X Axis
Y Axis
4. Assumptions for regression
Measurement :
• All independent variables –interval/ratio/dichotomous
• Dependent variable- interval/ratio
Specification :
• Linear relationship between dependent and
independent
Expected value of error term : zero
4
5. Homoscedasticity
• Variance of error term is same/ constant
Normality of error
• Normally distributed for each set of values of
independent variable
Absence of multicollinearity
Assumptions for regression
5
6. Limitations of linear regression
Violation of measurements
• Dependent variable : if it is dichotomous
eg.: Smoker and non-smoker
Adopter and non-adopter
Participating and non-participating
• Independent variable: if any of the IV is dichotomous
• Eg: male and female
6
7. Shall we use LPM ???...
yes but…
• Non-normality of the errors Ui
•Hetroscedastic variances of the errors
• Non fulfillment of 0 < E (Yi|Xi) < 1
•Questionable of value of R2 as a measure
of goodness of fit
7
10. What is logistic regression ?
Used to analyze relationships between a dichotomous
dependent variable and metric or dichotomous
independent variables
Combines the independent variables to estimate the
probability that a particular event will occur or not
LR is a nonlinear regression model that forces the output
(predicted values) to be either 0 or 1
It could be called a qualitative response/discrete choice
model in the terminology of economics
10
11. Assumptions:
• NO NEED a linear relationship between the dependent and
independent variables
• NO NEED- Homoscedasticity of independent variables
• The error terms need to be independent
• It requires quite large sample sizes
• Absence of perfect multicollinearity
NO NEED -normality, linearity, and homogeneity of variance for the
independent variables
11
13. Feature of logit model:
• As P goes from 0 to 1 the logit L goes from -∞ to +∞.
That is although probabilities lie between 0 to 1,logits are
not so bounded.
• L is linear in X, the probabilities themselves are not,
which is in contrast with LPM model where probabilities
increases linearly with X.
• If L, the logit is positive, it means that when the value of
the regressor (s) increases the odds that the regressand
equals to 1 increases and vice versa.
13
14. Level of measurement:
• Logistic regression analysis requires that the dependent
variable be dichotomous.
• Logistic regression analysis requires that the
independent variables be metric or dichotomous.
• If an independent variable is nominal level and not
dichotomous, the logistic regression procedure in SPSS
has a option to dummy code the variable.
• If an independent variable is ordinal, we will attach the
usual caution.
14
15. Variables in logistic regression:
• In typical logistic regression analysis there will always be
one dependent (dichotomous) and
• Usually set of independent variable that may be either
dichotomous or quantitative or some combination .
15
16. The minimum number of cases per independent
variable is 10
(Hosmer and Lemeshow , Applied Logistic Regression )
For example-
If we are using 8 independent variables, then
minimum sample size should be = 8 x 10= 80
Sample size: Logit model and Probit
model
16
17. Logistics regression equation
Ln (Pi / (1-Pi)= a + b1x1 +b2x2+….+bnXn
Where,
Pi= probability of happening of event
eg: adoption of technology
(1-Pi) = probability of not happening of the event
eg: non-adoption of technology
X1, X2….Xn= independent variables
b1, b2…bn= regression coefficients
a= constant (intercept)
17
18. Example :
Dependent variable Adoption / Non-adoption
Independent variables Description Hypothesized relation
Age Chronological years of
farmers
-
Education No of years of formal
schooling
+
Land holding Farm size measured acres +
Access to training Yes=1 / no=0 +
Distance to market In kilometers -
Access to credit Yes=1 / no=0 +
Extension services Yes=1 / no=0 +
18
24. Case 1:
A Logit Analysis of Bt Cotton Adoption and Assessment
of Farmers’ Training Need
Padaria, et al., 200924
25. Contd…
Padaria, et al.,
2009
B = regression coefficient
Used to predict whether or not an independent variable would be significant in the
model.
degrees of freedom for the Wald chi- square test,
Are the standard errors associated with the coefficients
Wald chi square value and 2tailed p value used in testing the null hypothesis that the
coefficient (parameter) is 0
Exp(B) the exponentiation of the B coefficient, which is an odds ratio. This value is
given by default because odds ratios can be easier to interpret than the coefficient
25
26. Advantages of logit model:
Transformation of a dependent dichotomous
dependent variable into continuous variable
Results - easily interpretable
simple to analyse method.
It gives parameter estimates- asymptotically
consistent, efficient and normal, so that the analogue
by the regression t-test can be applied.
26
27. Limitation:
• As in case of logit probility model, the disturbance term in
logit model hetroscedasticity and therefore we should go
for weighted least squares.
• As in many other regression , there may be problem of
multicollinearity if the explanatory variable are related
among themselves
27
28. Application of logit model:
1.It can be used to identify the factors that affects the adoption of
particular technology say, use of new crop varities, fertilizers,
pesticides etc on the farm.
2.Model used extensively to analyzing growth phenomena such as
population, GNP, money supply etc.
3.In field of marketing it can be used for brand preferences and brand
loyalty for a brand
4.Gender studies can be used logit analysis to find out factors which
affect the decision making status of men and women in family
28
29. Probit regression model:
• Probit model is a type of regression where the dependent
variable can only take two values, for example adoption or
non-adoption, married or not married.
• The purpose of the model is to estimate the probability
• Estimating model that emerge from normal cumulative
distribution function (CDF) is popularly known as probit
model
• Sometimes it is also called as normit model.
29
30. Probit :Level of measurement
requirements
• Dependent variable = dichotomous/categorical
• Eg: adoption and non adoption,
participation and non- participation
• Independent variables be metric or dichotomous
• Eg: age-ratio level data
• Gender- male/female(dichotomous)
30
31. Case 2 : Factors Affecting Adoption of Improved Rice Varieties
among Rural Farm Households in Central Nepal
Ghimire (2015 ) (Published in : Rice Science)
31
33. Difference b/w
Logit and Probit model:
Logit Probit
Slightly flatter tails The conditional probability Pi
approaches 0 or 1 at a faster rate
Basis of logit model is standard
logistic distribution
Basis of probit model is standard
normal distribution
Variance = Π2 / 3 Variance = 1
Simple mathematics Sophisticated mathematics
Both give same result, preference of the method depends on the researcher choice
but logit regression is mostly preferered
33
34. Significance of Wald test
•To test Statistical significance of unique
contribution of each coefficient in the
model
•This test is similar to the t test in the
multiple regression
34
35. Ordinal logit & probit model
• In both the cases -
• when the outcome is more than 2 and are ordinal in nature
• The dependent variables :
• Eg1: Likert type scale : strongly agree , somewhat agree, strongly
disagree
• Eg2: less than high school (0), high school(1), college (2), post
graduate (3)
• The independent variables remain same as in logit and probit
model
35
36. Multi nominal logit and multi
nominal probit
• When the dependent variable is not ordinal nature &
the categories of dependent variables are more than 2.
• E.g. 1: adoption of different adaptation strategies
Dependent variables =choice of transportation to work
Eg2: occupation classification : unskilled, semiskilled, highly
skilled
36
37. Multi nominal logit model
Kassie et al. 200837
Dependent variable : compost , conservation tillage, both
we have three categories i.e. > 2 categories
38. Tobit model
• An extension of probit model.
• Developed by James Tobin (Nobel laurate
economist)
• Used when a sample in which information on the
regressand is available only for some observation.
• Such sampled are called as censored sample.
• Therefore Tobit model is also know as censored
regression model.
• Sometimes also called as limited dependent variable
regression models
38
39. Conti..
• Example:
• Suppose we have a set of consumer and we are
interested in finding out the amount of money a
person or family spends on a house in relation to
socioeconomic variables.
• Here we have a dilemma …
• If a consumer does not purchase a house, obviously
we have no data on housing expenditure for such
consumers, we have such data only for the
consumers; who actually purchase a house.
39
40. • Thus, consumers are divided into two groups consisting
of say n1 and n2
• n1-about whom we have information on the regressor
(say income, no.of people, mortagage interest rate ) as
well as regressand (amount of expenditure on house )
• n2- about whom we have information only on the
regressor but not on the regressand.
• Now questions arise ?
40
41. • Can we estimates regression using only n1
observation and not worry about the remaining n2
observation.
• The answer is no..
• For the OLS estimates of the parameters obtained
from the subset of n1 observation will be biased as
well as incosistent.
41
42. • Statistically we can express tobit model as
•
• Yi= β1+ β 2Xi+Ui if RHS>0
• = 0
• Where RHS=right hand side
• Note : additional X variables can be easily added to
the model.
42
43. • Truncated sample :
• Distinguish from censored sample.
• In truncated sample information on the regreessor
(IV) is available only if the regressand(DV) is
observed.
43
44. • If we estimate a regression line based on the n1
observation only, the resulting intercept and slope
coefficients are bound to be different than if all the
(n1+n2) observation were taken into account .
44
45. Mechanics of estimating tobit
model:
• Tobit model are estimated by method of maximum
likelihood .
• James Hackman has proposed alternative to ML
which is comparatively easy.
• The Heckman procedure yields consistent estimates
of the parameters but they are not as efficient as the
ML estimates.
45
46. Nested regression analysis
• A nested model is one in which you incrementally
add variables such that every subsequent model is a
superset of the preceding one.
• For example, if y = a + bx is the first model, then
the second model would be something like y = a +
bx + cz +....
• The advantage of this set-up is that it allows you to
compare different specifications and ultimately
investigate the relative importance of specific
variables.
46
47. • Note that a model is nested if and only if the next
model contains the exact same terms in the
preceding one and has at least one additional term.
• On the other hand, a two-stage model is one in
which two equations are estimated one after the
other with the second stage equation including a
predicted value (usually the predicted outcome or
residuals) from the first stage equation
47
48. Conclusion
• Clear on – About the assumption of different
regression analysis model.
• Researcher should be well aware of the different model
and used according to the defined research problem.
• Logit and probit model are being extensively used in
health science, behavioral and social sciences.
• Models are extensively used in social research when
dependent variable is dichotomous.
48
49. References :
• Meyers,L.S ., Gamst , G., & Guarino , A.J
(2006).Applied Multivariate Research : Design And
Interpretation
• Padaria et.al (2009). A Logit Analysis Of Bt Cotton
Adoption And Assessment of Farmer’s Training Need.
Indian Res.J.Ext.Edu.9(2)
• Damodar et al . (2012). Basic econometrics. Mcgraw
Hill Education , India
49