Download as PDF, PPTX
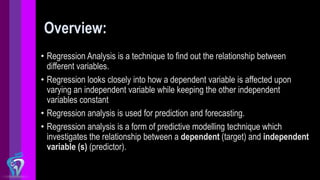
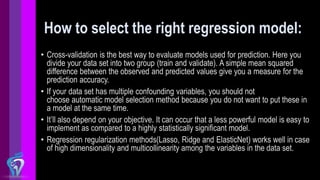
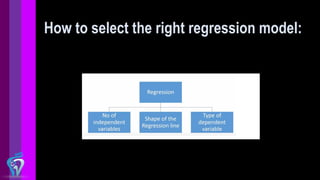
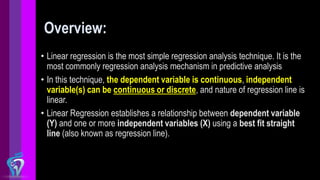
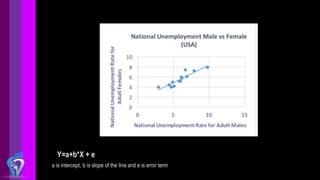
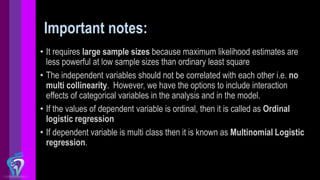
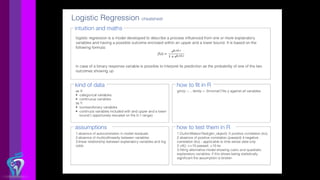


The document provides an overview of regression analysis techniques, including linear regression and logistic regression. It explains that regression analysis is used to understand relationships between variables and can be used for prediction. Linear regression finds relationships when the dependent variable is continuous, while logistic regression is used when the dependent variable is binary. The document also discusses selecting the appropriate regression model and highlights important considerations for linear and logistic regression.


![ONFH[AVN HIP] -TRIPLE REGIME -A NOVAL SURGICAL CONCEPT .pptx](https://cdn.slidesharecdn.com/ss_thumbnails/onfhavnhip2026koaconcalicutdrgokuldevdrmashraf-260210064517-213ec005-thumbnail.jpg?width=640&height=640&fit=bounds)


