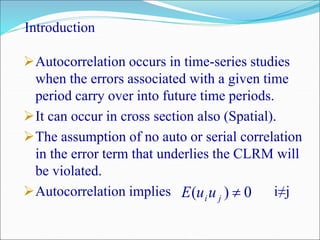
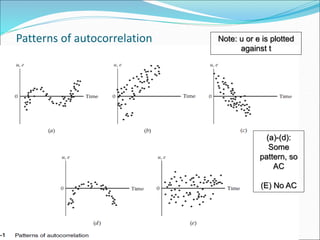
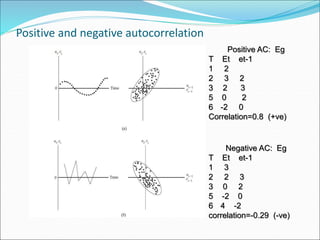
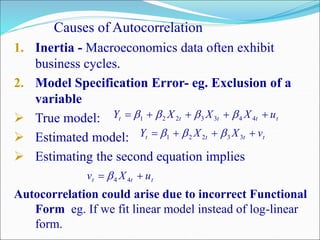
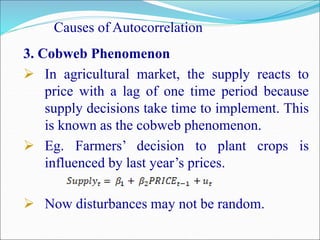
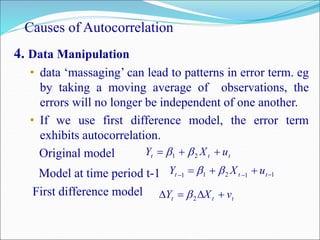
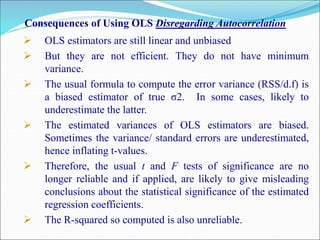
Autocorrelation
The Concept, Causes and Consequences
Shilpa Chaudhary
JDMC
Introduction
Autocorrelation occurs in time-series studies
when the errors associated with a given time
period carry over into future time periods.
It can occur in cross section also (Spatial).
The assumption of no auto or serial correlation
in the error term that underlies the CLRM will
be violated.
Autocorrelation implies i≠j0)( jiuuE
Patterns of autocorrelation
Topic Nine Serial Correlation
(a)-(d):
Some
pattern, so
AC
(E) No AC
Note: u or e is plotted
against t
Positive and negative autocorrelation
Positive AC: Eg
T Et et-1
1 2
2 3 2
3 2 3
5 0 2
6 -2 0
Correlation=0.8 (+ve)
Negative AC: Eg
T Et et-1
1 3
2 2 3
3 0 2
5 -2 0
6 4 -2
correlation=-0.29 (-ve)
Causes of Autocorrelation
1. Inertia - Macroeconomics data often exhibit
business cycles.
2. Model Specification Error- eg. Exclusion of a
variable
 True model:
 Estimated model:
 Estimating the second equation implies
Autocorrelation could arise due to incorrect Functional
Form eg. If we fit linear model instead of log-linear
form.
ttttt uXXXY  4433221 
tttt vXXY  33221 
ttt uXv  44
Causes of Autocorrelation
3. Cobweb Phenomenon
 In agricultural market, the supply reacts to
price with a lag of one time period because
supply decisions take time to implement. This
is known as the cobweb phenomenon.
 Eg. Farmers’ decision to plant crops is
influenced by last year’s prices.
 Now disturbances may not be random.
Causes of Autocorrelation
4. Data Manipulation
• data ‘massaging’ can lead to patterns in error term. eg
by taking a moving average of observations, the
errors will no longer be independent of one another.
• If we use first difference model, the error term
exhibits autocorrelation.
Original model
Model at time period t-1
First difference model
ttt uXY  21 
11211 
 ttt uXY 
ttt vXY  2
Consequences of Using OLS Disregarding Autocorrelation
 OLS estimators are still linear and unbiased
 But they are not efficient. They do not have minimum
variance.
 The usual formula to compute the error variance (RSS/d.f) is
a biased estimator of true σ2. In some cases, likely to
underestimate the latter.
 The estimated variances of OLS estimators are biased.
Sometimes the variance/ standard errors are underestimated,
hence inflating t-values.
 Therefore, the usual t and F tests of significance are no
longer reliable and if applied, are likely to give misleading
conclusions about the statistical significance of the estimated
regression coefficients.
 The R-squared so computed is also unreliable.

Autocorrelation- Concept, Causes and Consequences

  • 1.
    Autocorrelation The Concept, Causesand Consequences Shilpa Chaudhary JDMC
  • 2.
    Introduction Autocorrelation occurs intime-series studies when the errors associated with a given time period carry over into future time periods. It can occur in cross section also (Spatial). The assumption of no auto or serial correlation in the error term that underlies the CLRM will be violated. Autocorrelation implies i≠j0)( jiuuE
  • 3.
    Patterns of autocorrelation TopicNine Serial Correlation (a)-(d): Some pattern, so AC (E) No AC Note: u or e is plotted against t
  • 4.
    Positive and negativeautocorrelation Positive AC: Eg T Et et-1 1 2 2 3 2 3 2 3 5 0 2 6 -2 0 Correlation=0.8 (+ve) Negative AC: Eg T Et et-1 1 3 2 2 3 3 0 2 5 -2 0 6 4 -2 correlation=-0.29 (-ve)
  • 5.
    Causes of Autocorrelation 1.Inertia - Macroeconomics data often exhibit business cycles. 2. Model Specification Error- eg. Exclusion of a variable  True model:  Estimated model:  Estimating the second equation implies Autocorrelation could arise due to incorrect Functional Form eg. If we fit linear model instead of log-linear form. ttttt uXXXY  4433221  tttt vXXY  33221  ttt uXv  44
  • 6.
    Causes of Autocorrelation 3.Cobweb Phenomenon  In agricultural market, the supply reacts to price with a lag of one time period because supply decisions take time to implement. This is known as the cobweb phenomenon.  Eg. Farmers’ decision to plant crops is influenced by last year’s prices.  Now disturbances may not be random.
  • 7.
    Causes of Autocorrelation 4.Data Manipulation • data ‘massaging’ can lead to patterns in error term. eg by taking a moving average of observations, the errors will no longer be independent of one another. • If we use first difference model, the error term exhibits autocorrelation. Original model Model at time period t-1 First difference model ttt uXY  21  11211   ttt uXY  ttt vXY  2
  • 8.
    Consequences of UsingOLS Disregarding Autocorrelation  OLS estimators are still linear and unbiased  But they are not efficient. They do not have minimum variance.  The usual formula to compute the error variance (RSS/d.f) is a biased estimator of true σ2. In some cases, likely to underestimate the latter.  The estimated variances of OLS estimators are biased. Sometimes the variance/ standard errors are underestimated, hence inflating t-values.  Therefore, the usual t and F tests of significance are no longer reliable and if applied, are likely to give misleading conclusions about the statistical significance of the estimated regression coefficients.  The R-squared so computed is also unreliable.