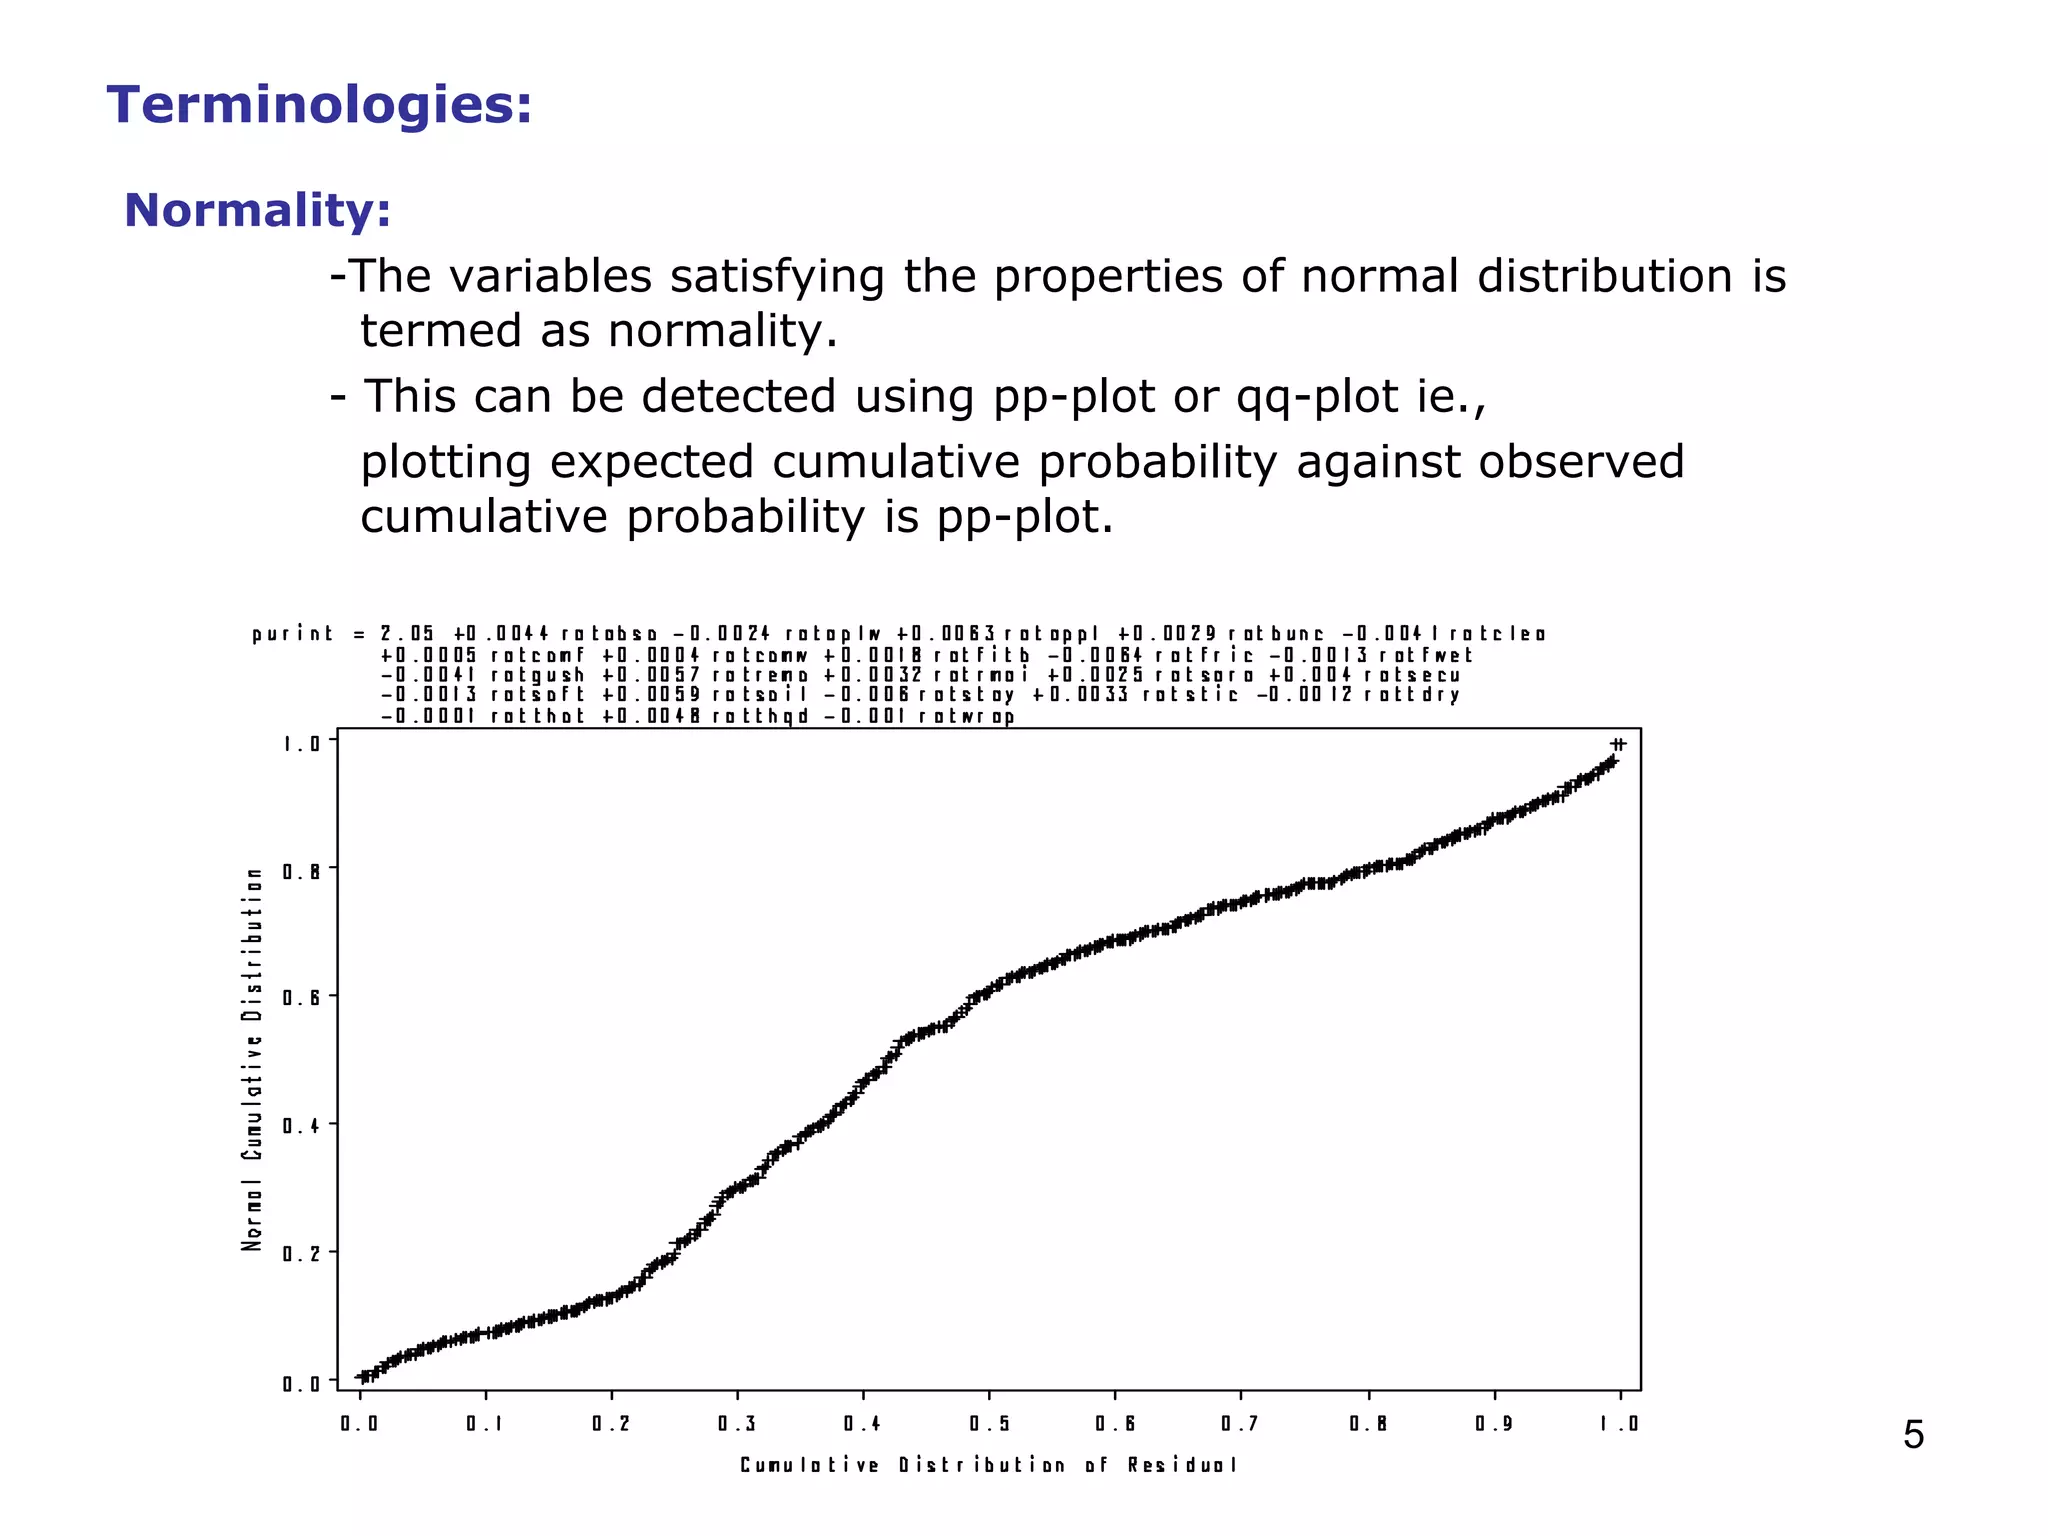
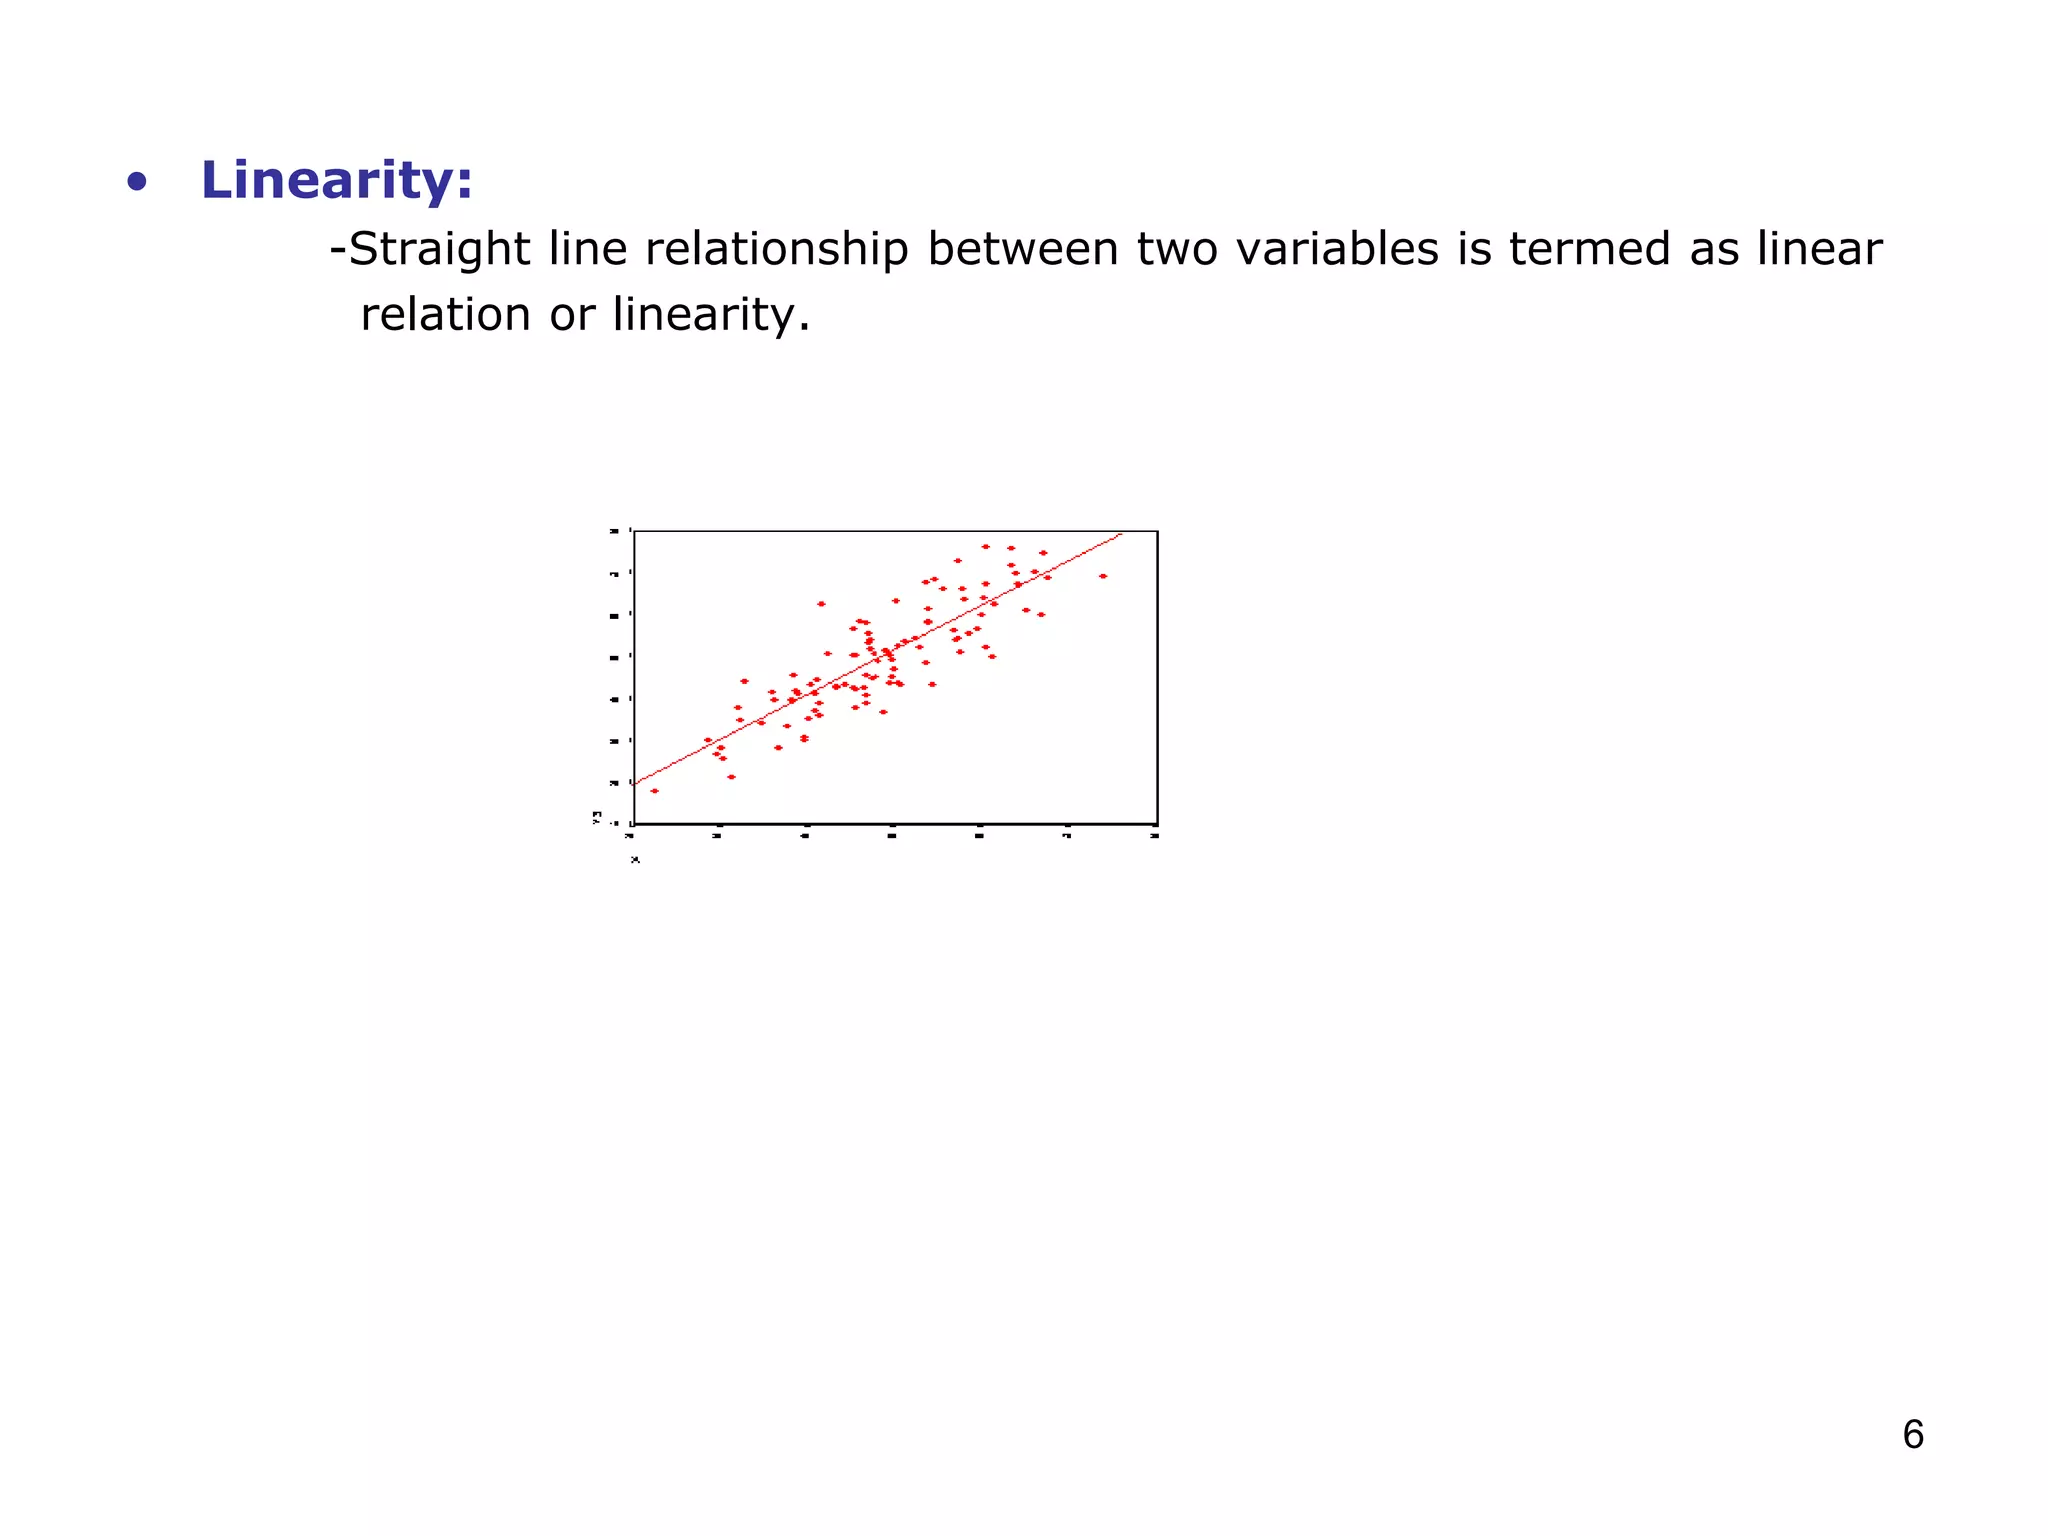
1
Regression Analysis
2
Regression – Basic Concepts
• What is regression analysis?
- It is multivariate dependence technique used to find linear
relationship between one metric dependent variable and more metric
independent variables
• When is regression analaysis used?
- Identifies factors which contribute to take up that brand.
- Identifies the factor which influences a consumer's impression on a
brand
- Identifies the features which make it more likely to buy that brand.
• Regression model:
- The two types of regression model are
Simple regression
Multiple regression
3
Simple Regression:
In Simple Regression only one dependent variable and only
one independent variable is present in the analysis.
Y = a + bX
Where ‘a’ is intercept, ‘b’ is regression coefficient.
Multiple Regression:
In multiple Regression there are one dependent variable and
more than one independent variables present in the analysis.
Y = a + b1 X1 + b2 X2 +…+ bn Xn
a is intercept, represents the amount of dependent Y when all independents
are “0” & b’s are regression coefficients
4
Data Types:
Variables in the regression analysis must be metric.
Variables used for regression analysis are
•Price
•Cost
•Demand
•Supply
•Income
•Taste and Preferences
5
Normality:
-The variables satisfying the properties of normal distribution is
termed as normality.
- This can be detected using pp-plot or qq-plot ie.,
plotting expected cumulative probability against observed
cumulative probability is pp-plot.
Terminologies:
6
• Linearity:
-Straight line relationship between two variables is termed as linear
relation or linearity.
7
Outliers:
-Extreme values of a predictor or outcome variable that appear
discrepant from the other values .
Predicted values:
-Also called fitted values, substituting the regression coefficient
and the independent variables in the model we get the predicted
values for each case.
Residuals:
-Residuals are the difference between the observed values and
predicted values of the dependent variables.
8
Beta weights:
-Standardization of regression coefficient are called Beta Weights.
Ratio of Beta weights are the ratio of relative predictive power of the
independent variable.
R-Square :
-Proportion of the variation of dependent variable explained by
the independent variable.
Adjusted R-Square:
-Proportion of the variation of dependent variable explained by the
independent variable after adding or deletion of the variables.
Multicollinearity:
-Inter correlation among the independent variables.
9
VIF (Variance Inflation factor):
-It is a measure, used to find the amount of multicollinearity.
-VIF= 1/tolerance=1/1-R2
-Higher the VIF indicates higher the multicollinearity.
F Test:
-F Test is used to test the R square and it is same as to testing the
significance of the regression model.
-Null hypothesis: The data doesn’t fit the model i.e., we have to
reject the null hypothesis.
10
Assumptions:
• The variables should be metric variables.
• The sample size should be adequate i.e., each variable should have at
least ten observation.
• Linearity among the dependent and independent should be satisfied.
• Multicollinearity should be absent.
• Residuals should be normally distributed.
• Residuals should satisfy homoscedasticity property.
• Residuals should be independent.
• Multivariate normality for variables should be satisfied.
• No outliers.
11
Expected output:
• Model should be significant i.e., (Pr>F) ≤ 0.05.
• VIF should be ≤2.
• Condition index should be ≤ 15.
• Independent variable should be significant (Pr >t) ≤0.05.
• Standard estimates tells us the amount of variance of dependent variable
explained by that independent variable (tested using significance t test).
• R square tells the amount of variance explained by the model on the
whole (tested using significance F test).
• Parameter estimates can be negative or positive.
12
Thank
you 

Analysis using SPSS - H.H.The Rajha's College

  • 1.
  • 2.
    2 Regression – BasicConcepts • What is regression analysis? - It is multivariate dependence technique used to find linear relationship between one metric dependent variable and more metric independent variables • When is regression analaysis used? - Identifies factors which contribute to take up that brand. - Identifies the factor which influences a consumer's impression on a brand - Identifies the features which make it more likely to buy that brand. • Regression model: - The two types of regression model are Simple regression Multiple regression
  • 3.
    3 Simple Regression: In SimpleRegression only one dependent variable and only one independent variable is present in the analysis. Y = a + bX Where ‘a’ is intercept, ‘b’ is regression coefficient. Multiple Regression: In multiple Regression there are one dependent variable and more than one independent variables present in the analysis. Y = a + b1 X1 + b2 X2 +…+ bn Xn a is intercept, represents the amount of dependent Y when all independents are “0” & b’s are regression coefficients
  • 4.
    4 Data Types: Variables inthe regression analysis must be metric. Variables used for regression analysis are •Price •Cost •Demand •Supply •Income •Taste and Preferences
  • 5.
    5 Normality: -The variables satisfyingthe properties of normal distribution is termed as normality. - This can be detected using pp-plot or qq-plot ie., plotting expected cumulative probability against observed cumulative probability is pp-plot. Terminologies:
  • 6.
    6 • Linearity: -Straight linerelationship between two variables is termed as linear relation or linearity.
  • 7.
    7 Outliers: -Extreme values ofa predictor or outcome variable that appear discrepant from the other values . Predicted values: -Also called fitted values, substituting the regression coefficient and the independent variables in the model we get the predicted values for each case. Residuals: -Residuals are the difference between the observed values and predicted values of the dependent variables.
  • 8.
    8 Beta weights: -Standardization ofregression coefficient are called Beta Weights. Ratio of Beta weights are the ratio of relative predictive power of the independent variable. R-Square : -Proportion of the variation of dependent variable explained by the independent variable. Adjusted R-Square: -Proportion of the variation of dependent variable explained by the independent variable after adding or deletion of the variables. Multicollinearity: -Inter correlation among the independent variables.
  • 9.
    9 VIF (Variance Inflationfactor): -It is a measure, used to find the amount of multicollinearity. -VIF= 1/tolerance=1/1-R2 -Higher the VIF indicates higher the multicollinearity. F Test: -F Test is used to test the R square and it is same as to testing the significance of the regression model. -Null hypothesis: The data doesn’t fit the model i.e., we have to reject the null hypothesis.
  • 10.
    10 Assumptions: • The variablesshould be metric variables. • The sample size should be adequate i.e., each variable should have at least ten observation. • Linearity among the dependent and independent should be satisfied. • Multicollinearity should be absent. • Residuals should be normally distributed. • Residuals should satisfy homoscedasticity property. • Residuals should be independent. • Multivariate normality for variables should be satisfied. • No outliers.
  • 11.
    11 Expected output: • Modelshould be significant i.e., (Pr>F) ≤ 0.05. • VIF should be ≤2. • Condition index should be ≤ 15. • Independent variable should be significant (Pr >t) ≤0.05. • Standard estimates tells us the amount of variance of dependent variable explained by that independent variable (tested using significance t test). • R square tells the amount of variance explained by the model on the whole (tested using significance F test). • Parameter estimates can be negative or positive.
  • 12.