1. The document discusses econometrics and the linear regression model. It outlines the methodology of econometric research which includes stating a theory or hypothesis, specifying a mathematical model, specifying an econometric model, obtaining data, estimating parameters, hypothesis testing, forecasting, and using the model for policy purposes.
2. It provides an example of specifying Keynes' consumption function as the mathematical model C= β1 + β2X where C is consumption and X is income. For the econometric model, an error term is added to allow for inexact relationships.
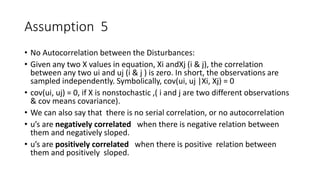
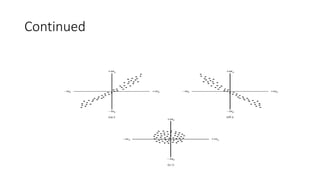
3. Assumptions of the classical linear regression model are discussed including the error term being uncorrelated with X, having a mean of zero,


![1. Statement of Theory or Hypothesis
Keynes stated:
The fundamental psychological law . . . is that men [women] are disposed,
as a rule and on average, to increase their consumption as their income
increases, but not as much as the increase in their income.10
In short, Keynes postulated that the marginal propensity to consume
(MPC), the rate of change of consumption for a unit (say, a dollar) change in
income, is greater than zero but less than 1.](https://image.slidesharecdn.com/mmodule1ppt-220807072831-8372f0c4/85/MModule-1-ppt-pptx-4-320.jpg)


![Assumption 4
• Homoscedasticity or Constant Variance of ui:
• var (ui) = E[ui − E(ui |Xi)]2
= E(u2i|Xi), because of Assumption 3
= E(u2i), if Xi are nonstochastic
= σ2
It means equal (homo) spread
(scedasticity) or equal variance](https://image.slidesharecdn.com/mmodule1ppt-220807072831-8372f0c4/85/MModule-1-ppt-pptx-24-320.jpg)