Downloaded 206 times
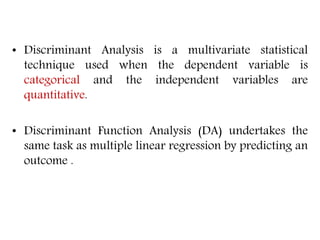
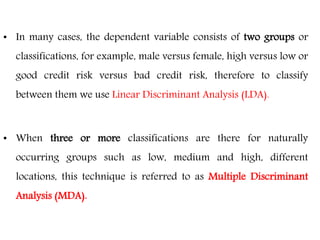
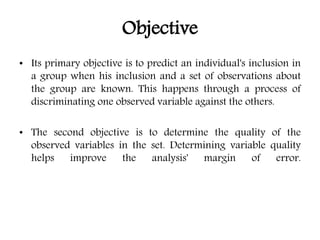
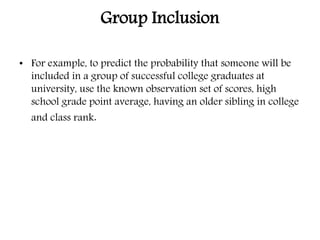


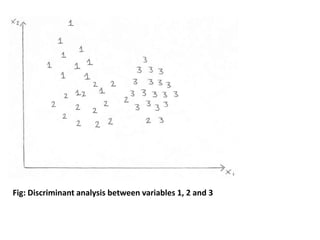

Discriminant analysis is a statistical technique used to determine which group or category an item belongs to based on characteristics. It predicts categorical dependent variables from continuous independent variables. Linear discriminant analysis (LDA) is used for two groups, while multiple discriminant analysis (MDA) handles three or more groups. The technique aims to accurately classify groups and determine which variables best predict group membership. It has applications in fields like agriculture, socioeconomics, and marketing.