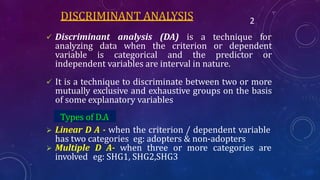
Sharumathi .R
ROLL NO: 22BA047
Discriminant Analysis
DISCRIMINANT ANALYSIS
 Discriminant analysis (DA) is a technique for
analyzing data when the criterion or dependent
variable is categorical and the predictor or
independent variables are interval in nature.
 It is a technique to discriminate between two or more
mutually exclusive and exhaustive groups on the basis
of some explanatory variables
 Linear D A - when the criterion / dependent variable
has two categories eg: adopters & non-adopters
 Multiple D A- when three or more categories are
involved eg: SHG1, SHG2,SHG3
2
Types of D.A
SIMILARITIES AND DIFFERENCES
3
ANALYSIS ANOVA REGRESSION DISCRIMINANT
One One One
Similarities
1.Number of dependent
variables
2.Number of independent Multiple Multiple Multiple
variables
Differences
1.Nature of the dependent Metric Metric Categorical
2.Nature of the independent Categorical Metric Metric
ASSUMPTIONS
1. Sample size (n)
▶group sizes of the dependent should not be grossly different i.e.
80:20. It should be at least five times the number of
independent variables.
2. Normal distribution
▶ Each of the independent variable is normally distributed.
3. Homogeneity of variances / covariances
▶ All variables have linear and homoscedastic relationships.
4. Outliers
▶ Outliers should not be present in the data. DA is highly
sensitive to the inclusion of outliers.
4
5
5. Non-multicollinearity
▶ There should NOT BE MULTICOLLINEARITY among
the independent variables.
6. Mutually exclusive
▶ The groups must be mutually exclusive, with every
subject or case belonging to only one group.
7. Classification
▶ Each of the allocations for the dependent
categories in the initial classification are correctly
classified.
DISCRIMINANT ANALYSIS MODEL
The discriminant analysis model involves linear combinations of
the following form:
D = b0 + b1X1 + b2X2 + b3X3 + . . . + bkXk
where
D = discriminant score
b 's = discriminant coefficient or weight
X 's = predictor or independent variable
▶ The coefficients, or weights (b), are estimated so that the
groups differ as much as possible on the values of the
discriminant function.
▶ Discriminant analysis – creates an equation which will
minimize the possibility of misclassifying cases into their
respective groups or categories
6
Hypothesis
▶ Discriminant analysis tests the following hypotheses:
H0: The group means of a set of independent variables
for two or more groups are equal.
Against
H1: The group means for two or more groups are not
equal
▶ This group means is referred to as a centroid.
7
STATISTICS ASSOCIATED WITH DISCRIMINANT
Analysis
▶ Canonical correlation:
Canonical correlation measures the extent of association
between the discriminant scores and the groups.
 It is a measure of association between the single discriminant function and
the set of dummy variables that define the group membership.
 The canonical correlation is the multiple correlation between the
predictors and the discriminant function
▶ Centroid. The centroid is the mean values for the
discriminant scores for a particular group.
 There are as many centroids as there are groups, as there is
one for each group. The means for a group on all the
functions are the group centroids.
8
▶ Classification matrix. Sometimes also called confusion
or prediction matrix, the classification matrix
contains the number of correctly classified and
misclassified cases.
▶ Discriminant function coefficients. The
discriminant function coefficients (unstandardized) are
the multipliers of variables, when the variables are in
the original units of measurement.
▶ F values and their significance. These are calculated
from a one-way ANOVA, with the grouping variable
serving as the categorical independent variable. Each
predictor, in turn, serves as the metric dependent
variable in the ANOVA.
9
 Discriminant scores. The unstandardized
coefficients are multiplied by the values of the
variables. These products are summed and added to the
constant term to obtain the discriminant scores.
▶ Eigenvalue. For each discriminant function, the
Eigenvalue is the ratio of between-group to within- group
sums of squares. Large Eigenvalues imply superior
functions.
▶ Pooled within-group correlation matrix. The pooled
within-group correlation matrix is computed by
averaging the separate covariance matrices for all the
groups.
10
11
▶ Standardized discriminant function coefficients.
The standardized discriminant function coefficients
are the discriminant function coefficients and are
used as the multipliers
▶ Structure correlations. Also referred to as
discriminant loadings, the structure correlations
represent the simple correlations between the
predictors and the discriminant function.
▶ Group means and group standard deviations.
These are computed for each predictor for each
group.
12
▶ Wilks‘ lambda . Sometimes also called the U statistic,
Wilks‘ λ for each predictor is the ratio of the within-
group sum of squares to the total sum of squares. Its
value varies between 0 and 1.
▶ Large values of λ (near 1) indicate that group means do
not seem to be different. Small values of λ (near 0)
indicate that the group means seem to be different. It is
(1-R2 ) where R2 is the canonical correlation
▶ It is used to measure how well each function separates
cases into groups. It also indicates the significance of
the discriminant function and provides the
proportion of total variability not explained.
13
Predicting group membership:
▶ Group centroids are calculated as 10.77 and 4.52.
by taking the mean of respective discriminant
scores of the Group. Thus the cut of score is
average of both = 7.65
▶One can predict a person’s choice of dependent
variable i.e. adopting / non – adopting
MULTIPLE DISCRIMINANT
ANALYSIS
▶ When we need to discriminate among more
than two groups, we use multiple
discriminant analysis.
▶This technique requires fitting g-1 number of
discriminant functions, where g is the
number of groups
▶Assumptions remain same for this type too..
▶The best D will be judged as per the
comparison between functions
14
15

diiscriminant analysis1.pptx

  • 1.
    Sharumathi .R ROLL NO:22BA047 Discriminant Analysis
  • 2.
    DISCRIMINANT ANALYSIS  Discriminantanalysis (DA) is a technique for analyzing data when the criterion or dependent variable is categorical and the predictor or independent variables are interval in nature.  It is a technique to discriminate between two or more mutually exclusive and exhaustive groups on the basis of some explanatory variables  Linear D A - when the criterion / dependent variable has two categories eg: adopters & non-adopters  Multiple D A- when three or more categories are involved eg: SHG1, SHG2,SHG3 2 Types of D.A
  • 3.
    SIMILARITIES AND DIFFERENCES 3 ANALYSISANOVA REGRESSION DISCRIMINANT One One One Similarities 1.Number of dependent variables 2.Number of independent Multiple Multiple Multiple variables Differences 1.Nature of the dependent Metric Metric Categorical 2.Nature of the independent Categorical Metric Metric
  • 4.
    ASSUMPTIONS 1. Sample size(n) ▶group sizes of the dependent should not be grossly different i.e. 80:20. It should be at least five times the number of independent variables. 2. Normal distribution ▶ Each of the independent variable is normally distributed. 3. Homogeneity of variances / covariances ▶ All variables have linear and homoscedastic relationships. 4. Outliers ▶ Outliers should not be present in the data. DA is highly sensitive to the inclusion of outliers. 4
  • 5.
    5 5. Non-multicollinearity ▶ Thereshould NOT BE MULTICOLLINEARITY among the independent variables. 6. Mutually exclusive ▶ The groups must be mutually exclusive, with every subject or case belonging to only one group. 7. Classification ▶ Each of the allocations for the dependent categories in the initial classification are correctly classified.
  • 6.
    DISCRIMINANT ANALYSIS MODEL Thediscriminant analysis model involves linear combinations of the following form: D = b0 + b1X1 + b2X2 + b3X3 + . . . + bkXk where D = discriminant score b 's = discriminant coefficient or weight X 's = predictor or independent variable ▶ The coefficients, or weights (b), are estimated so that the groups differ as much as possible on the values of the discriminant function. ▶ Discriminant analysis – creates an equation which will minimize the possibility of misclassifying cases into their respective groups or categories 6
  • 7.
    Hypothesis ▶ Discriminant analysistests the following hypotheses: H0: The group means of a set of independent variables for two or more groups are equal. Against H1: The group means for two or more groups are not equal ▶ This group means is referred to as a centroid. 7
  • 8.
    STATISTICS ASSOCIATED WITHDISCRIMINANT Analysis ▶ Canonical correlation: Canonical correlation measures the extent of association between the discriminant scores and the groups.  It is a measure of association between the single discriminant function and the set of dummy variables that define the group membership.  The canonical correlation is the multiple correlation between the predictors and the discriminant function ▶ Centroid. The centroid is the mean values for the discriminant scores for a particular group.  There are as many centroids as there are groups, as there is one for each group. The means for a group on all the functions are the group centroids. 8
  • 9.
    ▶ Classification matrix.Sometimes also called confusion or prediction matrix, the classification matrix contains the number of correctly classified and misclassified cases. ▶ Discriminant function coefficients. The discriminant function coefficients (unstandardized) are the multipliers of variables, when the variables are in the original units of measurement. ▶ F values and their significance. These are calculated from a one-way ANOVA, with the grouping variable serving as the categorical independent variable. Each predictor, in turn, serves as the metric dependent variable in the ANOVA. 9
  • 10.
     Discriminant scores.The unstandardized coefficients are multiplied by the values of the variables. These products are summed and added to the constant term to obtain the discriminant scores. ▶ Eigenvalue. For each discriminant function, the Eigenvalue is the ratio of between-group to within- group sums of squares. Large Eigenvalues imply superior functions. ▶ Pooled within-group correlation matrix. The pooled within-group correlation matrix is computed by averaging the separate covariance matrices for all the groups. 10
  • 11.
    11 ▶ Standardized discriminantfunction coefficients. The standardized discriminant function coefficients are the discriminant function coefficients and are used as the multipliers ▶ Structure correlations. Also referred to as discriminant loadings, the structure correlations represent the simple correlations between the predictors and the discriminant function. ▶ Group means and group standard deviations. These are computed for each predictor for each group.
  • 12.
    12 ▶ Wilks‘ lambda. Sometimes also called the U statistic, Wilks‘ λ for each predictor is the ratio of the within- group sum of squares to the total sum of squares. Its value varies between 0 and 1. ▶ Large values of λ (near 1) indicate that group means do not seem to be different. Small values of λ (near 0) indicate that the group means seem to be different. It is (1-R2 ) where R2 is the canonical correlation ▶ It is used to measure how well each function separates cases into groups. It also indicates the significance of the discriminant function and provides the proportion of total variability not explained.
  • 13.
    13 Predicting group membership: ▶Group centroids are calculated as 10.77 and 4.52. by taking the mean of respective discriminant scores of the Group. Thus the cut of score is average of both = 7.65 ▶One can predict a person’s choice of dependent variable i.e. adopting / non – adopting
  • 14.
    MULTIPLE DISCRIMINANT ANALYSIS ▶ Whenwe need to discriminate among more than two groups, we use multiple discriminant analysis. ▶This technique requires fitting g-1 number of discriminant functions, where g is the number of groups ▶Assumptions remain same for this type too.. ▶The best D will be judged as per the comparison between functions 14
  • 15.