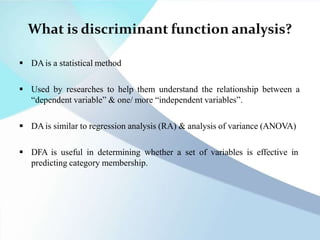
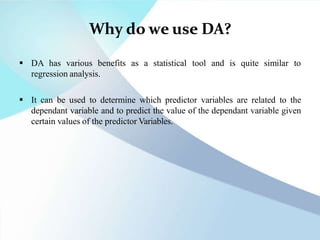
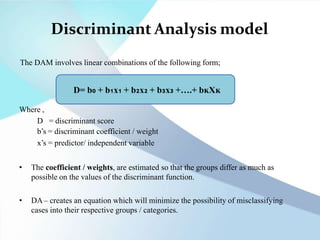
Discriminant function analysis (DFA) is a statistical technique used to determine which variables are best at predicting group membership. It creates linear combinations of predictor variables called discriminant functions that discriminate between categories of a dependent variable. DFA is similar to regression and ANOVA. It works by maximizing between-group differences and minimizing within-group differences to classify cases into groups based on predictor variables. The assumptions of DFA include normally distributed predictors and equal variance-covariance matrices within groups.
This presentation discusses the application of discriminant analysis in sports research. One can understand the steps involved in the analysis and testing its assumptions.
Discriminant analysis is a technique that is used by the researcher to analyze the research data when the criterion or the dependent variable is categorical and the predictor or the independent variable is the interval in nature. The term categorical variable means that the predictor variable is divided into a number of categories.
DA is typically used when the groups are already defined prior to the study.
The end result of DA is a model that can be used for the prediction of group memberships. This model allows us to understand the relationship between the set of selected variables and the observations. Furthermore, this model will enable one to assess the contributions of different variables.
Levelwise PageRank with Loop-Based Dead End Handling Strategy : SHORT REPORT ...Subhajit Sahu
Abstract — Levelwise PageRank is an alternative method of PageRank computation which decomposes the input graph into a directed acyclic block-graph of strongly connected components, and processes them in topological order, one level at a time. This enables calculation for ranks in a distributed fashion without per-iteration communication, unlike the standard method where all vertices are processed in each iteration. It however comes with a precondition of the absence of dead ends in the input graph. Here, the native non-distributed performance of Levelwise PageRank was compared against Monolithic PageRank on a CPU as well as a GPU. To ensure a fair comparison, Monolithic PageRank was also performed on a graph where vertices were split by components. Results indicate that Levelwise PageRank is about as fast as Monolithic PageRank on the CPU, but quite a bit slower on the GPU. Slowdown on the GPU is likely caused by a large submission of small workloads, and expected to be non-issue when the computation is performed on massive graphs.
Quantitative Data AnalysisReliability Analysis (Cronbach Alpha) Common Method...2023240532
Quantitative data Analysis
Overview
Reliability Analysis (Cronbach Alpha)
Common Method Bias (Harman Single Factor Test)
Frequency Analysis (Demographic)
Descriptive Analysis
06-04-2024 - NYC Tech Week - Discussion on Vector Databases, Unstructured Data and AI
Discussion on Vector Databases, Unstructured Data and AI
https://www.meetup.com/unstructured-data-meetup-new-york/
This meetup is for people working in unstructured data. Speakers will come present about related topics such as vector databases, LLMs, and managing data at scale. The intended audience of this group includes roles like machine learning engineers, data scientists, data engineers, software engineers, and PMs.This meetup was formerly Milvus Meetup, and is sponsored by Zilliz maintainers of Milvus.
Adjusting primitives for graph : SHORT REPORT / NOTESSubhajit Sahu
Graph algorithms, like PageRank Compressed Sparse Row (CSR) is an adjacency-list based graph representation that is
Multiply with different modes (map)
1. Performance of sequential execution based vs OpenMP based vector multiply.
2. Comparing various launch configs for CUDA based vector multiply.
Sum with different storage types (reduce)
1. Performance of vector element sum using float vs bfloat16 as the storage type.
Sum with different modes (reduce)
1. Performance of sequential execution based vs OpenMP based vector element sum.
2. Performance of memcpy vs in-place based CUDA based vector element sum.
3. Comparing various launch configs for CUDA based vector element sum (memcpy).
4. Comparing various launch configs for CUDA based vector element sum (in-place).
Sum with in-place strategies of CUDA mode (reduce)
1. Comparing various launch configs for CUDA based vector element sum (in-place).
Opendatabay - Open Data Marketplace.pptxOpendatabay
Opendatabay.com unlocks the power of data for everyone. Open Data Marketplace fosters a collaborative hub for data enthusiasts to explore, share, and contribute to a vast collection of datasets.
First ever open hub for data enthusiasts to collaborate and innovate. A platform to explore, share, and contribute to a vast collection of datasets. Through robust quality control and innovative technologies like blockchain verification, opendatabay ensures the authenticity and reliability of datasets, empowering users to make data-driven decisions with confidence. Leverage cutting-edge AI technologies to enhance the data exploration, analysis, and discovery experience.
From intelligent search and recommendations to automated data productisation and quotation, Opendatabay AI-driven features streamline the data workflow. Finding the data you need shouldn't be a complex. Opendatabay simplifies the data acquisition process with an intuitive interface and robust search tools. Effortlessly explore, discover, and access the data you need, allowing you to focus on extracting valuable insights. Opendatabay breaks new ground with a dedicated, AI-generated, synthetic datasets.
Leverage these privacy-preserving datasets for training and testing AI models without compromising sensitive information. Opendatabay prioritizes transparency by providing detailed metadata, provenance information, and usage guidelines for each dataset, ensuring users have a comprehensive understanding of the data they're working with. By leveraging a powerful combination of distributed ledger technology and rigorous third-party audits Opendatabay ensures the authenticity and reliability of every dataset. Security is at the core of Opendatabay. Marketplace implements stringent security measures, including encryption, access controls, and regular vulnerability assessments, to safeguard your data and protect your privacy.
3. What is discriminant function analysis?
DAis a statistical method
Used by researches to help them understand the relationship between a
“dependent variable” & one/ more “independent variables”.
DAis similar to regression analysis (RA) & analysis of variance (ANOVA)
DFA is useful in determining whether a set of variables is effective in
predicting category membership.
4. What are discriminant functions?
Discriminant analysis works by creating one or more linear combinations
of predictors, creating a new latent variable for each function. These
functions are called as “discriminant functions”.
5. Why do we use DA?
DA has various benefits as a statistical tool and is quite similar to
regression analysis.
It can be used to determine which predictor variables are related to the
dependant variable and to predict the value of the dependant variable given
certain values of the predictor Variables.
6. When to use DA
Data must be from different groups. Membership of group should be
already known before the starting analysis.
It is used for the analysis of differences in groups.
It is used for classification of new objects.
7. Purposeof DA
The objective of DA is to develop discriminant functions that are nothing
but the linear combination of independent variables that will discriminate
between the categories of the dependent variable in a perfect manner.
8. Basics of DFA
Discriminating variables (predictors):
independent variables which construct a discriminant function
Dependent variable (criterion variable):
Object of classification on the basis of independent variables
Needs to be categorical
Known as grouping variables in SPSS.
9. Steps in analysis
Step 1
The
independent
variables
which have
the
discriminati
ng power
are being
chosen
Step 2
A
discriminant
function
model is
developed by
using the
coefficients of
independent
variables.
Step 3
Wilk’s
lambda is
computed for
testing the
significance
of
discriminant
function
Step 4
The
independent
variables
which possess
importance in
discriminatin
g the groups
are being
found
Step 5
Classificatio
n of subjects
to their
respective
group is
being made
10. DA in R programming
DFA (2 groups)
library(dplyr)
library(haven)
library(ggplot2)
mydat <- read_sav("C:/Users/cpflower/Dropbox (UNC
Charlotte)/RSCH8140/R/DFA/pope.sav")
View(mydat)
scatterplotMatrix(mydat[2:4])
install.packages("DFA.data")
library(DFA.data)
DFA(data=mydat, groups="gp", variables=c('wi', 'wc', 'pc'),
predictive=TRUE, prior='SIZES', verbose=TRUE)
11. Discriminant Analysis model
The DAM involves linear combinations of the following form;
D= b₀ + b₁x₁ + b₂x₂ + b₃x₃ +….+ bĸXĸ
Where ,
D = discriminant score
b’s = discriminant coefficient / weight
x’s = predictor/ independent variable
• The coefficient / weights, are estimated so that the groups differ as much as
possible on the values of the discriminant function.
• DA– creates an equation which will minimize the possibility of misclassifying
cases into their respective groups / categories.
12. Hypothesis
• DAtests the following hypotheses;
• H₀: the group means of a set of independent variables for two /more groups
are equal.
• H₁: the group means for two/ more groups are not equal.
• Here, this group means is referred to as a centroid.
13.
14. 1) Linear Discriminant Analysis
• Alinear combination of features
• Ronald Fishers in 1936
• This methods group images of the same classes & separates images of the
different classes.
• To identify an input test image, the projected test image is compared to each
projected training image, & the test image is identified as the closest training
image.
• This classification involving 2 target categories & 2 predictor variables.
• Images are projected from 2D spaces to C dimensional space, where C is the
no. of classes of the images.
15. How does LDA work?
Step 1:
• To calculate the seperability between
different classes also called as
between – class variance.
Step 2:
• To calculate the distance between the
mean & sample of each class, is
called the within class variance.
step 3:
• To construct the lower dimensional
space which maximizes the between
class variance & minimizes the within
class variance.
17. 2) Multiple Discriminant analysis
• To discriminate among more than 2 groups
• It requires g-1 no. of discriminant functions, where g is the no. of groups
• The best discriminant will be judged as per the comparison between
functions.
• Similar to multiple regression
• assumptions remain same.
18. Assumptions in DA
Assumptions:
• Apredictors are normally distributed
• The variance covariance matrices for the predictors within each of the
groups are equal.
Sample size
Normal distribution
Homogenecity of variance/covariances
Outliers
Non- multicollinearity
Mutually exclusive
Classification
Variability
19. Advantages
Discrimination of different groups
Accuracy of classification groups can be determined
Helps for categorical regression analysis
Visual graphics makes clear & understanding 2/ more categories.
20. Limitations
LD can’t be used when subgroups are stronger.
Predictor variables don’t strong.
It can’t be used when there is insufficient data
It was not usable to less no. of observation
Small distribution gives good discriminant functions between groups.
Large distribution gives poor discriminant functions between groups.
21. Applications
Prediction & description DA
Agriculture, fisheries, crop & yield studies, geoinformatics, bioinformatics, social
sciences, researches.
Socio economics
Hydrological & physico-chemical studies in water sources
Face recognition
Marketing
Financial research
Human resources