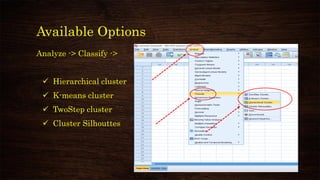
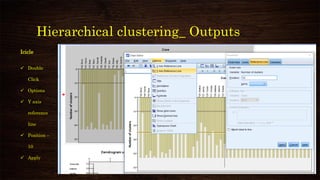
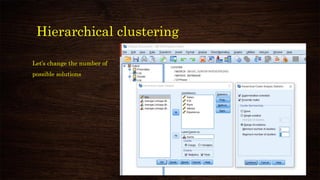
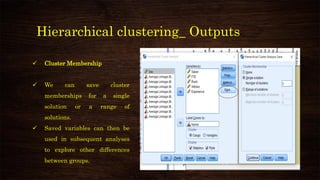
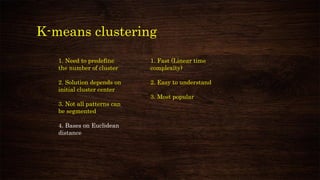
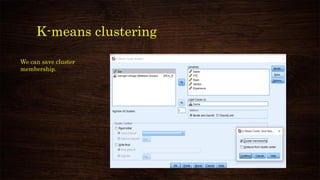
MULTIVARIATE
ANALYSIS
- Dr Nisha Arora
About Me Concepts
How it Works? Q/A Session
Agenda
• Dr. Nisha Arora is a proficient educator, passionate trainer,
You Tuber, occasional writer, and a learner forever.
✓ PhD in Mathematics.
✓ Works in the area of Data Science, Statistical
Research, Data Visualization & Storytelling
✓ Creator of various courses
✓ Contributor to various research communities and
Q/A forums
✓ Mentor for women in Tech Global
3
About Me
An educator by heart & a
trainer by profession.
http://stats.stackexchange.com/users/79100/learner
https://stackoverflow.com/users/5114585/dr-nisha-arora
https://www.quora.com/profile/Nisha-Arora-9
https://www.researchgate.net/profile/Nisha_Arora2/contributions
http://learnerworld.tumblr.com/
https://www.slideshare.net/NishaArora1
https://scholar.google.com/citations?user=JgCRWh4AAAAJ&hl=en&authuser=
1
https://www.youtube.com/channel/UCniyhvrD_8AM2jXki3eEErw
https://groups.google.com/g/dataanalysistraining/search?q=nisha%20arora
https://www.linkedin.com/in/drnishaarora/detail/recent-activity/posts/
✓ Research Queries
✓ Coding Queries
✓ Blog Posts
✓ Slide Decks
✓ My Talks
✓ Publications
✓ Lectures
✓ Layman’s Term
Explanation
✓ Mentoring
✓ Articles & Much More
My Contribution to the Community
❖ Statistics
❖ Data Analysis
❖ Machine Learning
❖ Analytics & Data Science
❖ Data Visualization & Storytelling
❖ Mathematics & Operations Research
❖ Online Teaching
❖ Excel/SPSS/R/Python/Shiny
❖ Tableau/PowerBI
My Expertise
Connect With Me
HTTPS://WWW.LINKEDIN.COM/IN/DRNISHAARORA/
DR.ARORANISHA@GMAIL.COM .
Cluster Analysis
USING SPSS
Applications
✓ Clusters of covid active cases
✓ Assign projects to different teams of students where each
team member have similar interest
✓ Customer segmentation
✓ Market Basket Analysis
Clustering Evaluations
✓ Within group variation should be less
✓ Between group variation should be more
Clustering Evaluations
Clustering Algorithms
Clustering
Techniques
Hierarchical
Divisive
Agglomerative
Partitional
Centroid
Model Based
Graph
Theoretic
Spectral
Bayesian
Decision Based
Non-
parametric
Clustering Algorithms
Available Options
Analyze -> Classify ->
✓ Hierarchical cluster
✓ K-means cluster
✓ TwoStep cluster
✓ Cluster Silhouttes
Hierarchical clustering
Hierarchical clustering_ Outputs
Proximity Matrix
It gives the distances or similarities
between items.
✓ Double Click
✓ Pivot
Hierarchical clustering_ Outputs
Agglomeration schedule
It displays the cases or clusters
combined at each stage, the
distances between the cases or
clusters being combined, and the
last cluster level at which a case
(or variable) joined the cluster.
Hierarchical clustering_ Outputs
Icicle
✓ It displays an
icicle plot,
including all
clusters or a
specified
range of
clusters.
✓ It displays
information
about how
cases are
combined into
clusters at
each iteration
of the
analysis.
Hierarchical clustering_ Outputs
Icicle
✓ Double
Click
✓ Options
✓ Y axis
reference
line
✓ Position –
10
✓ Apply
Hierarchical clustering_ Outputs
Dendrograms can be used to assess the cohesiveness of the clusters formed and can provide information about
the appropriate number of clusters to keep.
Possible Clusters – 2/3/6/…
Cluster Sizes ?
Hierarchical clustering
Let’s change the number of
possible solutions
Hierarchical clustering _ Output
We get additional output
as cluster membership
Hierarchical clustering
Let’s change the icicles for
specified range of clusters
Hierarchical clustering _ Output
Let’s change the icicles for
specified range of clusters
Hierarchical clustering_ Outputs
✓ Cluster Membership
✓ We can save cluster
memberships for a single
solution or a range of
solutions.
✓ Saved variables can then be
used in subsequent analyses
to explore other differences
between groups.
Understanding the clusters
Cross Tab between rank and cluster
membership
We need to give suitable names to the
clusters.
Understanding the clusters
We need to give suitable names to
the clusters.
We can do it in variable view
Let’s give the names:
Cluster 1: Seniors
Cluster 3: Adjuncts
Cluster 2: Others
Understanding the clusters
We need to give suitable
names to the clusters.
We can do it in variable view
Let’s give the names:
Cluster 1: Seniors
Cluster 3: Adjuncts
Cluster 2: Others
Understanding the clustering
Although cell count is too low & chi-
square statistics is not reliable, still
we see there’s no association between
sex & cluster membership prima
facie.
Validating Hierarchical Clustering
Double click ‘Agglomerative Schedule’
table → Select ‘Coefficients’ → Right click
→ Create Graph → Line
Look at the plot (like scree plot in factor
analysis) → Elbow should be formed
Find stage number where elbow is formed
Number of clusters = Total cases – stage
number where elbow is formed
K-means clustering
1. Need to predefine
the number of cluster
2. Solution depends on
initial cluster center
3. Not all patterns can
be segmented
4. Bases on Euclidean
distance
1. Fast (Linear time
complexity)
2. Easy to understand
3. Most popular
K-means clustering
Number of Cluster:
Ideally between 2 to 5
[Subjective]
Number of iteration:
10/20 should be enough
K-means clustering
We can save cluster
membership.
K-means clustering
In ‘Statistics’ sub-
dialog box:
Initial cluster center:
Randomly chosen
K-means clustering _Output
We get almost similar cluster membership
Actually, we should first standardize scores
Also, k-means works on Euclidean distance
To validate K-means clustering
Analyze → Compare Means → Take all variables
used for clustering in ‘Dependent List’
And cluster membership in ‘Factor’ →
Run ‘Bonferroni or Tukey post hoc test →
See if all p-values are less than level of
significant (0.05)
How to standardize variables
Analyze → Select variables → Check
‘Save standardized values as variables’
→ Click ‘OK’
How to convert string variables to
categorical
Transform → Automatic Recode →
Double-click variable State in the left
column to move it to the Variable →
‘New Name box’: Enter a name for the
new, recoded variable in the New Name
field → click ‘Add New Name’
Check the box for Treat blank string
values as user-missing.
Click OK to finish
How to add ID column to data
Transform → Compute Variable →
Give a name to ‘Target variable,
say, ‘ID’→ Type ‘$CASENUM’ in
Numeric Expression box (Or double
click on $Casenum function from
Functions & Special Variables
menu) → click ‘OK’
Thank You

Cluster analysis using spss