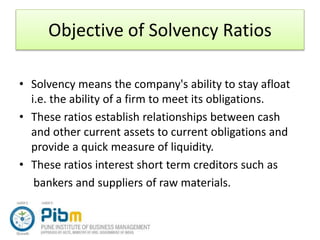
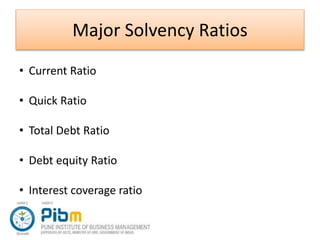
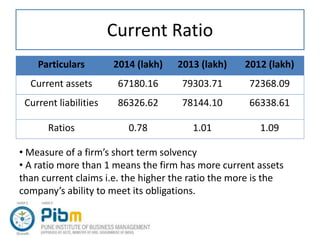
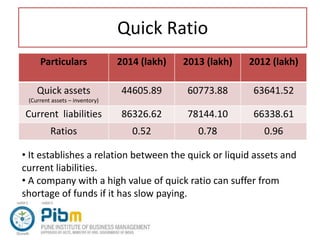
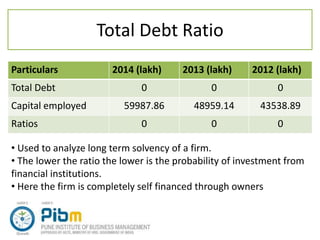
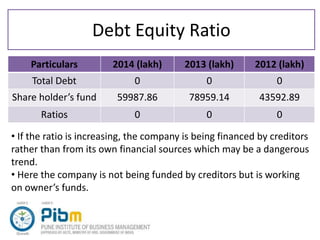
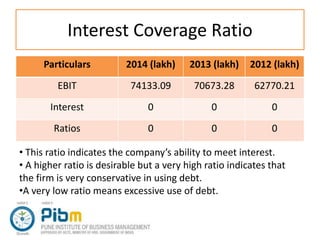
Solvency Ratios Analysis
Presented by :
Abhishek kumar
Objective of Solvency Ratios
• Solvency means the company's ability to stay afloat
i.e. the ability of a firm to meet its obligations.
• These ratios establish relationships between cash
and other current assets to current obligations and
provide a quick measure of liquidity.
• These ratios interest short term creditors such as
bankers and suppliers of raw materials.
Major Solvency Ratios
• Current Ratio
• Quick Ratio
• Total Debt Ratio
• Debt equity Ratio
• Interest coverage ratio
Current Ratio
Particulars 2014 (lakh) 2013 (lakh) 2012 (lakh)
Current assets 67180.16 79303.71 72368.09
Current liabilities 86326.62 78144.10 66338.61
Ratios 0.78 1.01 1.09
• Measure of a firm’s short term solvency
• A ratio more than 1 means the firm has more current assets
than current claims i.e. the higher the ratio the more is the
company’s ability to meet its obligations.
Quick Ratio
Particulars 2014 (lakh) 2013 (lakh) 2012 (lakh)
Quick assets
(Current assets – inventory)
44605.89 60773.88 63641.52
Current liabilities 86326.62 78144.10 66338.61
Ratios 0.52 0.78 0.96
• It establishes a relation between the quick or liquid assets and
current liabilities.
• A company with a high value of quick ratio can suffer from
shortage of funds if it has slow paying.
Total Debt Ratio
Particulars 2014 (lakh) 2013 (lakh) 2012 (lakh)
Total Debt 0 0 0
Capital employed 59987.86 48959.14 43538.89
Ratios 0 0 0
• Used to analyze long term solvency of a firm.
• The lower the ratio the lower is the probability of investment from
financial institutions.
• Here the firm is completely self financed through owners
Debt Equity Ratio
Particulars 2014 (lakh) 2013 (lakh) 2012 (lakh)
Total Debt 0 0 0
Share holder’s fund 59987.86 78959.14 43592.89
Ratios 0 0 0
• If the ratio is increasing, the company is being financed by creditors
rather than from its own financial sources which may be a dangerous
trend.
• Here the company is not being funded by creditors but is working
on owner’s funds.
Interest Coverage Ratio
Particulars 2014 (lakh) 2013 (lakh) 2012 (lakh)
EBIT 74133.09 70673.28 62770.21
Interest 0 0 0
Ratios 0 0 0
• This ratio indicates the company’s ability to meet interest.
• A higher ratio is desirable but a very high ratio indicates that
the firm is very conservative in using debt.
•A very low ratio means excessive use of debt.
THANK YOU

Solvency ratio analysis

  • 1.
  • 2.
    Objective of SolvencyRatios • Solvency means the company's ability to stay afloat i.e. the ability of a firm to meet its obligations. • These ratios establish relationships between cash and other current assets to current obligations and provide a quick measure of liquidity. • These ratios interest short term creditors such as bankers and suppliers of raw materials.
  • 3.
    Major Solvency Ratios •Current Ratio • Quick Ratio • Total Debt Ratio • Debt equity Ratio • Interest coverage ratio
  • 4.
    Current Ratio Particulars 2014(lakh) 2013 (lakh) 2012 (lakh) Current assets 67180.16 79303.71 72368.09 Current liabilities 86326.62 78144.10 66338.61 Ratios 0.78 1.01 1.09 • Measure of a firm’s short term solvency • A ratio more than 1 means the firm has more current assets than current claims i.e. the higher the ratio the more is the company’s ability to meet its obligations.
  • 5.
    Quick Ratio Particulars 2014(lakh) 2013 (lakh) 2012 (lakh) Quick assets (Current assets – inventory) 44605.89 60773.88 63641.52 Current liabilities 86326.62 78144.10 66338.61 Ratios 0.52 0.78 0.96 • It establishes a relation between the quick or liquid assets and current liabilities. • A company with a high value of quick ratio can suffer from shortage of funds if it has slow paying.
  • 6.
    Total Debt Ratio Particulars2014 (lakh) 2013 (lakh) 2012 (lakh) Total Debt 0 0 0 Capital employed 59987.86 48959.14 43538.89 Ratios 0 0 0 • Used to analyze long term solvency of a firm. • The lower the ratio the lower is the probability of investment from financial institutions. • Here the firm is completely self financed through owners
  • 7.
    Debt Equity Ratio Particulars2014 (lakh) 2013 (lakh) 2012 (lakh) Total Debt 0 0 0 Share holder’s fund 59987.86 78959.14 43592.89 Ratios 0 0 0 • If the ratio is increasing, the company is being financed by creditors rather than from its own financial sources which may be a dangerous trend. • Here the company is not being funded by creditors but is working on owner’s funds.
  • 8.
    Interest Coverage Ratio Particulars2014 (lakh) 2013 (lakh) 2012 (lakh) EBIT 74133.09 70673.28 62770.21 Interest 0 0 0 Ratios 0 0 0 • This ratio indicates the company’s ability to meet interest. • A higher ratio is desirable but a very high ratio indicates that the firm is very conservative in using debt. •A very low ratio means excessive use of debt.
  • 9.