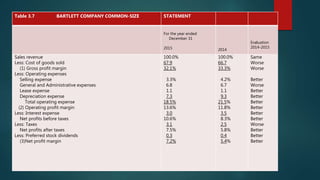
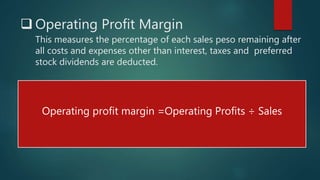
Profitability Ratios
Profitability Ratios
 These measures enable analysts to evaluate the firm’s
profits with respect to a given level of sales, a certain
level of assets, or the owners’ investment.
 Common-size income statements
 A useful tool for evaluating profitability in relation to
sales .
 An income statement in which each item is expressed
as a percentage of sales.
Three Profitability ratios found on
common-size income statement
1. Gross Profit Margin
2. Operational Profit Margin
3. Net Profit Margin
 Gross Profit Margin
-This measures the percentage of each sales peso
remaining after the firm has paid for its goods.
Gross profit margin = Sales – Cost of good sold = Gross profits
Sales Sales
TABLE 3.7
Table 3.7 BARTLETT COMPANY COMMON-SIZE STATEMENT
For the year ended
December 31
2015 2014
Evaluation
2014-2015
Sales revenue
Less: Cost of goods sold
(1) Gross profit margin
Less: Operating expenses
Selling expense
General and Administrative expenses
Lease expense
Depreciation expense
Total operating expense
(2) Operating profit margin
Less: Interest expense
Net profits before taxes
Less: Taxes
Net profits after taxes
Less: Preferred stock dividends
(3)Net profit margin
100.0%
67.9
32.1%
3.3%
6.8
1.1
7.3
18.5%
13.6%
3.0
10.6%
3.1
7.5%
0.3
7.2%
100.0%
66.7
33.3%
4.2%
6.7
1.1
9.3
21.5%
11.8%
3.5
8.3%
2.5
5.8%
0.4
5.4%
Same
Worse
Worse
Better
Worse
Better
Better
Better
Better
Better
Better
Worse
Better
Better
Better
 Operating Profit Margin
This measures the percentage of each sales peso remaining after
all costs and expenses other than interest, taxes and preferred
stock dividends are deducted.
Operating profit margin =Operating Profits ÷ Sales
Net Profit Margin
This measures the percentage of each sales peso
remaining after all costs and expenses including
interest, taxes and preferred stock dividends have been
deducted.
Net profit margin= earnings available for common stockholders ÷ Sales
Other Profitability Ratios
1. EARNINGS PER SHARE
2. RETURN ON TOTAL ASSETS
3. RETURN ON EQUITY
 Earnings per share (EPS)
The Firm is generally of interest to present or
prospective stockholders and management.
Earnings per share = Earnings available for common stockholders
Number of share of common stock outstanding
 Return on total assets (ROA)
Often called the return on investment (ROI) measures
the overall effectiveness of management in generating
profits with its available assets.
ROA = Earnings available for common stockholders ÷ Total assets
Return on equity (ROE)
Measures the return earned or the common
stockholders’ investment in the Firm.
ROE = Earnings available for common stockholders ÷ Common stock equity
THANKYOU! 

Profitability ratios

  • 1.
  • 2.
    Profitability Ratios  Thesemeasures enable analysts to evaluate the firm’s profits with respect to a given level of sales, a certain level of assets, or the owners’ investment.
  • 3.
     Common-size incomestatements  A useful tool for evaluating profitability in relation to sales .  An income statement in which each item is expressed as a percentage of sales.
  • 4.
    Three Profitability ratiosfound on common-size income statement 1. Gross Profit Margin 2. Operational Profit Margin 3. Net Profit Margin
  • 5.
     Gross ProfitMargin -This measures the percentage of each sales peso remaining after the firm has paid for its goods. Gross profit margin = Sales – Cost of good sold = Gross profits Sales Sales
  • 6.
    TABLE 3.7 Table 3.7BARTLETT COMPANY COMMON-SIZE STATEMENT For the year ended December 31 2015 2014 Evaluation 2014-2015 Sales revenue Less: Cost of goods sold (1) Gross profit margin Less: Operating expenses Selling expense General and Administrative expenses Lease expense Depreciation expense Total operating expense (2) Operating profit margin Less: Interest expense Net profits before taxes Less: Taxes Net profits after taxes Less: Preferred stock dividends (3)Net profit margin 100.0% 67.9 32.1% 3.3% 6.8 1.1 7.3 18.5% 13.6% 3.0 10.6% 3.1 7.5% 0.3 7.2% 100.0% 66.7 33.3% 4.2% 6.7 1.1 9.3 21.5% 11.8% 3.5 8.3% 2.5 5.8% 0.4 5.4% Same Worse Worse Better Worse Better Better Better Better Better Better Worse Better Better Better
  • 7.
     Operating ProfitMargin This measures the percentage of each sales peso remaining after all costs and expenses other than interest, taxes and preferred stock dividends are deducted. Operating profit margin =Operating Profits ÷ Sales
  • 8.
    Net Profit Margin Thismeasures the percentage of each sales peso remaining after all costs and expenses including interest, taxes and preferred stock dividends have been deducted. Net profit margin= earnings available for common stockholders ÷ Sales
  • 9.
    Other Profitability Ratios 1.EARNINGS PER SHARE 2. RETURN ON TOTAL ASSETS 3. RETURN ON EQUITY
  • 10.
     Earnings pershare (EPS) The Firm is generally of interest to present or prospective stockholders and management. Earnings per share = Earnings available for common stockholders Number of share of common stock outstanding
  • 11.
     Return ontotal assets (ROA) Often called the return on investment (ROI) measures the overall effectiveness of management in generating profits with its available assets. ROA = Earnings available for common stockholders ÷ Total assets
  • 12.
    Return on equity(ROE) Measures the return earned or the common stockholders’ investment in the Firm. ROE = Earnings available for common stockholders ÷ Common stock equity
  • 13.