Download as PDF, PPTX


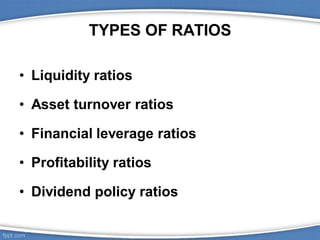
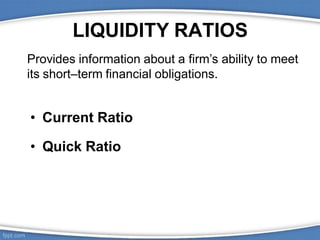
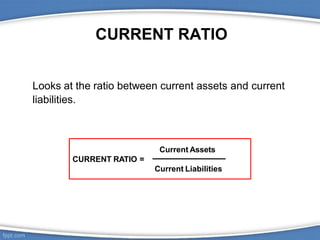


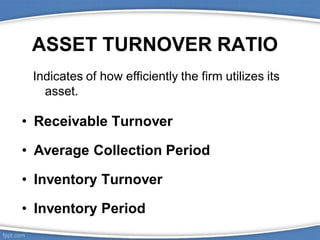

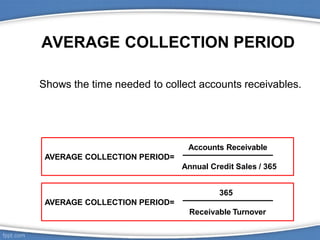
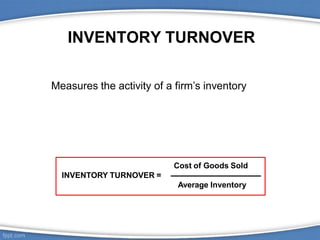
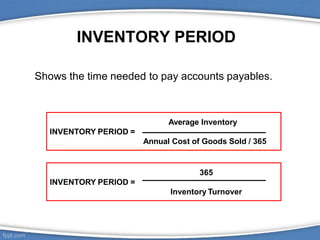


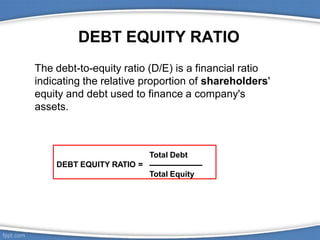
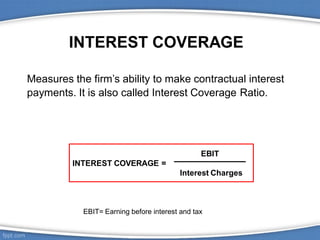


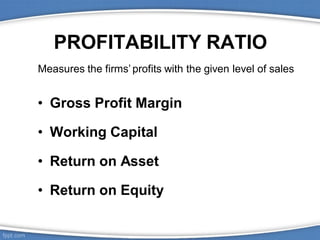

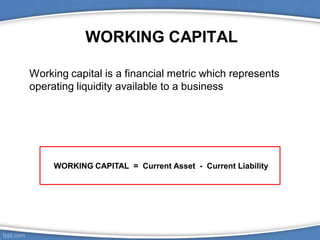
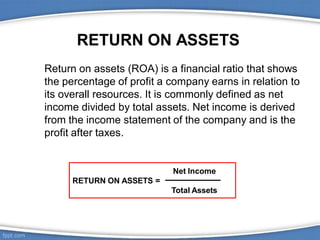


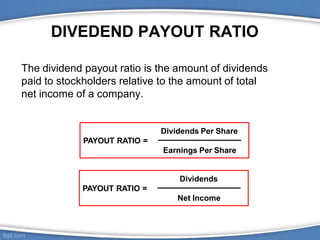


This document discusses various financial ratios used to analyze a company's financial statements. It defines key ratios such as current ratio, quick ratio, debt ratio, return on assets, gross profit margin, and dividend payout ratio. It explains how these ratios are calculated using figures from the income statement, balance sheet, and statement of cash flows. The ratios allow comparisons of a company's performance over time and against other companies to evaluate liquidity, profitability, leverage, and dividend policies.


