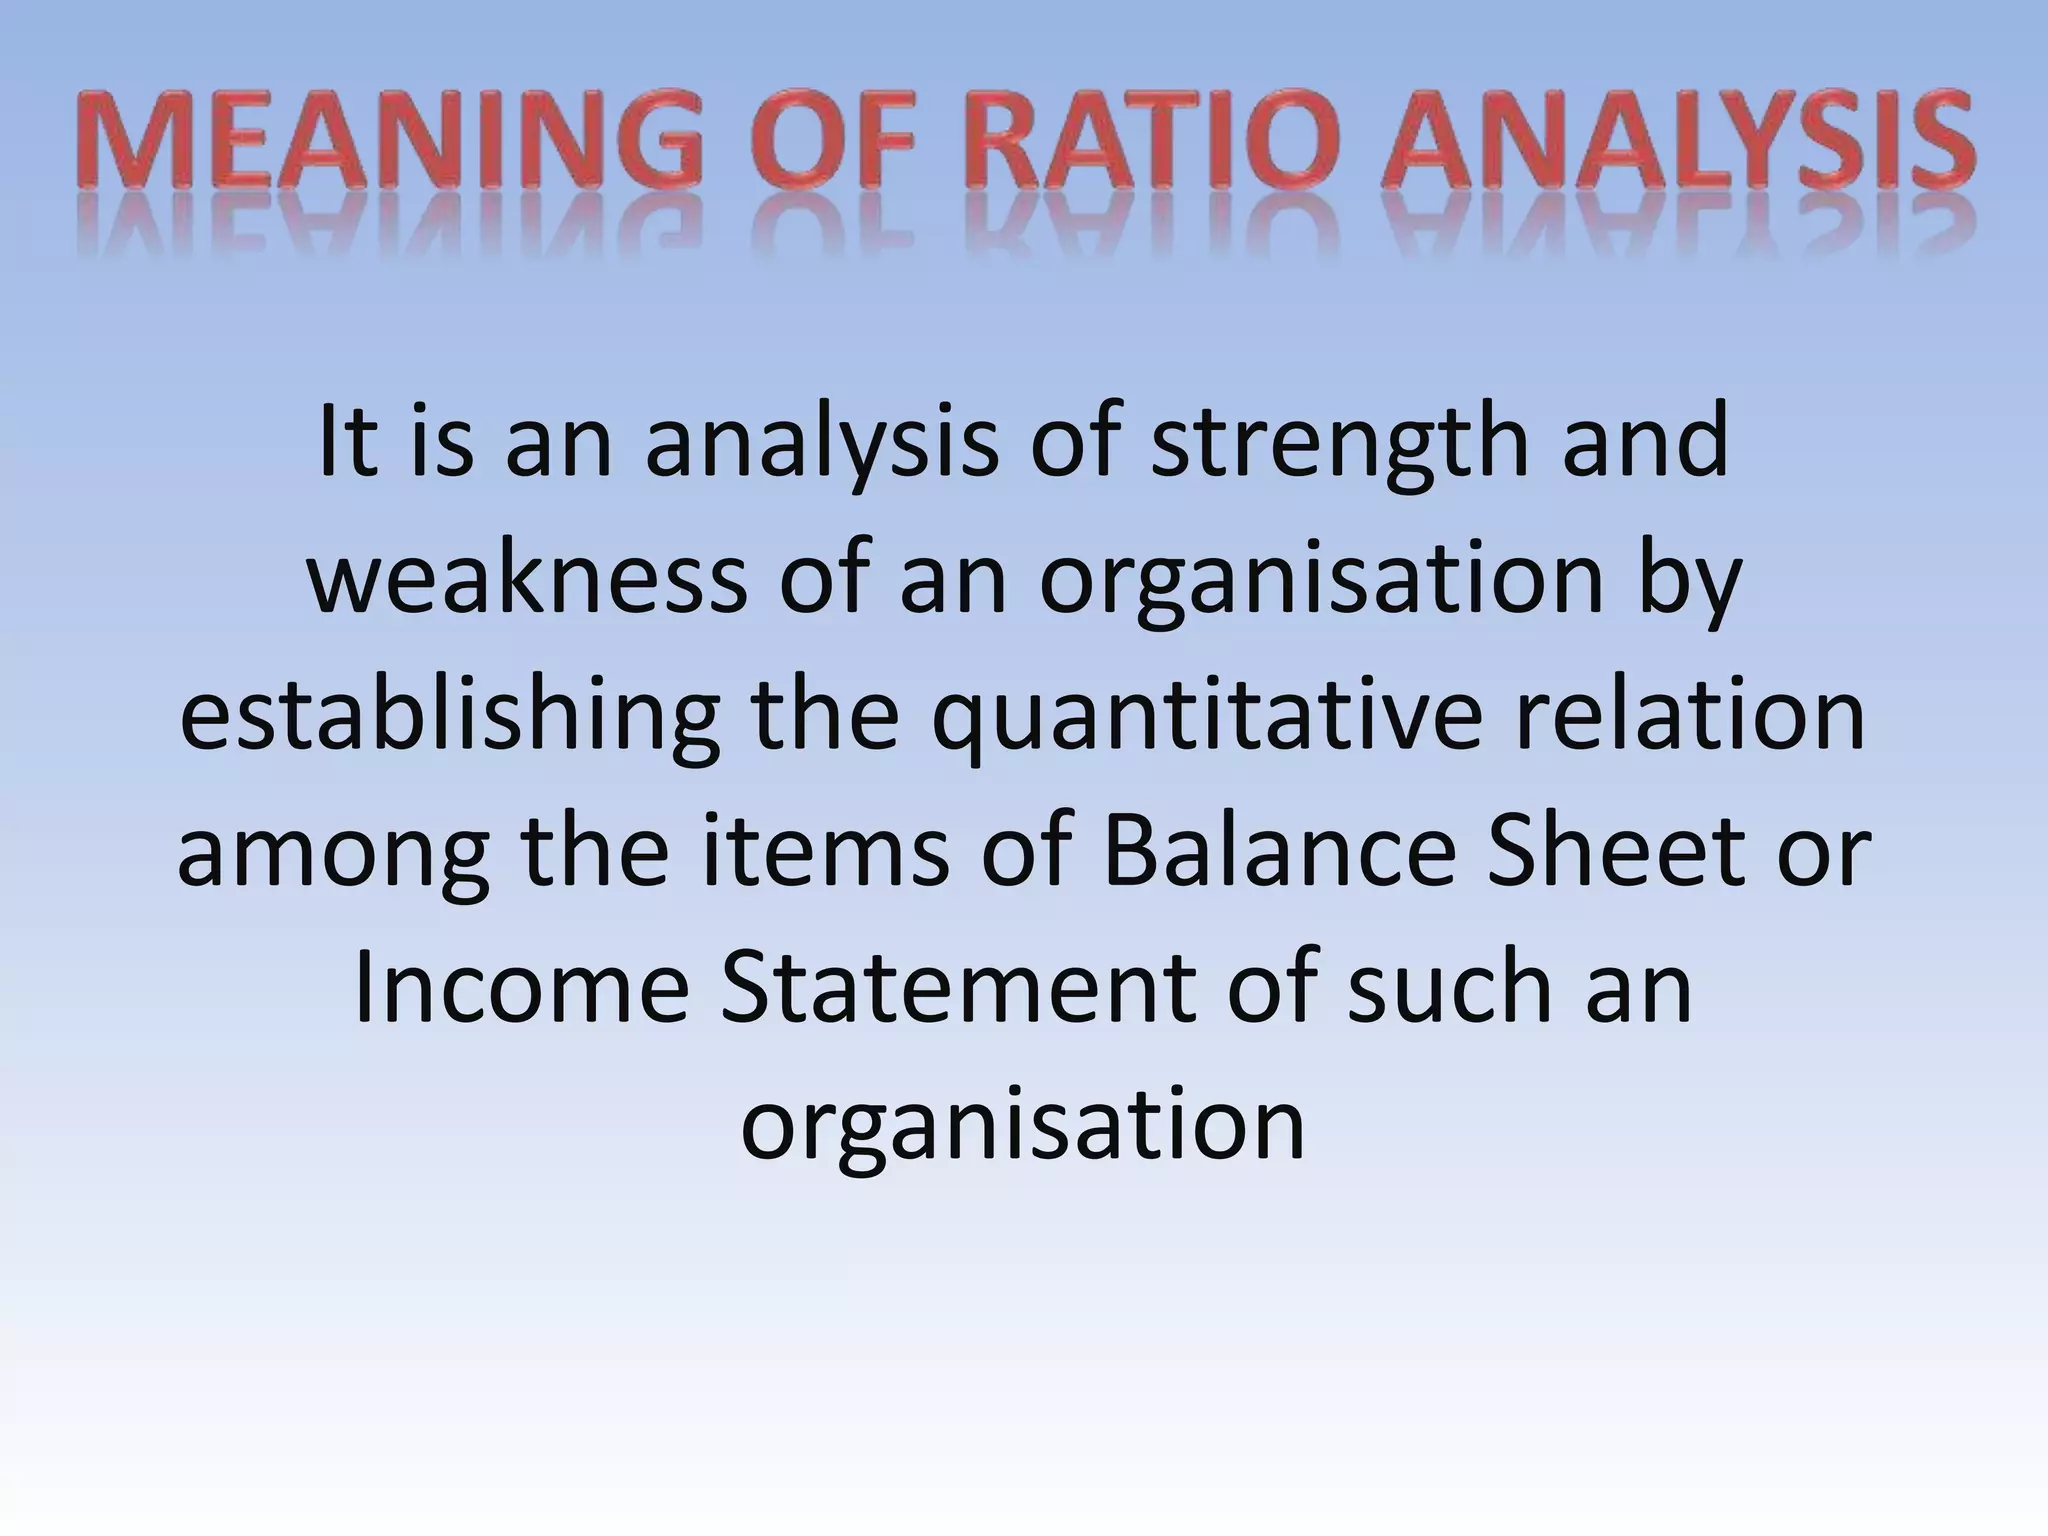
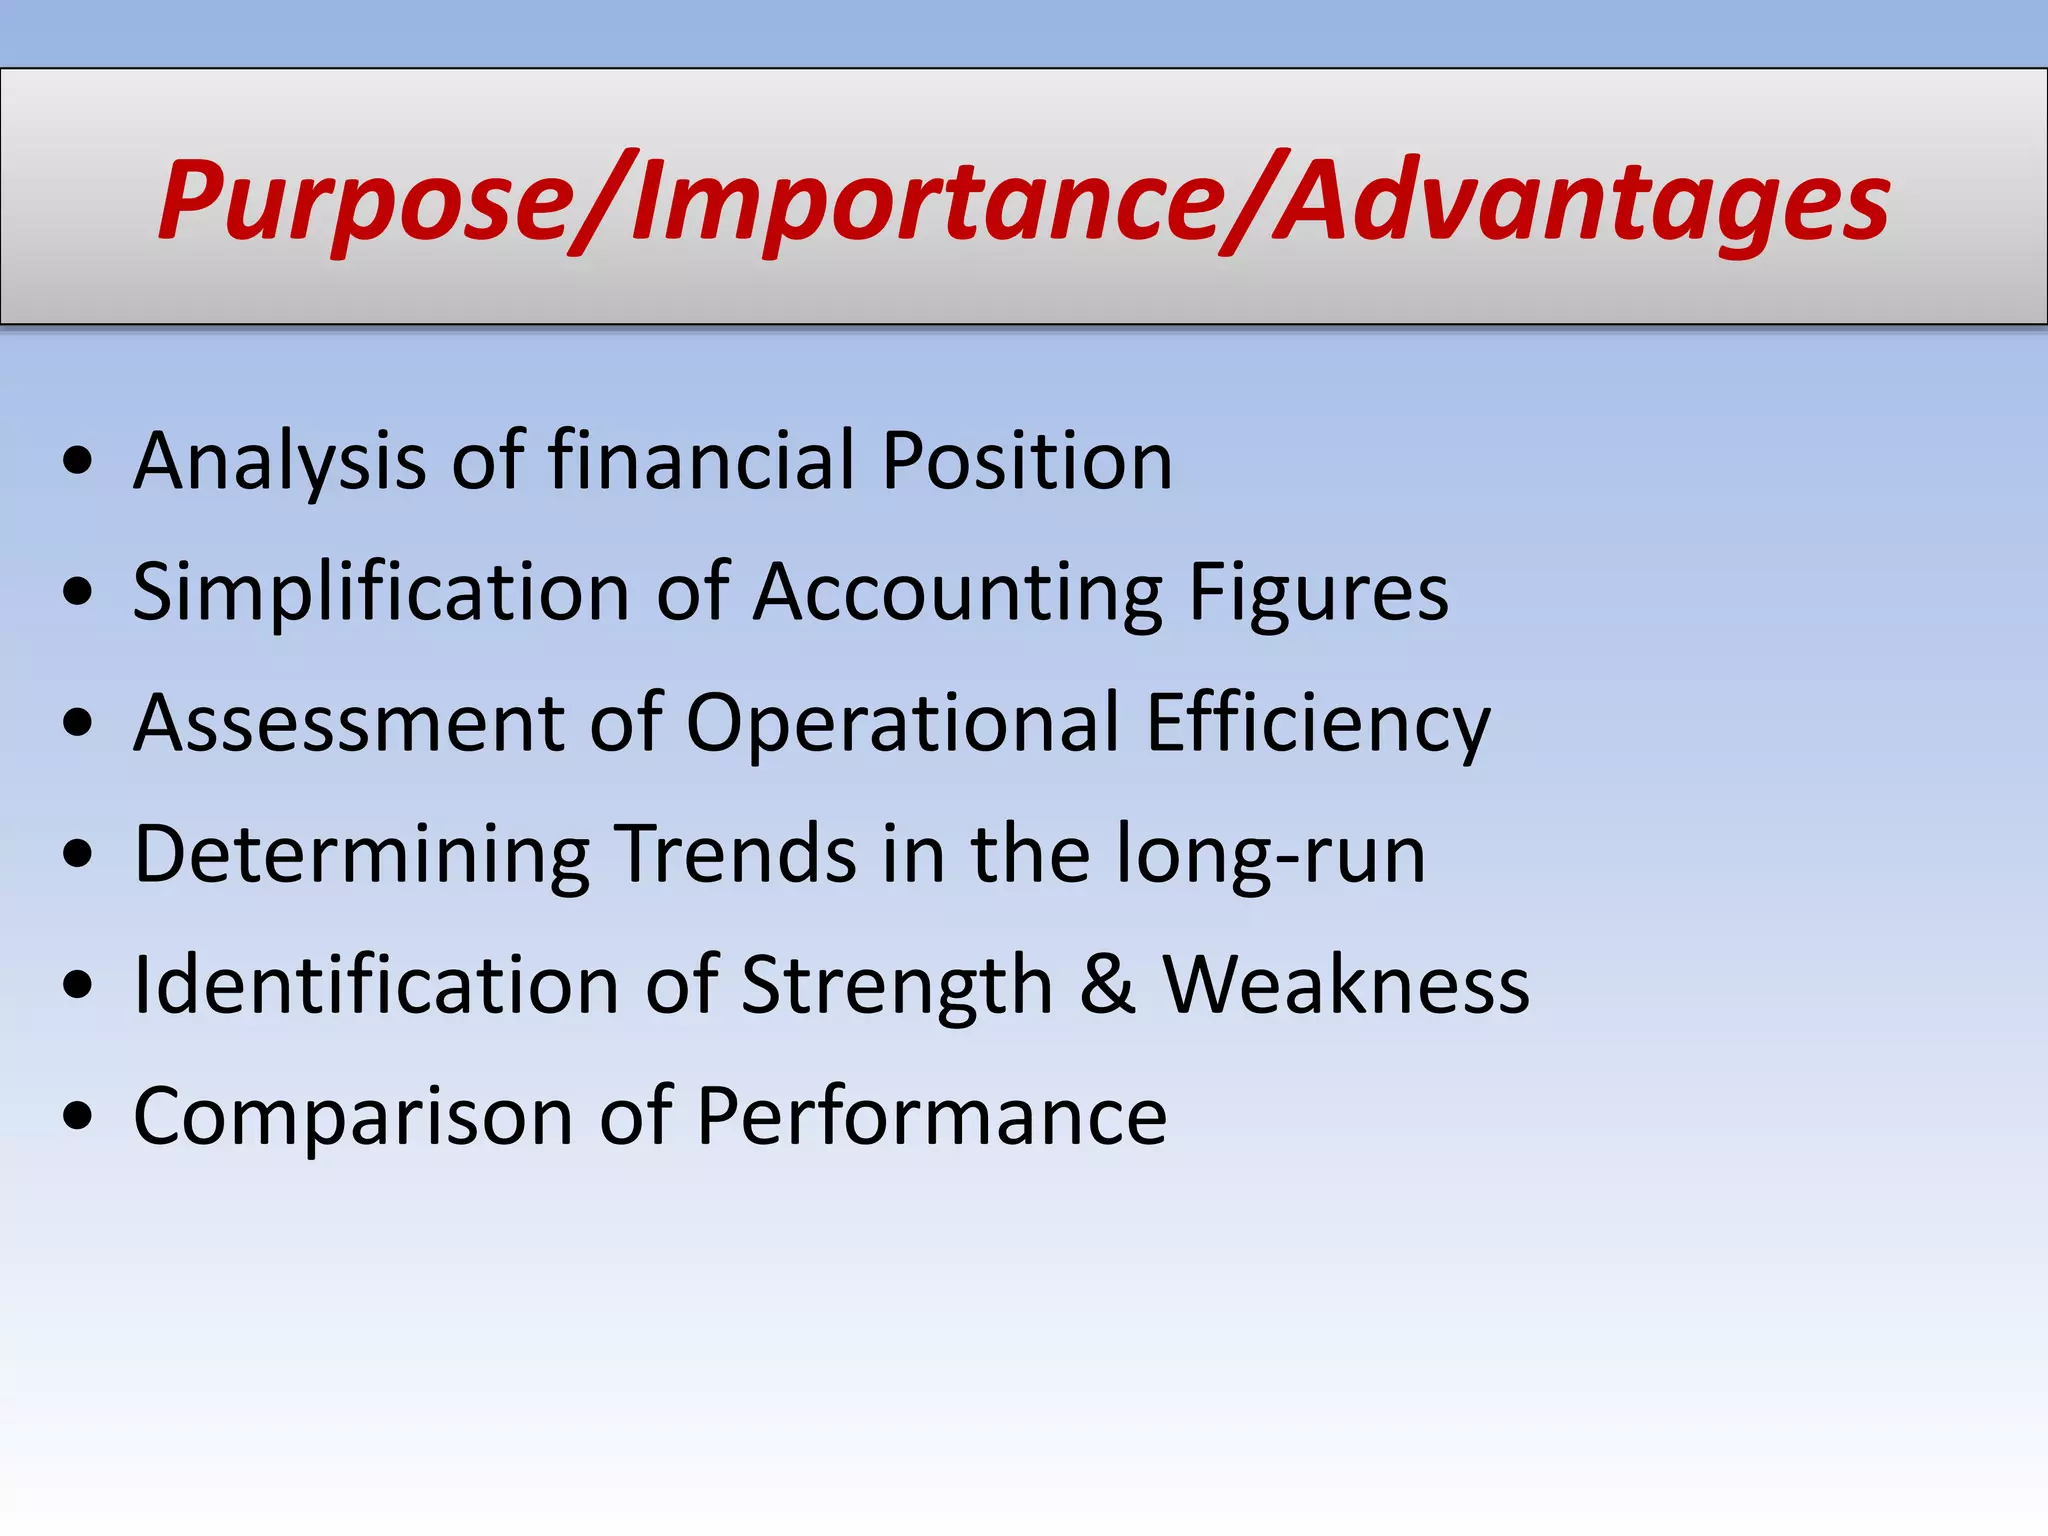
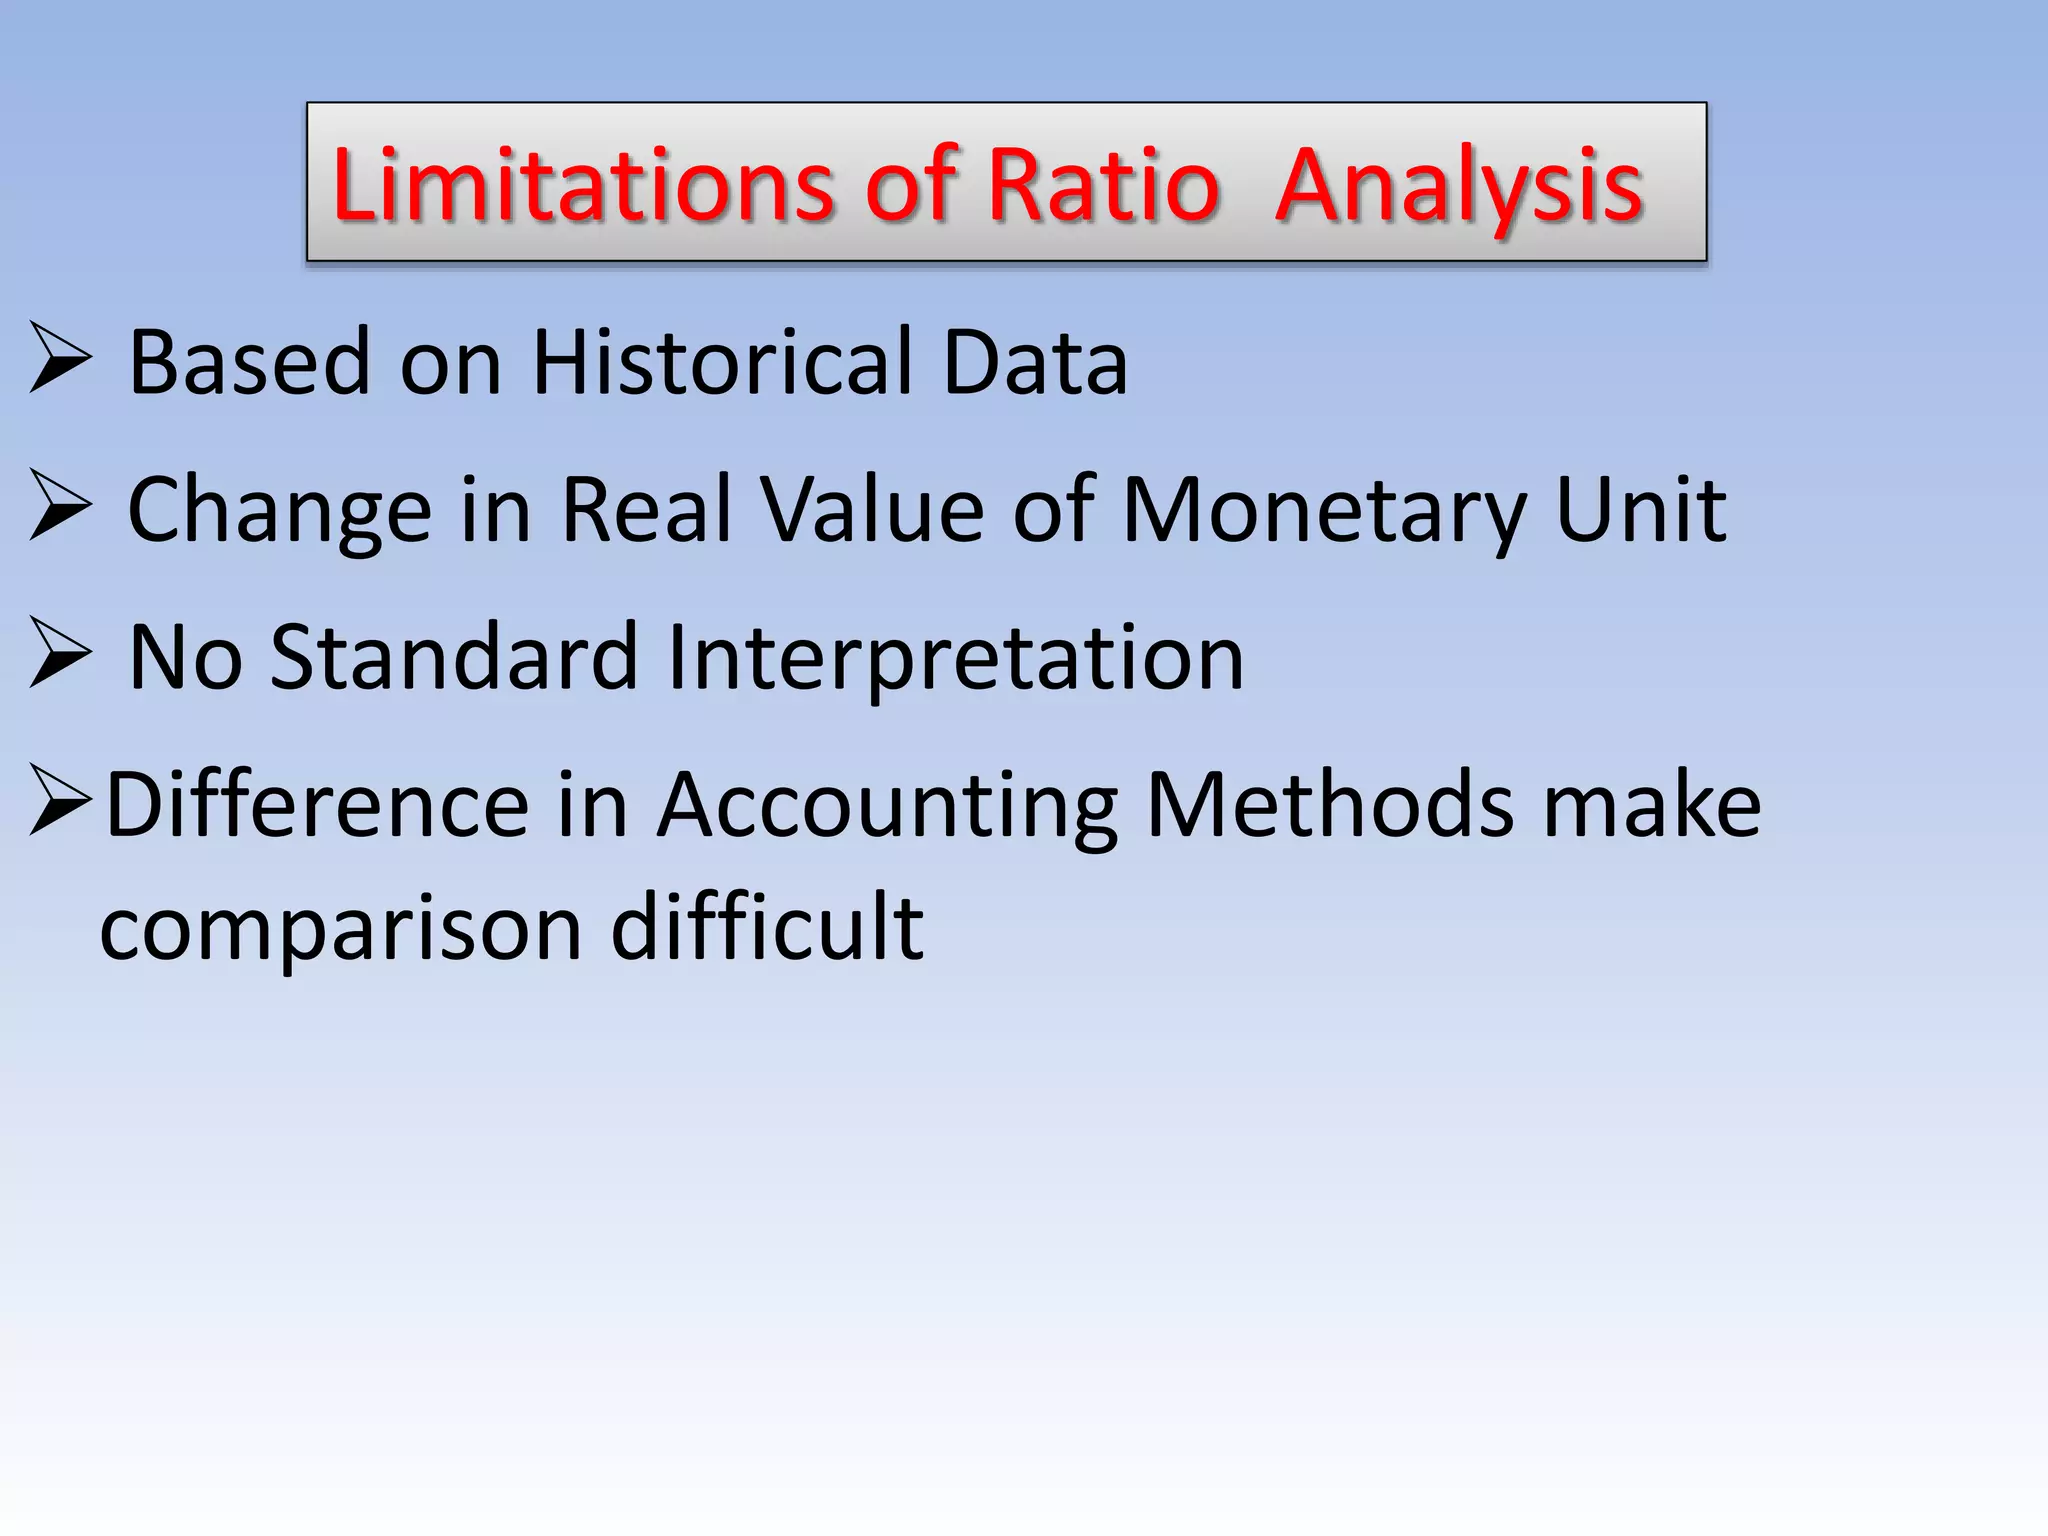
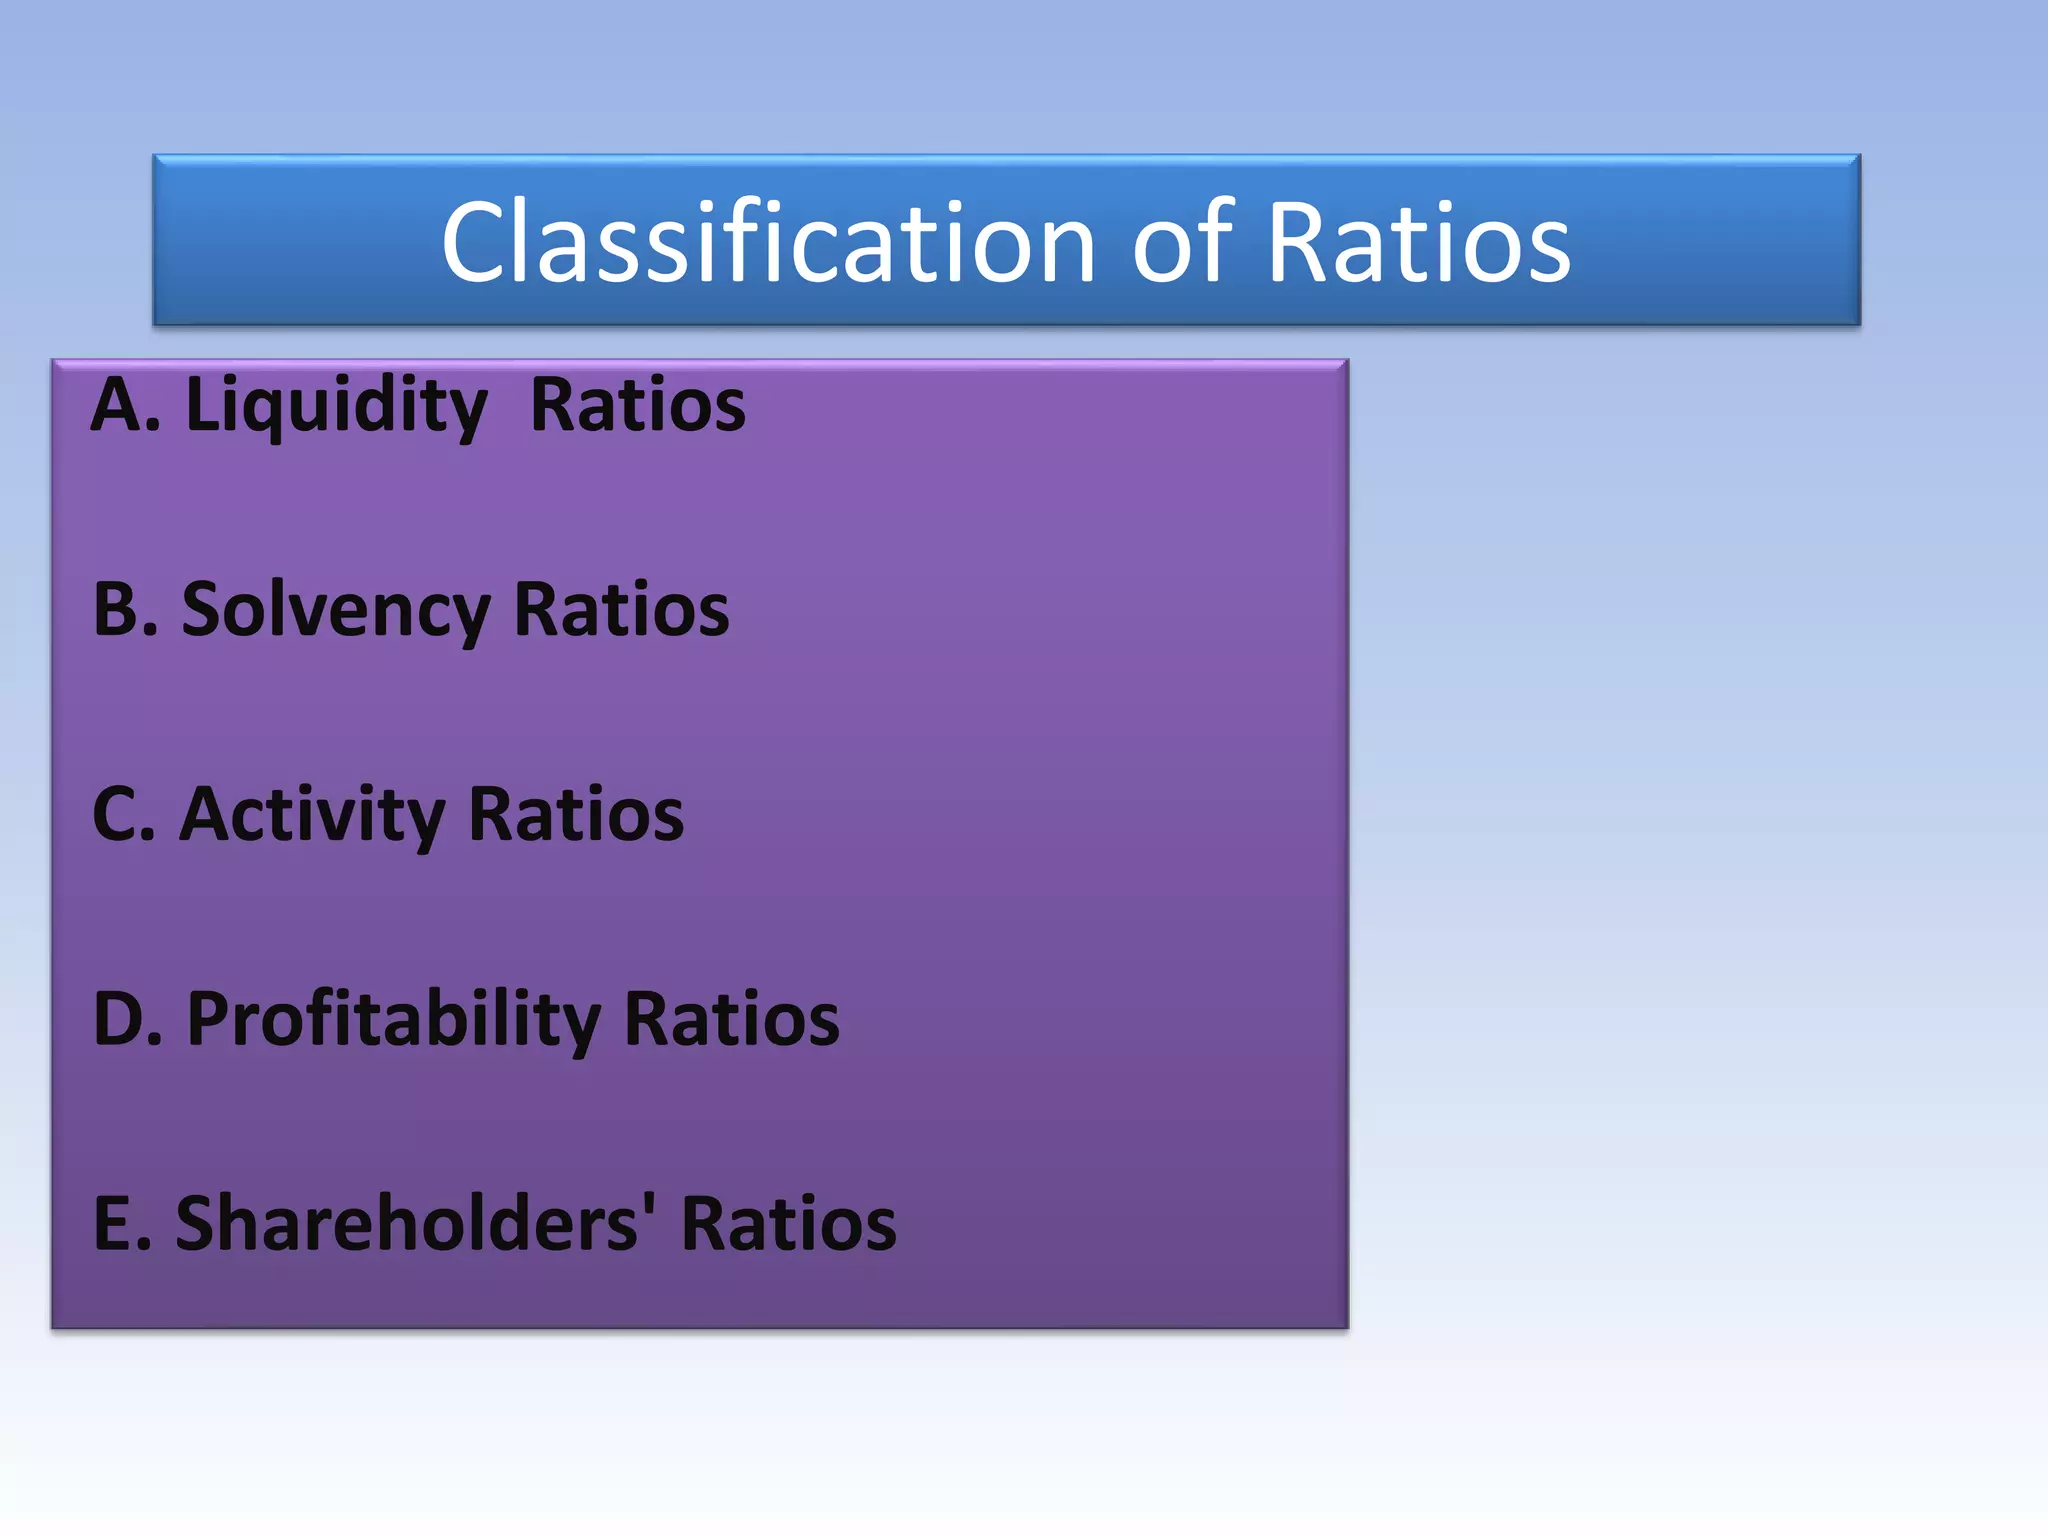
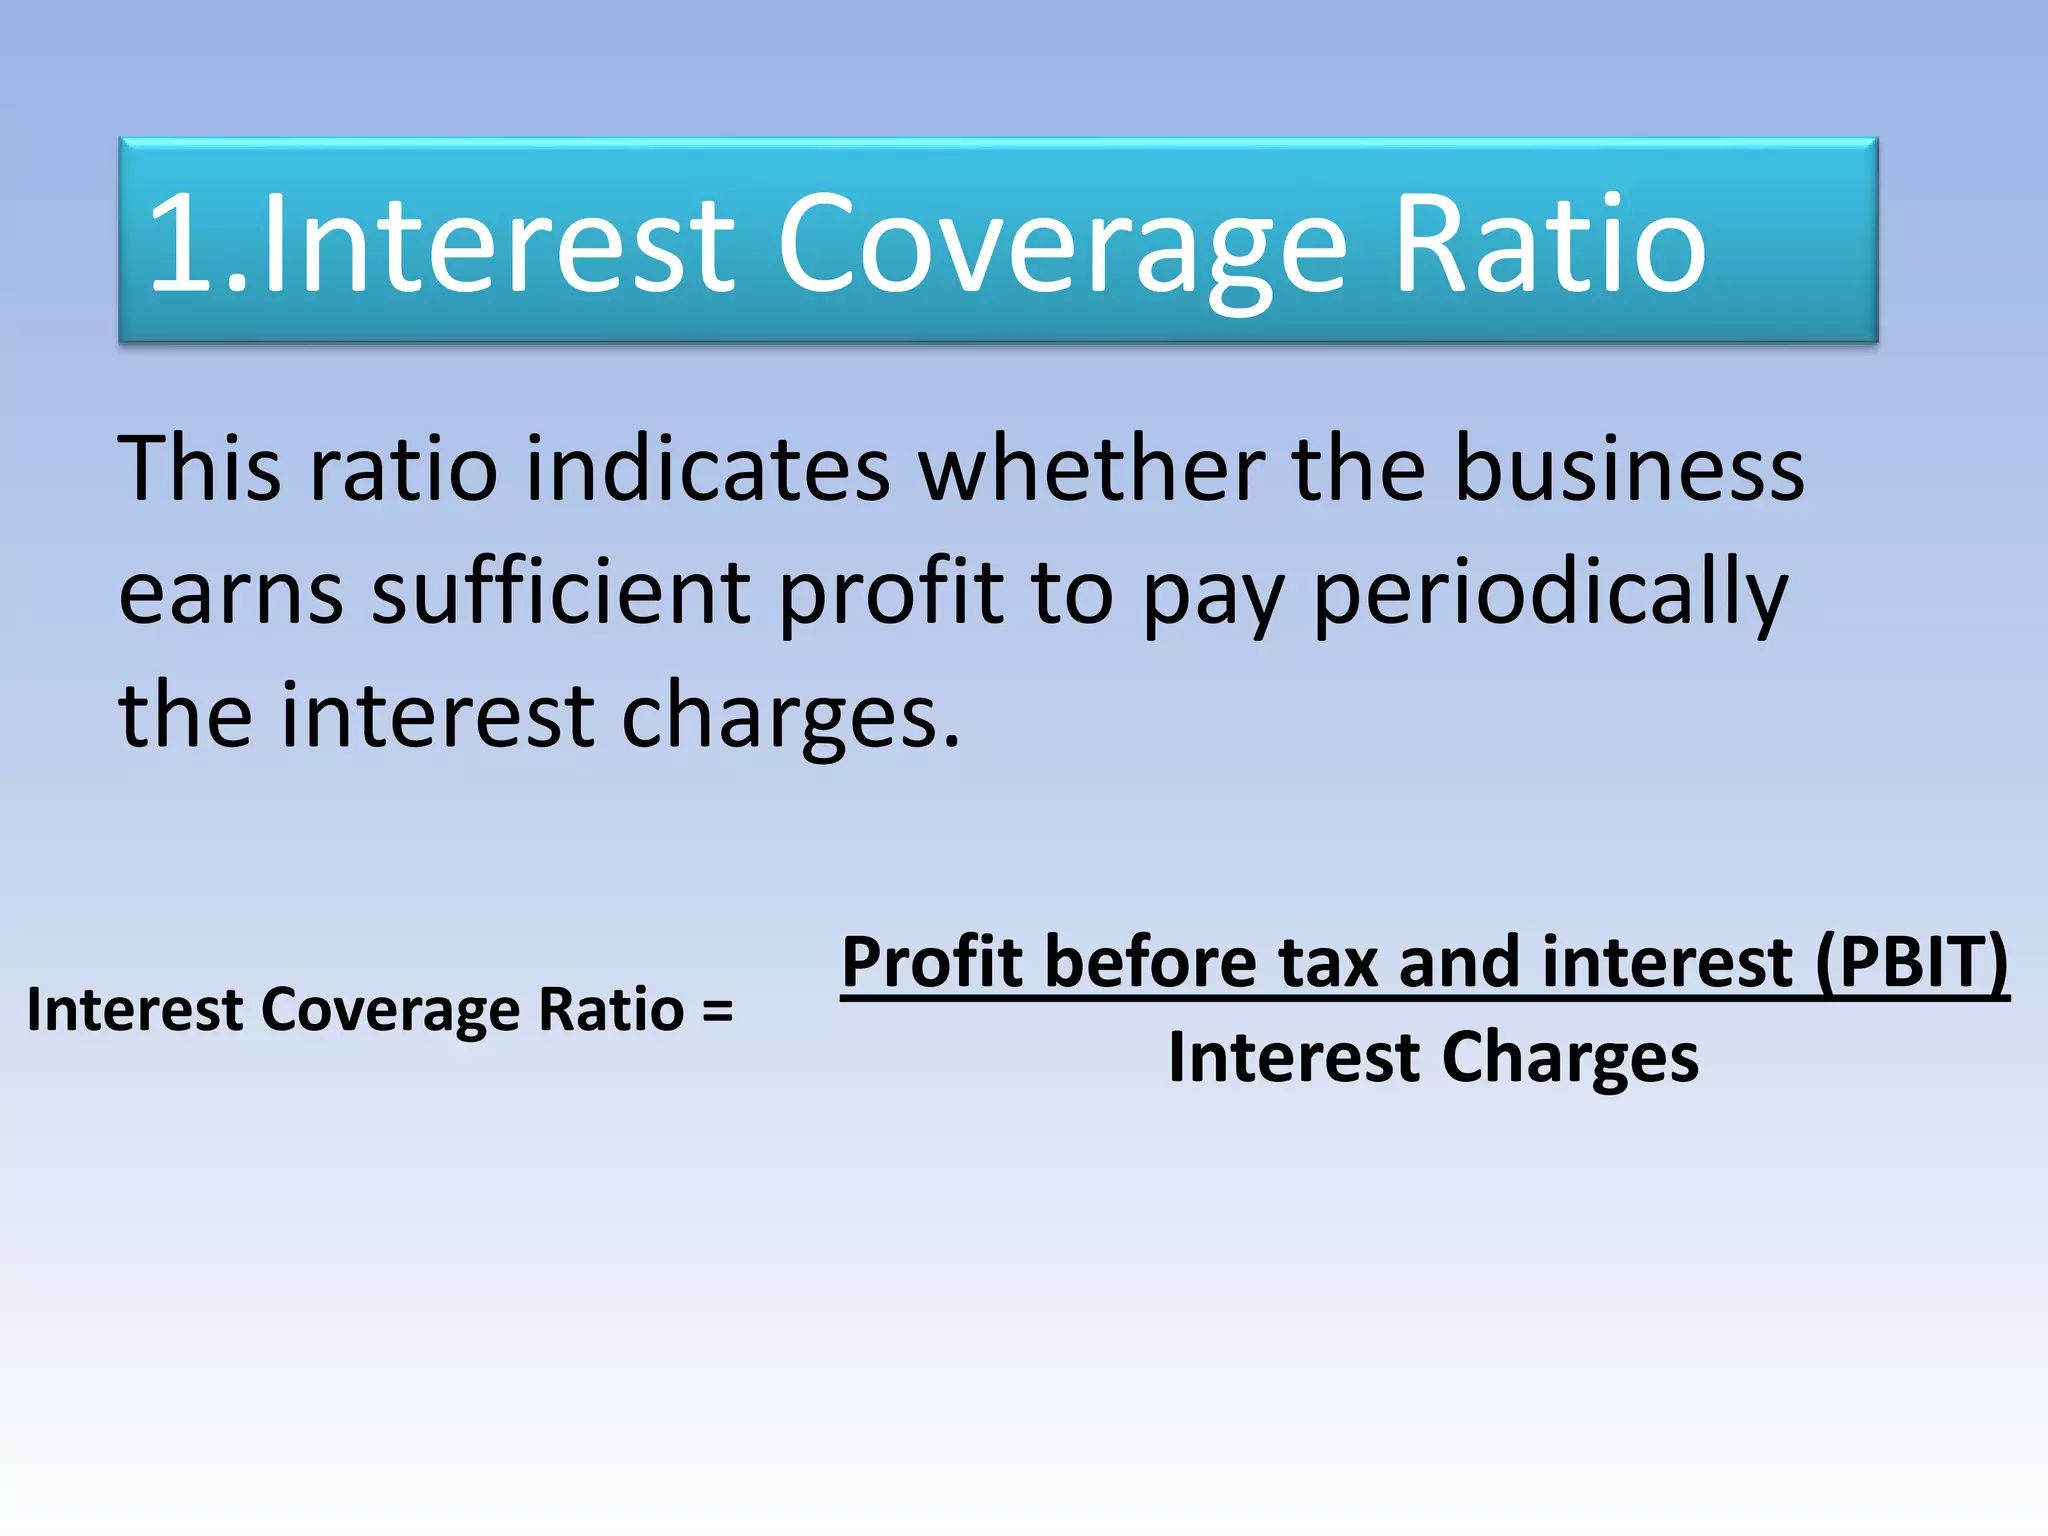
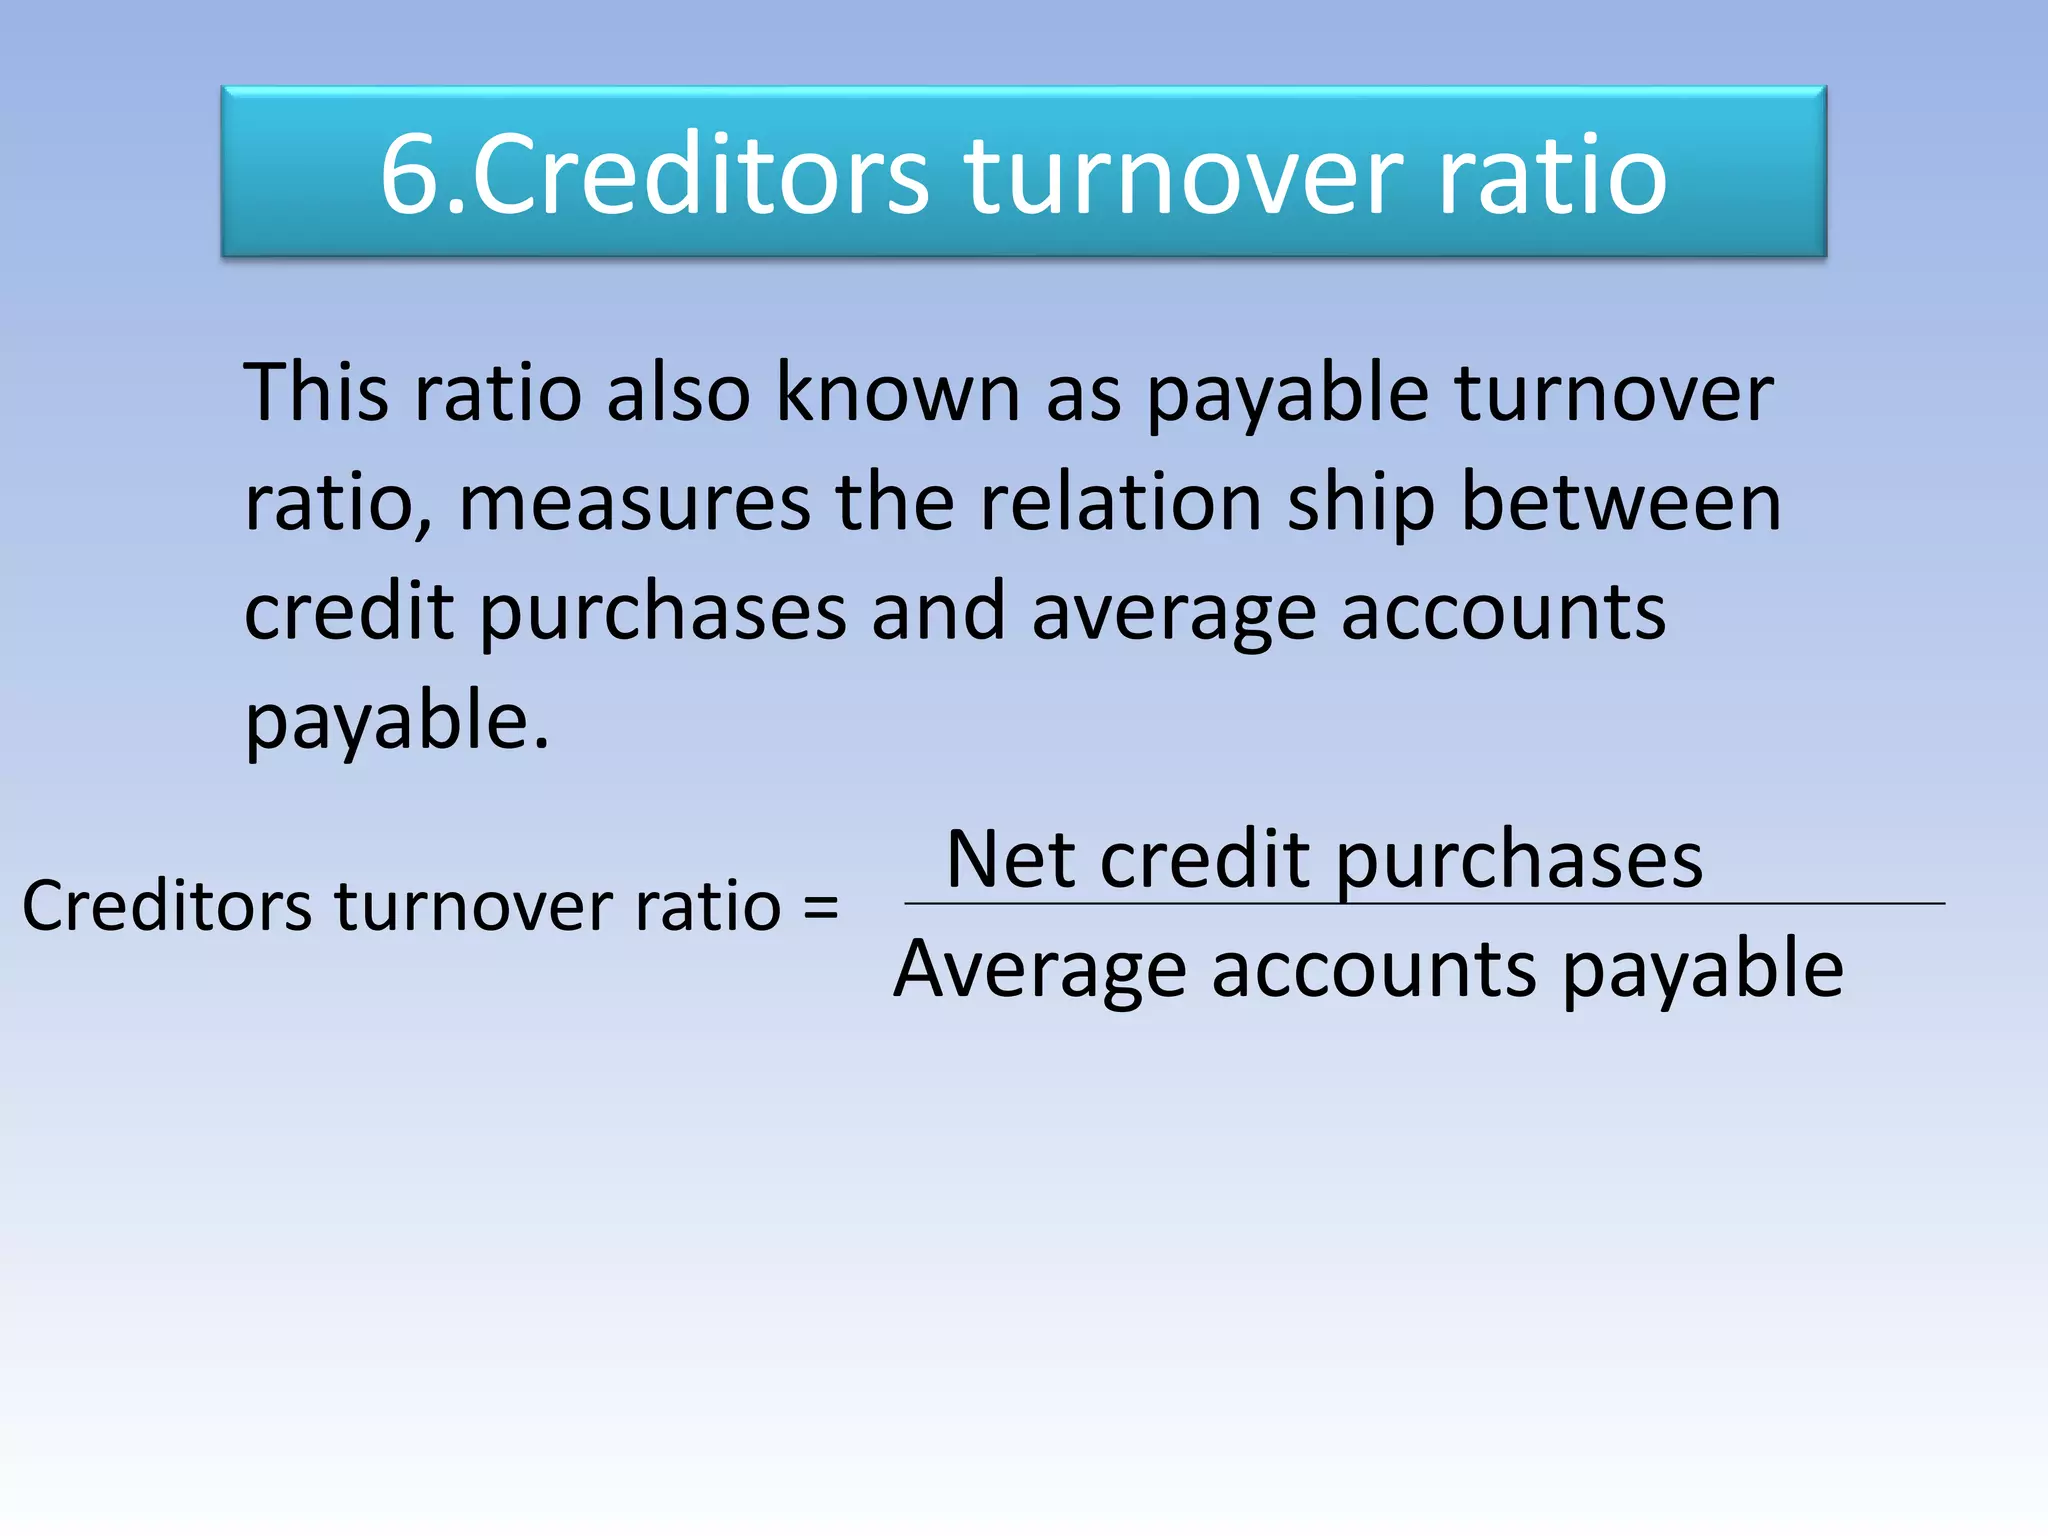
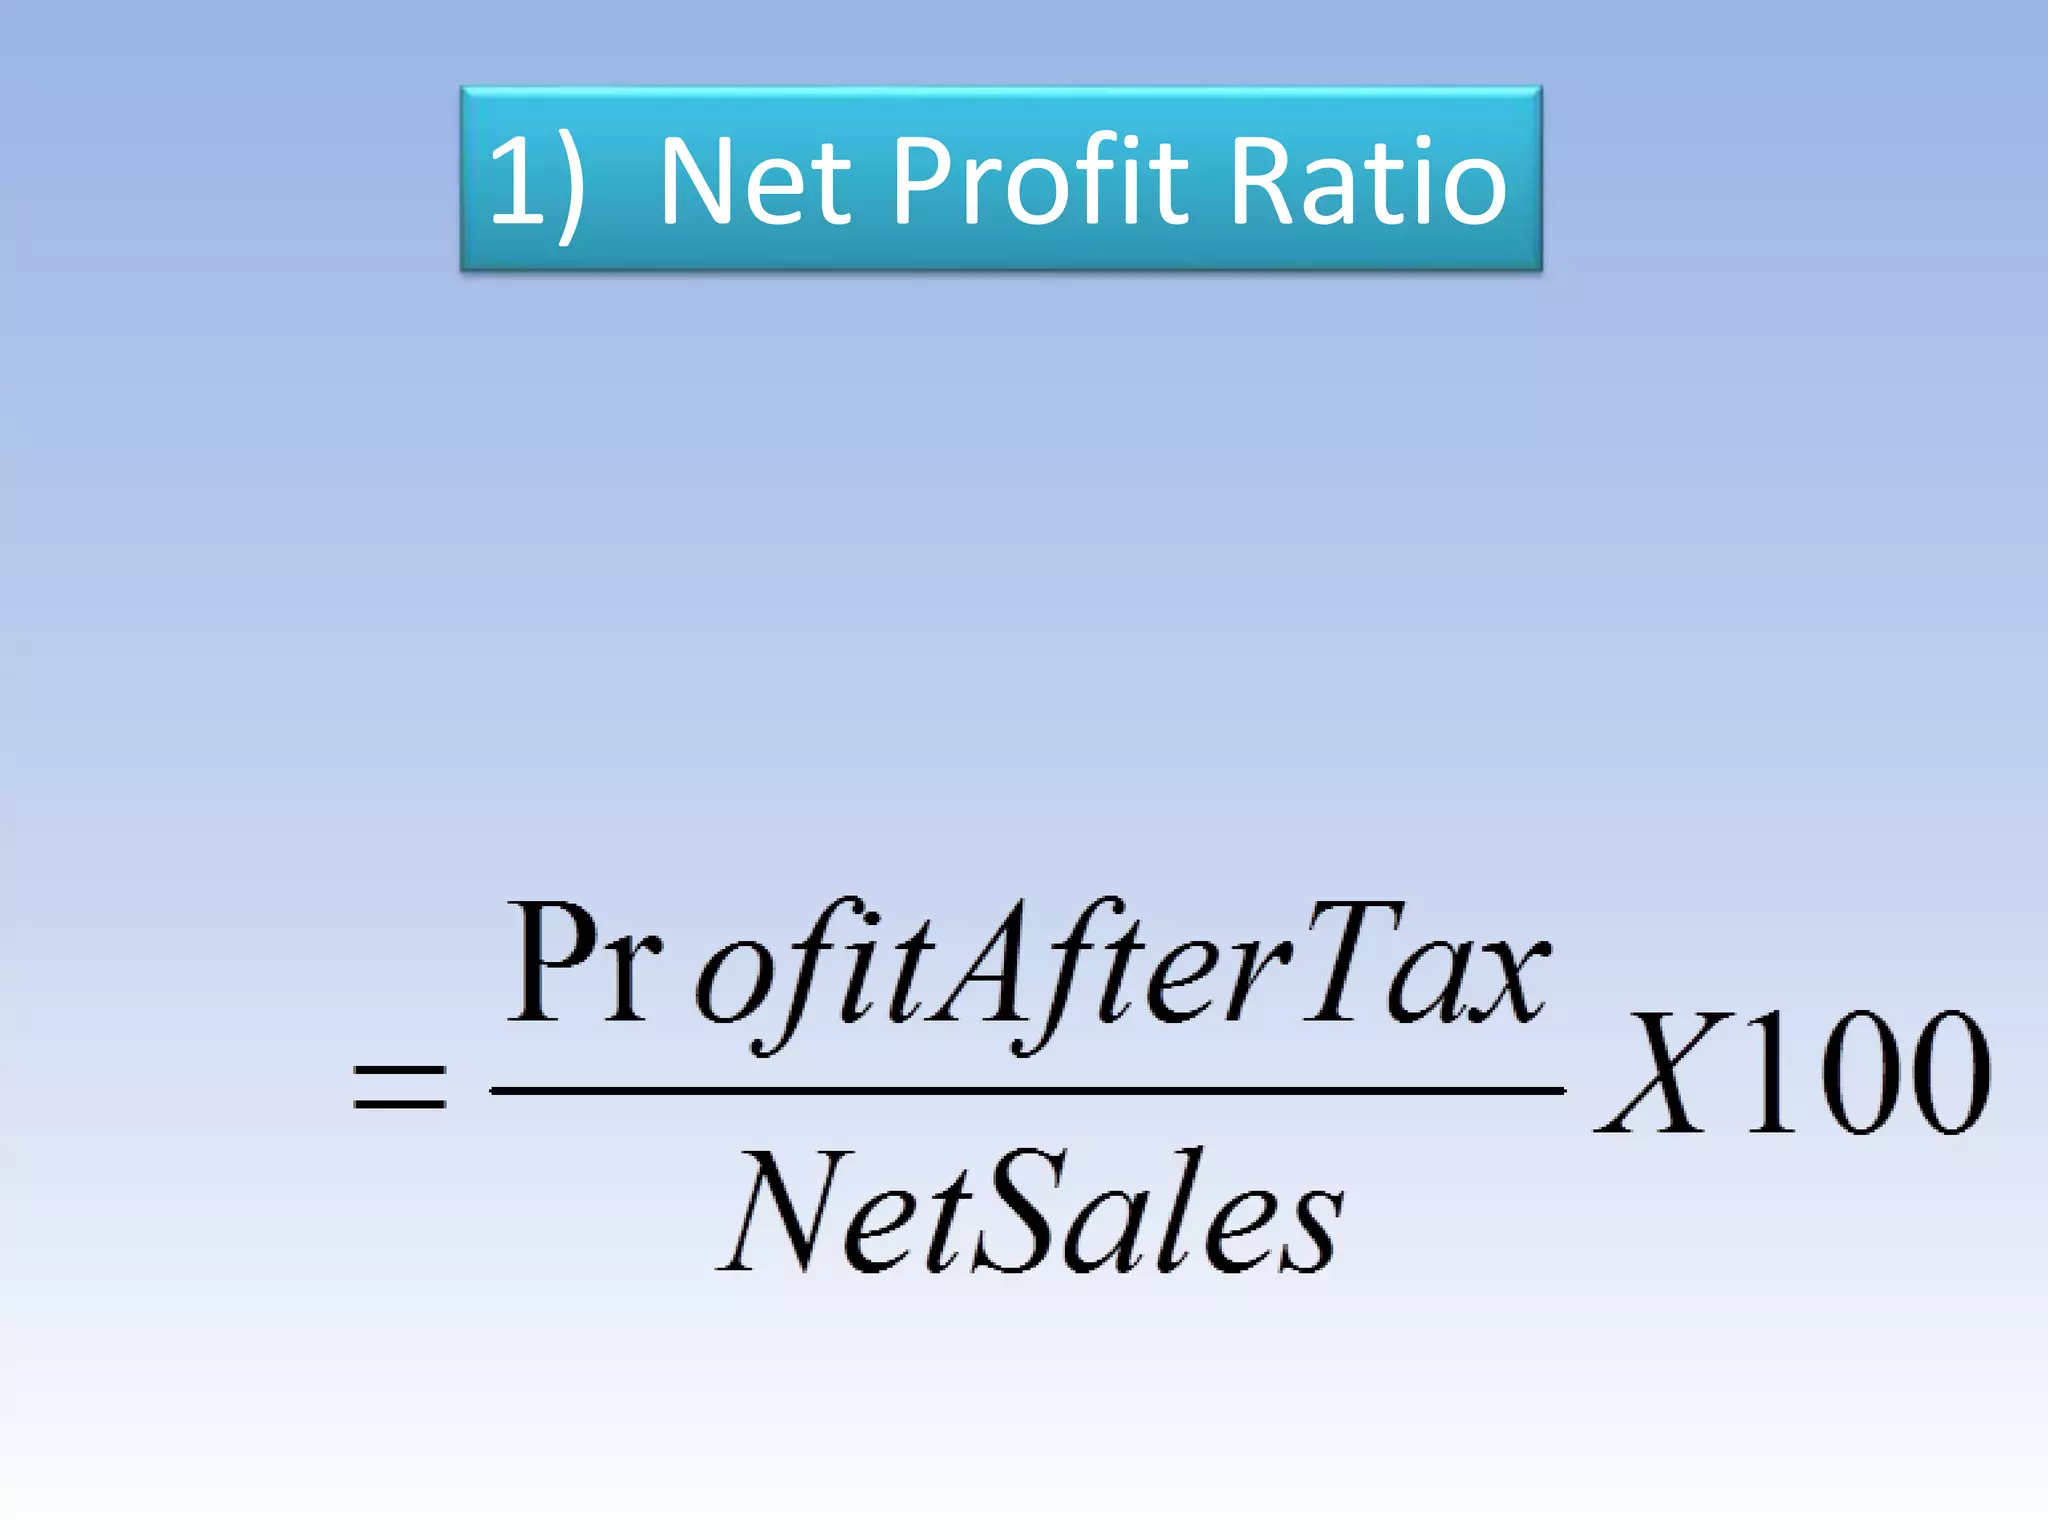
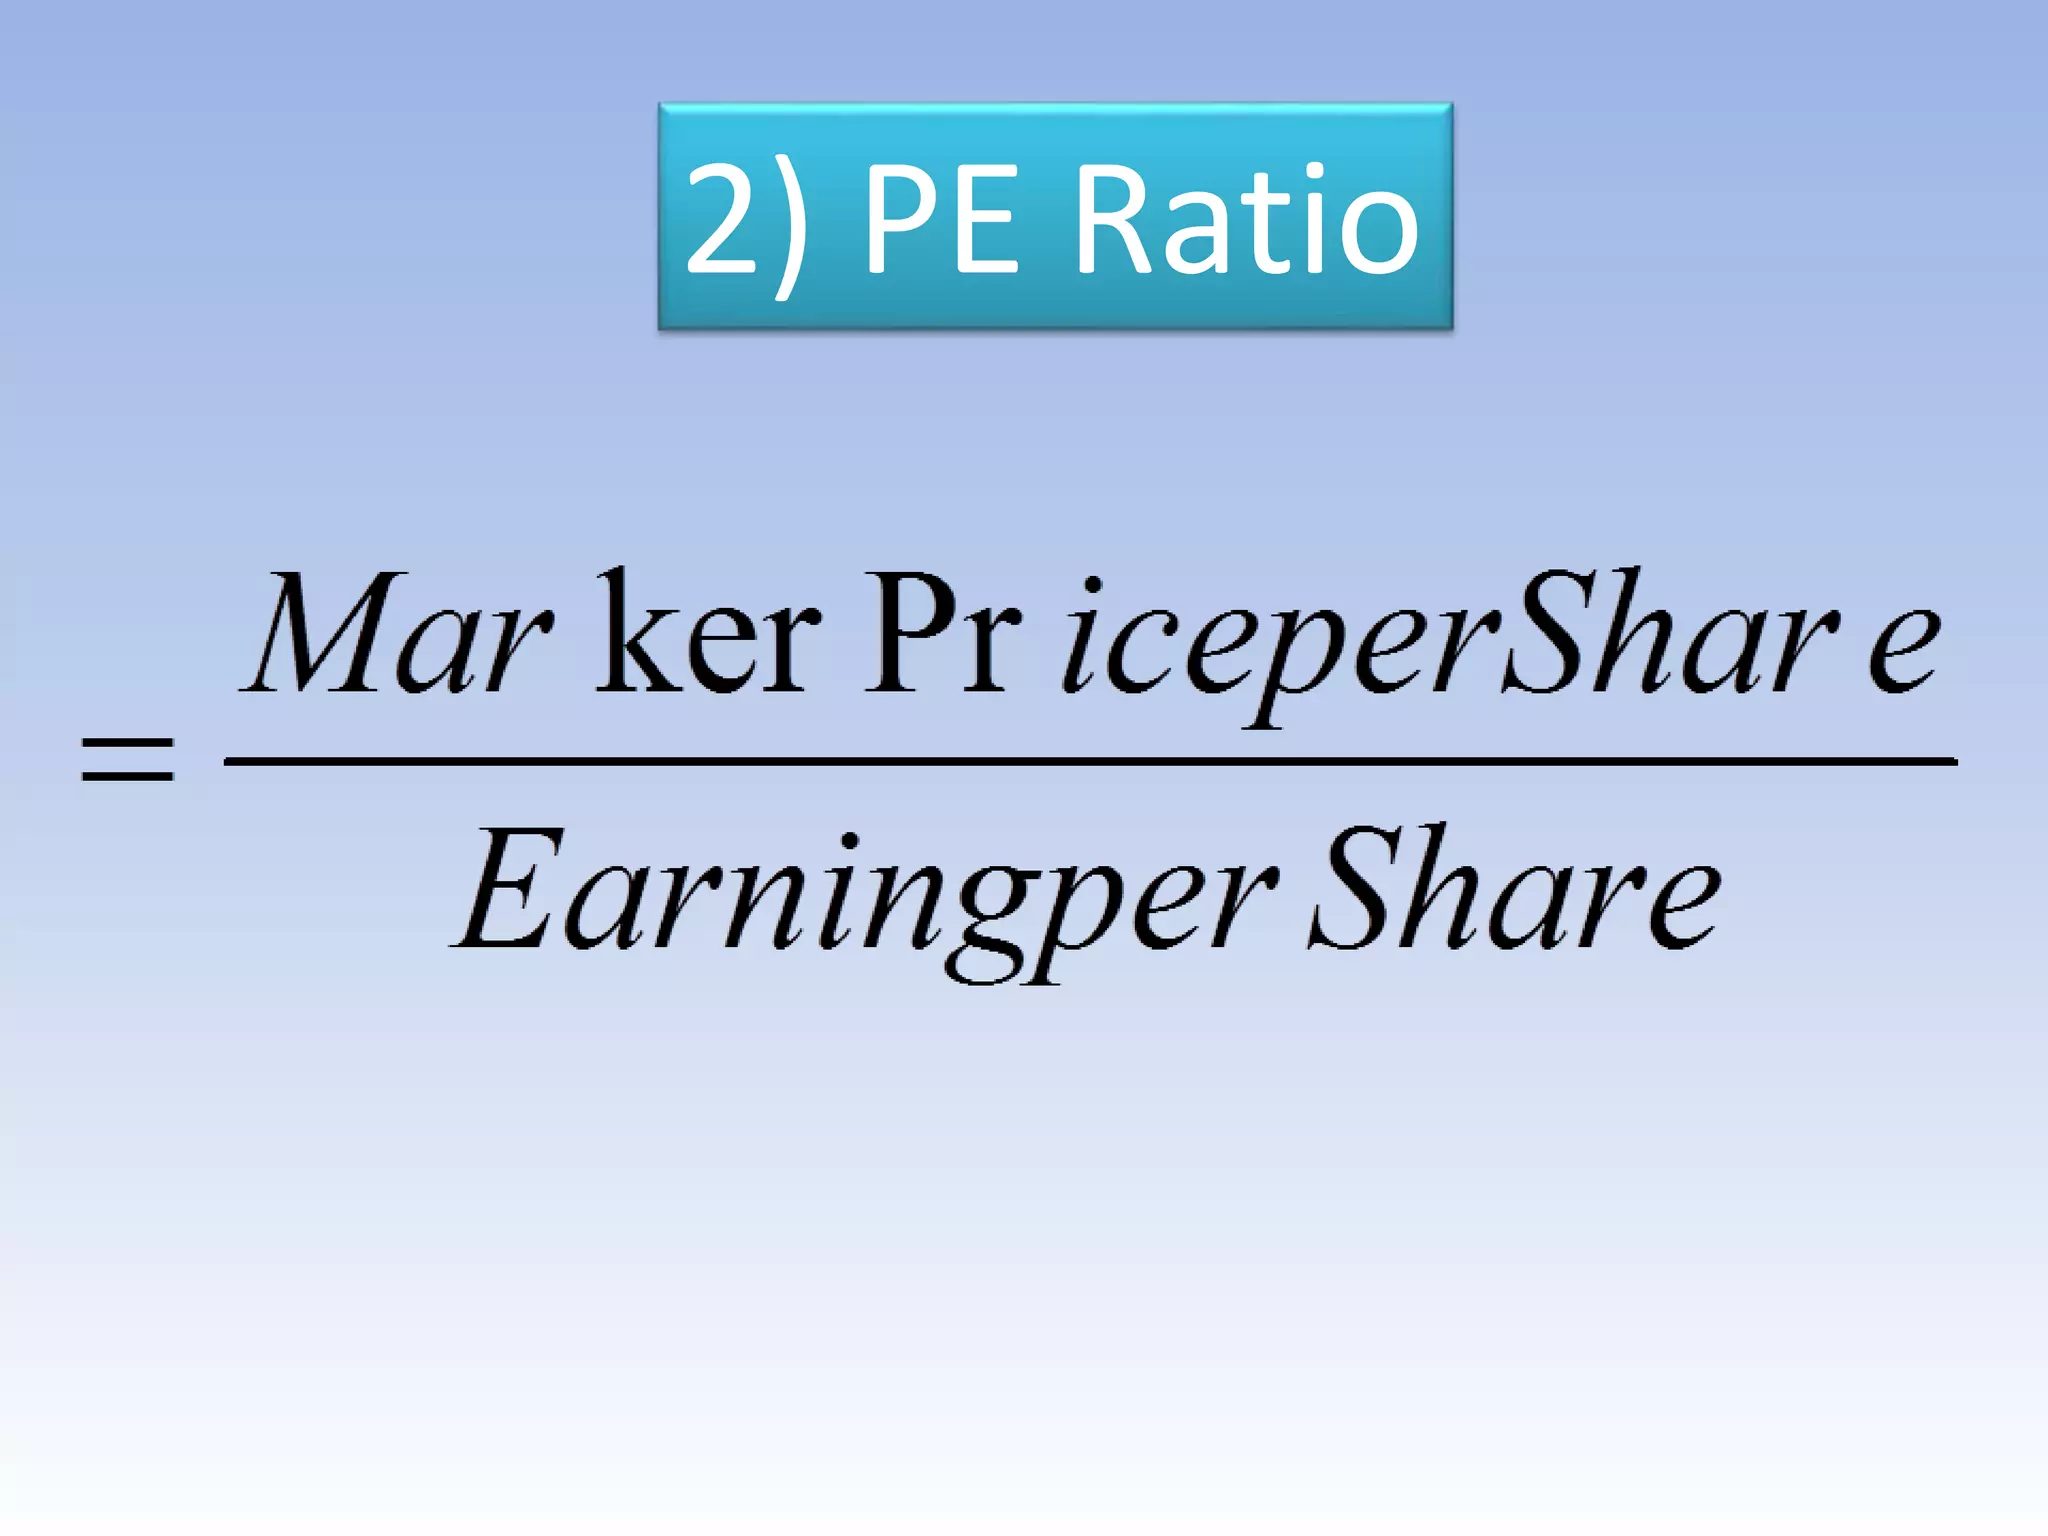
Ratio Analysis
Submitted By
Sanket Karnekar
It is an analysis of strength and
weakness of an organisation by
establishing the quantitative relation
among the items of Balance Sheet or
Income Statement of such an
organisation
Purpose/Importance/Advantages
• Analysis of financial Position
• Simplification of Accounting Figures
• Assessment of Operational Efficiency
• Determining Trends in the long-run
• Identification of Strength & Weakness
• Comparison of Performance
Limitations of Ratio Analysis
 Based on Historical Data
 Change in Real Value of Monetary Unit
 No Standard Interpretation
Difference in Accounting Methods make
comparison difficult
Classification of Ratios
A. Liquidity Ratios
B. Solvency Ratios
C. Activity Ratios
D. Profitability Ratios
E. Shareholders' Ratios
A. Liquidity Ratios
1) Current Ratio
Relation between current assets and
current liabilities
Long Term Sources Financing the
Current assets give a stable base for the
liquidity of the organisation
Normally , the ratio should not be less
than 2 i.e., the current assets should be
double the size of current liabilities
Measurement of Current Ratio
Current Ratio =
2) Acid Test Ratio/Quick Ratio
 It is the ratio between quick assets and quick
liabilities
 Quick assets include current assets except
inventory and pre-paid expenses
 Quick liabilities include current liabilities
other than bank overdraft
 A 1:1 ratio is healthy
 Healthy indicator of cash management
Measurement of Acid Test Ratio
Acid Test Ratio =
3) Working Capital Turn-over Ratio
Shows the efficiency of usage of
working capital
Relation between Sales and Working
Capital
Determination of number of times the
working capital is turned over to achieve
the maximum profit
Measurement of Working Capital Turnover Ratio
Capital Turnover Ratio
B) Solvency Ratios
Measure long-term liquidity ratio
Reflect the ability of the firm to pay interest
and repayment of loans at due dates on the
long-term loans taken
Avoidance of over-borrowing (over-leverage)
Avoidance of bankruptcy by maintaining
healthy solvency ratios
Types of Solvency Ratios
1)Interest Coverage Ratio
2)Debt-Equity Ratio
3)Debt to total funds ratio
4)Proprietary Ratio
1.Interest Coverage Ratio
Interest Coverage Ratio =
Profit before tax and interest (PBIT)
Interest Charges
This ratio indicates whether the business
earns sufficient profit to pay periodically
the interest charges.
2.Debt-Equity Ratio
This ratio attempts to measure the relationship between
long term debts and shareholders funds . its other
words , this ratio measures the relative claims of long
term creditors on the one hand and owners on the
other hand on the assets of the company .
3.Debt to total funds ratio
This ratio shows the relationship between
debts and funds employed in the business.
Debt
Total funds
Debts to Total Funds Ratio =
4.Proprietary Ratio
This is a variant of debt equity ratio. It measures the
relationship between shareholders’ funds and total
assets
C) TURNOVER/ACTIVITY RATIOS
1.Inventory turnover ratio
2.Debtors turnover ratio
3.Fixed assets turnover ratio
4.Working capital turnover ratio
5.Capital turnover ratio
6.Creditors turnover ratio
1.Inventory turnover ratio
This ratio is calculated by dividing the COGS by
average inventory.
This ratio thus establishes the relationship between
the cogs during a given period and the average of stock
carried during the period.
2.Debtors turnover ratio
The term debtors includes trade debtors and bills
receivable . doubtful debts are not deducted from
debtors. Moreover, debtors that do not arise from
regular sales should be excluded, e.g. a bill receivable
from buyer of an old plant and machine should be
exclude.
3.Fixed assets turnover ratio
This ratio indicates the efficiency with which the firm is
utilizing its investment in fixed assets such as plant and
machinery land and building etc.
4.Working capital turnover ratio
This ratio indicates the efficiency or
inefficiency in the utilization of working
capital in making sales
Sales (or cost of sales)
Net working capital
=Working capital turnover ratio
5.Capital turnover ratio
This ratio shows the relationship between cost of
sales(or sales) and the total capital employed.
cost of sales (or sales)
total capital employed
Capital turnover ratio =
6.Creditors turnover ratio
This ratio also known as payable turnover
ratio, measures the relation ship between
credit purchases and average accounts
payable.
Net credit purchases
Average accounts payable
Creditors turnover ratio =
D. Profitability Ratios
1) Net Profit Ratio
2) Gross Profit Ratio
3) Return on Total Assets
4) Return on Equity
1) Net Profit Ratio
2) Gross Profit Ratio
3) Return on Total Assets
4) Return on Equity
E) Shareholders‘ Ratio
1) Earning per Share (EPS)
2) Price-Earning Ratio (PE Ratio)
3) Dividend Yield Ratio
4) Dividend Pay-out Ratio
1) Earning per Share
2) PE Ratio
3) Dividend Yield Ratio
4) Dividend Pay-out Ratio
Ratio analysis

Ratio analysis

  • 1.
  • 2.
    It is ananalysis of strength and weakness of an organisation by establishing the quantitative relation among the items of Balance Sheet or Income Statement of such an organisation
  • 3.
    Purpose/Importance/Advantages • Analysis offinancial Position • Simplification of Accounting Figures • Assessment of Operational Efficiency • Determining Trends in the long-run • Identification of Strength & Weakness • Comparison of Performance
  • 4.
    Limitations of RatioAnalysis  Based on Historical Data  Change in Real Value of Monetary Unit  No Standard Interpretation Difference in Accounting Methods make comparison difficult
  • 5.
    Classification of Ratios A.Liquidity Ratios B. Solvency Ratios C. Activity Ratios D. Profitability Ratios E. Shareholders' Ratios
  • 6.
  • 7.
    1) Current Ratio Relationbetween current assets and current liabilities Long Term Sources Financing the Current assets give a stable base for the liquidity of the organisation Normally , the ratio should not be less than 2 i.e., the current assets should be double the size of current liabilities
  • 8.
    Measurement of CurrentRatio Current Ratio =
  • 9.
    2) Acid TestRatio/Quick Ratio  It is the ratio between quick assets and quick liabilities  Quick assets include current assets except inventory and pre-paid expenses  Quick liabilities include current liabilities other than bank overdraft  A 1:1 ratio is healthy  Healthy indicator of cash management
  • 10.
    Measurement of AcidTest Ratio Acid Test Ratio =
  • 11.
    3) Working CapitalTurn-over Ratio Shows the efficiency of usage of working capital Relation between Sales and Working Capital Determination of number of times the working capital is turned over to achieve the maximum profit
  • 12.
    Measurement of WorkingCapital Turnover Ratio Capital Turnover Ratio
  • 13.
    B) Solvency Ratios Measurelong-term liquidity ratio Reflect the ability of the firm to pay interest and repayment of loans at due dates on the long-term loans taken Avoidance of over-borrowing (over-leverage) Avoidance of bankruptcy by maintaining healthy solvency ratios
  • 14.
    Types of SolvencyRatios 1)Interest Coverage Ratio 2)Debt-Equity Ratio 3)Debt to total funds ratio 4)Proprietary Ratio
  • 15.
    1.Interest Coverage Ratio InterestCoverage Ratio = Profit before tax and interest (PBIT) Interest Charges This ratio indicates whether the business earns sufficient profit to pay periodically the interest charges.
  • 16.
    2.Debt-Equity Ratio This ratioattempts to measure the relationship between long term debts and shareholders funds . its other words , this ratio measures the relative claims of long term creditors on the one hand and owners on the other hand on the assets of the company .
  • 17.
    3.Debt to totalfunds ratio This ratio shows the relationship between debts and funds employed in the business. Debt Total funds Debts to Total Funds Ratio =
  • 18.
    4.Proprietary Ratio This isa variant of debt equity ratio. It measures the relationship between shareholders’ funds and total assets
  • 19.
    C) TURNOVER/ACTIVITY RATIOS 1.Inventoryturnover ratio 2.Debtors turnover ratio 3.Fixed assets turnover ratio 4.Working capital turnover ratio 5.Capital turnover ratio 6.Creditors turnover ratio
  • 20.
    1.Inventory turnover ratio Thisratio is calculated by dividing the COGS by average inventory. This ratio thus establishes the relationship between the cogs during a given period and the average of stock carried during the period.
  • 21.
    2.Debtors turnover ratio Theterm debtors includes trade debtors and bills receivable . doubtful debts are not deducted from debtors. Moreover, debtors that do not arise from regular sales should be excluded, e.g. a bill receivable from buyer of an old plant and machine should be exclude.
  • 22.
    3.Fixed assets turnoverratio This ratio indicates the efficiency with which the firm is utilizing its investment in fixed assets such as plant and machinery land and building etc.
  • 23.
    4.Working capital turnoverratio This ratio indicates the efficiency or inefficiency in the utilization of working capital in making sales Sales (or cost of sales) Net working capital =Working capital turnover ratio
  • 24.
    5.Capital turnover ratio Thisratio shows the relationship between cost of sales(or sales) and the total capital employed. cost of sales (or sales) total capital employed Capital turnover ratio =
  • 25.
    6.Creditors turnover ratio Thisratio also known as payable turnover ratio, measures the relation ship between credit purchases and average accounts payable. Net credit purchases Average accounts payable Creditors turnover ratio =
  • 26.
    D. Profitability Ratios 1)Net Profit Ratio 2) Gross Profit Ratio 3) Return on Total Assets 4) Return on Equity
  • 27.
  • 28.
  • 29.
    3) Return onTotal Assets
  • 30.
  • 31.
    E) Shareholders‘ Ratio 1)Earning per Share (EPS) 2) Price-Earning Ratio (PE Ratio) 3) Dividend Yield Ratio 4) Dividend Pay-out Ratio
  • 32.
  • 33.
  • 34.
  • 35.