Mean of GroupedData
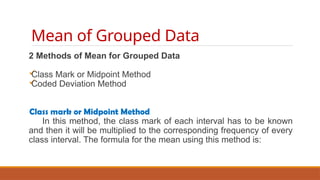
2 Methods of Mean for Grouped Data
Class Mark or Midpoint Method
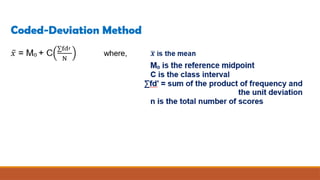
Coded Deviation Method
Class mark or Midpoint Method
In this method, the class mark of each interval has to be known
and then it will be multiplied to the corresponding frequency of every
class interval. The formula for the mean using this method is:
=
4.
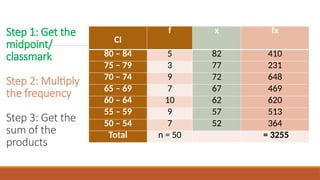
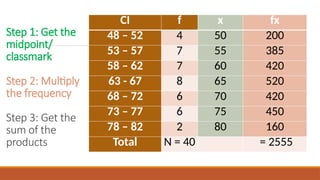
Step 1: Getthe
midpoint/
classmark
Step 2: Multiply
the frequency
Step 3: Get the
sum of the
products
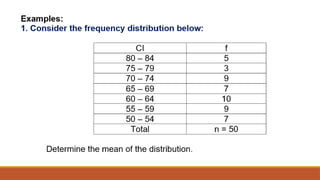
CI
f x fx
80 – 84 5 82 410
75 – 79 3 77 231
70 – 74 9 72 648
65 – 69 7 67 469
60 – 64 10 62 620
55 – 59 9 57 513
50 – 54 7 52 364
Total n = 50 = 3255
Step 1: Getthe
midpoint/
classmark
Step 2: Multiply
the frequency
Step 3: Get the
sum of the
products
CI f x fx
48 – 52 4 50 200
53 – 57 7 55 385
58 – 62 7 60 420
63 - 67 8 65 520
68 – 72 6 70 420
73 – 77 6 75 450
78 – 82 2 80 160
Total N = 40 = 2555
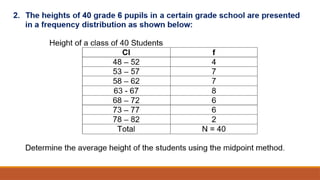
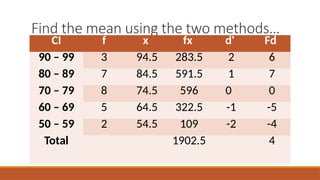
10.
Steps:
1. Solve themidpoint of the class interval
2. Find the highest frequency. It is the
reference point starting at 0, going up are
positive and going down are negative
3. Multiply the frequency and the unit-
deviation
4. Add the product of step 3
5. Find the reference midpoint and the class
interval
6. Use the formula to solve for the mean
Class
Interval
Frequency
( f )
Midpoin
t
( x )
d' fd'
90 – 94 7 92 2 14
85 – 89 13 87 1 13
80 – 84 16 82 0 0
75 – 79 8 77 -1 -8
70 – 74 6 72 -2 -12
Total n = 50 ∑fd' = 7
11.
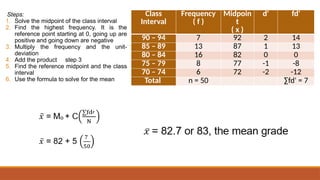
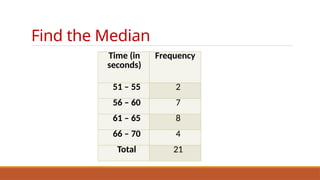
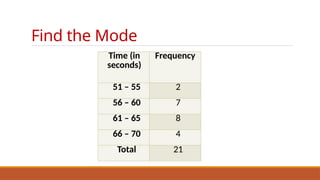
Find the Median
Time(in
seconds)
Frequency
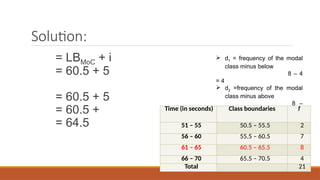
51 – 55 2
56 – 60 7
61 – 65 8
66 – 70 4
Total 21


![MEASURES-OF-CENTRAL-TENDENCIES-1[1] [Autosaved].pptx](https://cdn.slidesharecdn.com/ss_thumbnails/measures-of-central-tendencies-11autosaved-220906145428-d730d0eb-thumbnail.jpg?width=640&height=640&fit=bounds)


