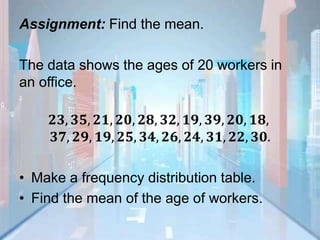
A frequency distribution table was constructed with age ranges and their frequencies for 20 workers. The mean age was calculated by summing the product of each age and its frequency, divided by the total number of workers. The mean age of the 20 workers was 26.
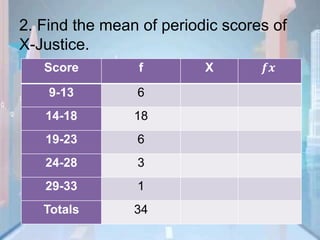
Age Range Frequency x fx
18-20 4 8 80
21-23 3 6 18
24-26 3 6 18
28-30 3 6 18
31-33 1 3 3
34-36 1 3 3
37-39 1 3 3
Total 20 143
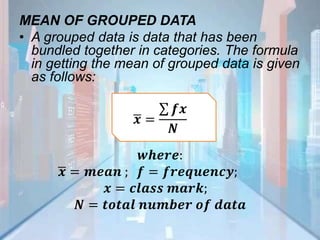
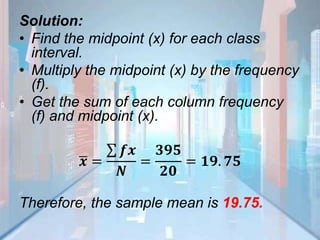
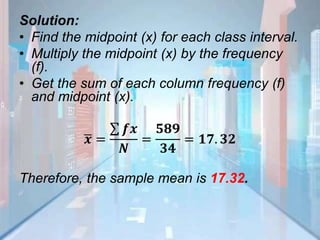
Mean = Sum(fx) / N
= 143


![MEASURES-OF-CENTRAL-TENDENCIES-1[1] [Autosaved].pptx](https://cdn.slidesharecdn.com/ss_thumbnails/measures-of-central-tendencies-11autosaved-220906145428-d730d0eb-thumbnail.jpg?width=640&height=640&fit=bounds)


