INTRODUCTION
General equilibrium analysis involve the states, where all
the markets and the decision making units in the
economy are in a simultaneous equilibrium. It studies
the simultaneous equilibrium in a group of inter related
markets emphasizing the inter dependence between
the different economics units in the economy.
ASSUMPTIONS
1. There are two factors of production labour ,L capital K are given exogenously.
2. There are two goods X and Y with the isoquants depicting the constant returns to scale
and a diminishing marginal rate of substitution.
3. There are two consumers A and B with there indifferent curves as convex to the origin
depicting a diminishing marginal rate of substitution.
4. Each firm aims at maximizing profits,given the techniques of production.
5. Each consumer aims at maximizing its utility, given his income.
6. The consumers own the factors, labour and capital and spend the whole income that they
receive as owners of the factors.there is full employment of the factors.
7. There exists perfect competition in both the factor and the goods market.
GENERAL EQUILIBRIUM OF PRODUCTION
• At this point equilibrium of the firm is where it is maximizing its profits i.e. price of goods
and factors to remain same. In case of one good the equilibrium exists where the slop of
isoquant is equal to the slop of isocost line.
MRTSLK =PL
PK
• In case of two goods general equilibrium of production exists at the point where
(MRTSLK)x =MRTSLK)y
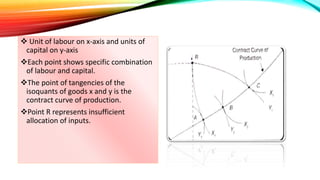
 Unit of labour on x-axis and units of
capital on y-axis
Each point shows specific combination
of labour and capital.
The point of tangencies of the
isoquants of goods x and y is the
contract curve of production.
Point R represents insufficient
allocation of inputs.
PRODUCTION POSSIBILITY FRONTIER
•Production possibilty frontier depicts the different combinations of two goods x
and y that an economy can produce by utilizing all of its resources of capital and
labour given the techniquies of production. Each point on the production possibility
frontier is an efficient allocation of the inputs.
1) Concave to the origin.
2) Slop of the production possibility frontier is called the marginal rate of
transformation.
3) It measures the amount by which an economy must decrease its output of good
y and increase a sufficient amount of the factors ,labour and capital, to increase
the output of good x by one more unit.
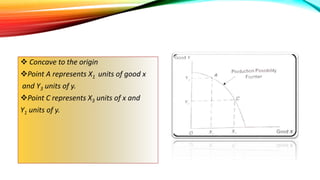
 Concave to the origin
Point A represents X1 units of good x
and Y3 units of y.
Point C represents X3 units of x and
Y1 units of y.
GENERAL EQUILIBRIUM OF
EXCHANGE(CONSUMPTION)
• A consumer achieves equilibrium when he maximizes his utility.
• A consumes is in equilibrium when he is able to reach the highest indifference curve or
where slope of indifference curve = slope of budget line. in case of one consumer:
MRSxy =PX
PY
• In case of two goods:
(MRSXY)A =(MRSXY)B
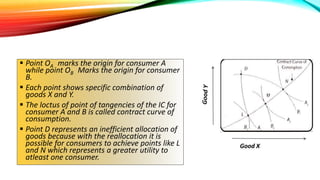
 Point OA marks the origin for consumer A
while point OB Marks the origin for consumer
B.
 Each point shows specific combination of
goods X and Y.
 The loctus of point of tangencies of the IC for
consumer A and B is called contract curve of
consumption.
 Point D represents an inefficient allocation of
goods because with the reallocation it is
possible for consumers to achieve points like L
and N which represents a greater utility to
atleast one consumer.
Good X
GENERAL EQUILIBRIUM IN
PRODUCTION AND EXCHANGE
A general equilibrium in production
exchange will exists at point M where
slope of the indifference curve = slope of
the production possibility frontier
OR
slope of the tangent to the indifference curve
A2 and B2 =slope of the tangent to the
production possibility frontier
OR
(MRSxy)A=(MRSxy)B = MRTxy
Slope of production possibility
frontier
General equilibrium ppt