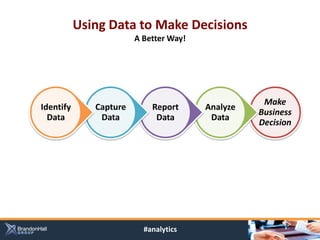
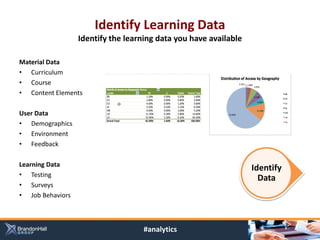
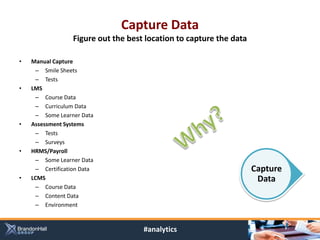
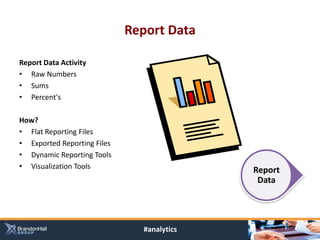
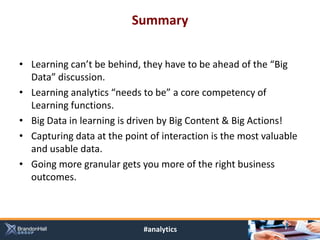
Learning Meets Big Data: Using Analytics to                 Client logo here
Create Learning that Works!

                               PRESENTED BY: Stacey Harris, VP of Research & Advisory Services
                                             Mark Hellinger, CEO
                          #analytics
About Brandon Hall Group
A preeminent research based advisory and analyst firm. Covering topic areas
that provide strategic insights for executives and practitioners that are
responsible for learning, talent, growth and business results within their
organizations. Our focus is on ensuring continuous business performance.

•   Established in 1992
•   Nearly 200,000 subscribers
•   Over 10,000 clients globally
•   Memberships and Research


         “We provide insight, objectivity, and personalized support”


                                   #analytics
About Brandon Hall Group
Research Focus:                       Client-Driven Offerings:
•   Learning and Development          •      Research Membership Program
•   Talent Management                 •      KnowledgeBases
•   Leadership Development            •      Technology Selection
•   Sales and Marketing               •      Strategy and Planning
•   Executive Management              •      Customized Benchmarking
•   Supporting Technology Systems     •      Performance Driven Organization
•   Social Media and                         Diagnostic
    Communications                    •      Vertical Market Analysis
                                      •      Workshops
                                      •      Excellence Awards
                                      •      Smartchoice™ Certification


                                #analytics
Presenters


       Stacey Harris                           Mark Hellinger
VP Research & Advisory Services                   CEO
     Brandon Hall Group                          Xyleme
      @StaceyHarrisHR                           @mhellinger


                                  #analytics
Thank You to Our Sponsors!


                         @xylemelearning


          #analytics
Participation is Encouraged!
                        How to Ask Questions and Make Comments


        During Session
  Type your questions into the
         question box
Afterward

For more information, please contact us at:                Type in your question here
Email: success@brandonhall.com
Website: www.brandonhall.com
Phone: (561) 306-3576


            All attendees will receive the slides after the webinar
                                              #analytics
Agenda
  Learning Meets Big Data: Using Analytics to Create Learning that Works!

 Why today’s view of learning analytics isn’t working
 Effective approaches to designing, developing, and measuring consumer
  driven learning
 Learning as a business tool: What Good Analytics can do for you
 How to use analytics and social content to drive continuous improvement
  of learning content
 Examples: Learning Functions that focus on Performance Outcomes


                                 #analytics
Poll Question One

Have you heard of Big Data Analytics?
1. Yes, and I get its impact on learning.
2. Yes, but I don’t fully comprehend it.
3. No, haven’t really heard of it till now.


    If you’ve selected other please place the challenge in the
                            Q&A box.


                              #analytics
What is Big Data?
           How big data is gathered – and where the market is changing?


A collection of data sets so large and complex that it is difficult to process or analyze using traditional
database management tools. It has a characteristics that need to be managed such as:
• Volume: A constantly growing amount of data
• Velocity: The data moves and transforms at high speeds
• Variety: The data is differentiated, with multiple types of data
• Veracity: The data has high levels of trustworthiness, from how it is gathered to managed
• Variability: The consistency and dependability of the data (how often it can be collected)
• Complexity: You can connect and correlated relationships, hierarchies, and multiple data linkages

The challenges often include capture, curation, storage, search, sharing, analysis, and visualization.
• Granular and event driven

       2.5 quintillion bytes of data are created every day – 90% of all data in the world has
                                been created in the last 2 years alone.


                                               #analytics
Why Has Big Data Become Relevant?

 Advances in Technologies
 • Cheaper storage, faster processing speed, new processing technologies (parallel, clustering,
    virtualization), high connectivity and high throughputs, analytics tools with visualization.

 Advances in Consumer Trust
 • We are more comfortable sharing, tracking, and having our actions tracked than ever before.

 Advances in Consumer Expectations
 • We expect our worlds to be personalized and tailored.


“The goal of all organizations with access to large data collections should be to harness the most
                     relevant data and use it for optimized decision making.”


                                            #analytics
Poll Question Two

What reports are pulled most often from your current learning
platforms?
1. Lists of Who Completed “X” Course
2. Lists of Who Registered for “X” Course
3. Lists of Who Attended a “Session”
4. Testing or Survey Scores
5. Other

  If you’ve selected other please place the answer in the Q&A
                               box.


                           #analytics
Top Ways to Gage Effective Learning Today
  60.0%   54.4% 52.8%
  50.0%                 46.6%

  40.0%

  30.0%
                                20.1% 19.6%
  20.0%                                       15.7% 13.9%
                                                            11.2% 10.1% 9.2%
                                                                             8.7% 7.5% 7.2%
  10.0%

   0.0%


                                                            BHG, Relationship Centered Learning N=601, 2012


                                      #analytics
Do We Think Our Learning is Effective?
    Networking/Events                          64.5%                          27.9%            8.5%
     Classroom Training                    56.8%                            40.1%              3.1%
        Social Learning                  52.3%                      25.0%             20.9%
Media Based/E-Learning                   52.3%                             42.9%               4.8%
  Performance Support                   49.5%                            40.3%             10.3%
  Game-Based Learning                  44.4%                  25.0%                30.7%
     Blended Programs              35.6%                          54.0%                    9.8%
   Coaching Mentoring           26.7%                             69.3%                        4.0%
        Job Assignment        20.1%                            75.6%                           4.2%

                      0.0%            20.0%        40.0%         60.0%           80.0%         100.0%     120.0%

                          Not Effective/Somewhat       Effective/Very Effective          N/A


      46.6% of Companies said that Media Based Learning accounted for more than 50% of
                                 their development programs

                                                              BHG, Employee Development and Performance N=400, 2012


                                                 #analytics
Bad Reporting Leads to Bad Decisions

          Poor Report          Equals                 Poor Decision

Decline in attendance                       Get rid of course

Poor passing scores                         Make the certification test easier

Increase in course requests                 Run more courses and make them
                                            cheaper to deliver

High “smile” sheet scores                   Higher course investments


Decline in on-line course                   Cut the online course
completions
Lack of social learning tool                Cut the social learning tool
usage

                               #analytics
Using Data to Make Decisions
                             How we often do it today


                                                          Make a
                Asked a                Pull a
                                                          Business
                Question              Report
                                                          Decision


How much are we spending on Learning?                      Is Learning Effective?
    Has someone completed their compliance training?

                                                 Is someone trained in this skill?
   Who went to this class?
                    How many people completed this course?


                                    #analytics
What is Learning Analytics

Learning Analytics is the analysis of connections and insights that can be gathered
from comparing learning, people, and business data; for the purpose of making better
business decisions.


            Course Completions
              Valued Content                                Business Decisions
          Financial Improvements
            Engagement Scores


         Learning Data
          People Data              Analysis/Insights      Business Outcomes
         Business Data

                                        #analytics
Using Data to Make Decisions
                        A Better Way!


                                                   Make
Identify      Capture       Report      Analyze
                                                  Business
  Data         Data          Data        Data
                                                  Decision


                          #analytics
Identify Learning Data
                  Identify the learning data you have available

Material Data
• Curriculum
• Course
• Content Elements

User Data
• Demographics
• Environment
• Feedback

Learning Data
                                                                  Identify
• Testing
                                                                    Data
• Surveys
• Job Behaviors


                                    #analytics
Capture Data
                  Figure out the best location to capture the data

•   Manual Capture
     – Smile Sheets
     – Tests
•   LMS
     – Course Data
     – Curriculum Data
     – Some Learner Data
•   Assessment Systems
     – Tests
     – Surveys
•   HRMS/Payroll
     – Some Learner Data
     – Certification Data                                            Capture
•   LCMS                                                              Data
     – Course Data
     – Content Data
     – Environment


                                     #analytics
Report Data

Report Data Activity
• Raw Numbers
• Sums
• Percent's

How?
• Flat Reporting Files
• Exported Reporting Files
• Dynamic Reporting Tools
• Visualization Tools                       Report
                                             Data


                               #analytics
Analyze and add Insights

Effectiveness
•    Correlation Coefficients
•    Standard Deviations
•    Reliability Testing
•    Probability Testing

Efficiency
•     Percent Differences
•     Mean Differences
•     Multiple Distributions
•     Ranges/Variances

Impact                                                    Analyze
•   ANOVA’s                                                Data
•   Regression Models
•   t-tests
•   Chi-Squares


                                        #analytics
Making Good Business Decisions

            Operational Data +
              Learning Data +
(Statistic/Algorithm/Pattern Matching) +
               Expert insights
                      =
         Better Business Decisions

                                     Make
      Actionable Changes            Business
                                    Decision


                #analytics
Retail Service Workers

 Performance support portal: delivers personalized information to 3,000 stores
    o Store profile: Services offered, equipment used
    o Guides, procedures, and equipment matched to store profile so that only relevant info is
      delivered.
 Analytics: delivers data back to content creators on the effectiveness of that
  information
    o Relevance:
        o Correlation between page access and time on (e.g. high access : high duration)
    o Gaps
        o Highest ranking terms and bounce rates (e.g. high bounces = gaps)
    o Reach:
        o Comparison of devices by geography and frequency of use (i.e. who is
           underserved?)


                                        #analytics
Relevance


  #analytics
Gaps


#analytics
Reach


#analytics
Poll Question Three

How do you currently decide to update content for learners?
1. When they complain
2. Once a year we update, based on assumed needs
3. Based on regular feedback and social comment
4. Based on course effectiveness measures
5. Other


  If you’ve selected other please place the answer in the Q&A
                               box.


                           #analytics
Learning Analytics at the Content Level

                  Learning analytics provides insight into the data.
Data you can capture, without user input:
• Geography
• Device and platform
• Point of entry
• Search terms used
• Time spent with content and bounce rates
• Point of exit
• User information, group affiliations, geography

As a content developer, do you think you would do things differently if you knew how
people were actually using the content you create? Data collection systems track a
user's path through the content and along the way collects actionable information.


                                      #analytics
How Do you Buy A Car?

How do you buy a car?

              Brand > Features > Look and Style


                          #analytics
How Are Cars Updated?
                 Mustang Cars, Continuous Improv
1st Generation        2nd Generation       4th Generation    5th Generation


          How does the manufacture decide what to keep and
          what to change on each model of a car?

                    Data > Analysis > Business Decision


                                  #analytics
Online University

 For profit university: delivery of virtual courses
     o Hundreds of courses delivered globally to thousands of students
 Analytics: student activity provides information on course content design
     o Validation of assumptions:
          o Correlation between estimated vs. actual time spent (i.e. assumed 5 min
            per activity, average is 20 min)
     o Effectiveness of content reuse
          o Rank of content across courses and campuses (e.g. frequency of same
            modules accessed)
     o Distribution:
          o Comparison of geography and frequency of use (e.g. which content
            should be localized?)


                                       #analytics
Xyleme Walk-Through


       #analytics
Closing Comments…. This is Possible


              #analytics
It is happening already….


         #analytics
It is part of how we live…


          #analytics
Summary


• Learning can’t be behind, they have to be ahead of the “Big
  Data” discussion.
• Learning analytics “needs to be” a core competency of
  Learning functions.
• Big Data in learning is driven by Big Content & Big Actions!
• Capturing data at the point of interaction is the most valuable
  and usable data.
• Going more granular gets you more of the right business
  outcomes.


                             #analytics
Coming Soon….

“Learning Meets Big Data: Using Analytics to Create Learning
      that Works!” industry research and white paper.


                          #analytics
Questions
Stacey.Harris@Brandonhall.com                              Stacey Harris
@StaceyHarrisHR                                     VP Research & Advisory Services
LinkedIn: Stacey Harris                                  Brandon Hall Group
                                                          @StaceyHarrisHR


                                                             Mark Hellinger
                                                                 CEO
Mark.Hellinger@Xyleme.com                                       Xyleme


         For more information please contact Brandon Hall Group at
               success@brandonhall.com or (561) 865-5017.


                                  #analytics
Thank You!


 #analytics

Learning Meets Big Data

  • 1.
    Learning Meets BigData: Using Analytics to Client logo here Create Learning that Works! PRESENTED BY: Stacey Harris, VP of Research & Advisory Services Mark Hellinger, CEO #analytics
  • 2.
    About Brandon HallGroup A preeminent research based advisory and analyst firm. Covering topic areas that provide strategic insights for executives and practitioners that are responsible for learning, talent, growth and business results within their organizations. Our focus is on ensuring continuous business performance. • Established in 1992 • Nearly 200,000 subscribers • Over 10,000 clients globally • Memberships and Research “We provide insight, objectivity, and personalized support” #analytics
  • 3.
    About Brandon HallGroup Research Focus: Client-Driven Offerings: • Learning and Development • Research Membership Program • Talent Management • KnowledgeBases • Leadership Development • Technology Selection • Sales and Marketing • Strategy and Planning • Executive Management • Customized Benchmarking • Supporting Technology Systems • Performance Driven Organization • Social Media and Diagnostic Communications • Vertical Market Analysis • Workshops • Excellence Awards • Smartchoice™ Certification #analytics
  • 4.
    Presenters Stacey Harris Mark Hellinger VP Research & Advisory Services CEO Brandon Hall Group Xyleme @StaceyHarrisHR @mhellinger #analytics
  • 5.
    Thank You toOur Sponsors! @xylemelearning #analytics
  • 6.
    Participation is Encouraged! How to Ask Questions and Make Comments During Session Type your questions into the question box Afterward For more information, please contact us at: Type in your question here Email: success@brandonhall.com Website: www.brandonhall.com Phone: (561) 306-3576 All attendees will receive the slides after the webinar #analytics
  • 7.
    Agenda LearningMeets Big Data: Using Analytics to Create Learning that Works!  Why today’s view of learning analytics isn’t working  Effective approaches to designing, developing, and measuring consumer driven learning  Learning as a business tool: What Good Analytics can do for you  How to use analytics and social content to drive continuous improvement of learning content  Examples: Learning Functions that focus on Performance Outcomes #analytics
  • 8.
    Poll Question One Haveyou heard of Big Data Analytics? 1. Yes, and I get its impact on learning. 2. Yes, but I don’t fully comprehend it. 3. No, haven’t really heard of it till now. If you’ve selected other please place the challenge in the Q&A box. #analytics
  • 9.
    What is BigData? How big data is gathered – and where the market is changing? A collection of data sets so large and complex that it is difficult to process or analyze using traditional database management tools. It has a characteristics that need to be managed such as: • Volume: A constantly growing amount of data • Velocity: The data moves and transforms at high speeds • Variety: The data is differentiated, with multiple types of data • Veracity: The data has high levels of trustworthiness, from how it is gathered to managed • Variability: The consistency and dependability of the data (how often it can be collected) • Complexity: You can connect and correlated relationships, hierarchies, and multiple data linkages The challenges often include capture, curation, storage, search, sharing, analysis, and visualization. • Granular and event driven 2.5 quintillion bytes of data are created every day – 90% of all data in the world has been created in the last 2 years alone. #analytics
  • 10.
    Why Has BigData Become Relevant? Advances in Technologies • Cheaper storage, faster processing speed, new processing technologies (parallel, clustering, virtualization), high connectivity and high throughputs, analytics tools with visualization. Advances in Consumer Trust • We are more comfortable sharing, tracking, and having our actions tracked than ever before. Advances in Consumer Expectations • We expect our worlds to be personalized and tailored. “The goal of all organizations with access to large data collections should be to harness the most relevant data and use it for optimized decision making.” #analytics
  • 11.
    Poll Question Two Whatreports are pulled most often from your current learning platforms? 1. Lists of Who Completed “X” Course 2. Lists of Who Registered for “X” Course 3. Lists of Who Attended a “Session” 4. Testing or Survey Scores 5. Other If you’ve selected other please place the answer in the Q&A box. #analytics
  • 12.
    Top Ways toGage Effective Learning Today 60.0% 54.4% 52.8% 50.0% 46.6% 40.0% 30.0% 20.1% 19.6% 20.0% 15.7% 13.9% 11.2% 10.1% 9.2% 8.7% 7.5% 7.2% 10.0% 0.0% BHG, Relationship Centered Learning N=601, 2012 #analytics
  • 13.
    Do We ThinkOur Learning is Effective? Networking/Events 64.5% 27.9% 8.5% Classroom Training 56.8% 40.1% 3.1% Social Learning 52.3% 25.0% 20.9% Media Based/E-Learning 52.3% 42.9% 4.8% Performance Support 49.5% 40.3% 10.3% Game-Based Learning 44.4% 25.0% 30.7% Blended Programs 35.6% 54.0% 9.8% Coaching Mentoring 26.7% 69.3% 4.0% Job Assignment 20.1% 75.6% 4.2% 0.0% 20.0% 40.0% 60.0% 80.0% 100.0% 120.0% Not Effective/Somewhat Effective/Very Effective N/A 46.6% of Companies said that Media Based Learning accounted for more than 50% of their development programs BHG, Employee Development and Performance N=400, 2012 #analytics
  • 14.
    Bad Reporting Leadsto Bad Decisions Poor Report Equals Poor Decision Decline in attendance Get rid of course Poor passing scores Make the certification test easier Increase in course requests Run more courses and make them cheaper to deliver High “smile” sheet scores Higher course investments Decline in on-line course Cut the online course completions Lack of social learning tool Cut the social learning tool usage #analytics
  • 15.
    Using Data toMake Decisions How we often do it today Make a Asked a Pull a Business Question Report Decision How much are we spending on Learning? Is Learning Effective? Has someone completed their compliance training? Is someone trained in this skill? Who went to this class? How many people completed this course? #analytics
  • 16.
    What is LearningAnalytics Learning Analytics is the analysis of connections and insights that can be gathered from comparing learning, people, and business data; for the purpose of making better business decisions. Course Completions Valued Content Business Decisions Financial Improvements Engagement Scores Learning Data People Data Analysis/Insights Business Outcomes Business Data #analytics
  • 17.
    Using Data toMake Decisions A Better Way! Make Identify Capture Report Analyze Business Data Data Data Data Decision #analytics
  • 18.
    Identify Learning Data Identify the learning data you have available Material Data • Curriculum • Course • Content Elements User Data • Demographics • Environment • Feedback Learning Data Identify • Testing Data • Surveys • Job Behaviors #analytics
  • 19.
    Capture Data Figure out the best location to capture the data • Manual Capture – Smile Sheets – Tests • LMS – Course Data – Curriculum Data – Some Learner Data • Assessment Systems – Tests – Surveys • HRMS/Payroll – Some Learner Data – Certification Data Capture • LCMS Data – Course Data – Content Data – Environment #analytics
  • 20.
    Report Data Report DataActivity • Raw Numbers • Sums • Percent's How? • Flat Reporting Files • Exported Reporting Files • Dynamic Reporting Tools • Visualization Tools Report Data #analytics
  • 21.
    Analyze and addInsights Effectiveness • Correlation Coefficients • Standard Deviations • Reliability Testing • Probability Testing Efficiency • Percent Differences • Mean Differences • Multiple Distributions • Ranges/Variances Impact Analyze • ANOVA’s Data • Regression Models • t-tests • Chi-Squares #analytics
  • 22.
    Making Good BusinessDecisions Operational Data + Learning Data + (Statistic/Algorithm/Pattern Matching) + Expert insights = Better Business Decisions Make Actionable Changes Business Decision #analytics
  • 24.
    Retail Service Workers Performance support portal: delivers personalized information to 3,000 stores o Store profile: Services offered, equipment used o Guides, procedures, and equipment matched to store profile so that only relevant info is delivered.  Analytics: delivers data back to content creators on the effectiveness of that information o Relevance: o Correlation between page access and time on (e.g. high access : high duration) o Gaps o Highest ranking terms and bounce rates (e.g. high bounces = gaps) o Reach: o Comparison of devices by geography and frequency of use (i.e. who is underserved?) #analytics
  • 25.
  • 26.
  • 27.
  • 28.
    Poll Question Three Howdo you currently decide to update content for learners? 1. When they complain 2. Once a year we update, based on assumed needs 3. Based on regular feedback and social comment 4. Based on course effectiveness measures 5. Other If you’ve selected other please place the answer in the Q&A box. #analytics
  • 29.
    Learning Analytics atthe Content Level Learning analytics provides insight into the data. Data you can capture, without user input: • Geography • Device and platform • Point of entry • Search terms used • Time spent with content and bounce rates • Point of exit • User information, group affiliations, geography As a content developer, do you think you would do things differently if you knew how people were actually using the content you create? Data collection systems track a user's path through the content and along the way collects actionable information. #analytics
  • 30.
    How Do youBuy A Car? How do you buy a car? Brand > Features > Look and Style #analytics
  • 31.
    How Are CarsUpdated? Mustang Cars, Continuous Improv 1st Generation 2nd Generation 4th Generation 5th Generation How does the manufacture decide what to keep and what to change on each model of a car? Data > Analysis > Business Decision #analytics
  • 33.
    Online University  Forprofit university: delivery of virtual courses o Hundreds of courses delivered globally to thousands of students  Analytics: student activity provides information on course content design o Validation of assumptions: o Correlation between estimated vs. actual time spent (i.e. assumed 5 min per activity, average is 20 min) o Effectiveness of content reuse o Rank of content across courses and campuses (e.g. frequency of same modules accessed) o Distribution: o Comparison of geography and frequency of use (e.g. which content should be localized?) #analytics
  • 34.
  • 35.
    Closing Comments…. Thisis Possible #analytics
  • 36.
    It is happeningalready…. #analytics
  • 37.
    It is partof how we live… #analytics
  • 38.
    Summary • Learning can’tbe behind, they have to be ahead of the “Big Data” discussion. • Learning analytics “needs to be” a core competency of Learning functions. • Big Data in learning is driven by Big Content & Big Actions! • Capturing data at the point of interaction is the most valuable and usable data. • Going more granular gets you more of the right business outcomes. #analytics
  • 39.
    Coming Soon…. “Learning MeetsBig Data: Using Analytics to Create Learning that Works!” industry research and white paper. #analytics
  • 40.
    Questions Stacey.Harris@Brandonhall.com Stacey Harris @StaceyHarrisHR VP Research & Advisory Services LinkedIn: Stacey Harris Brandon Hall Group @StaceyHarrisHR Mark Hellinger CEO Mark.Hellinger@Xyleme.com Xyleme For more information please contact Brandon Hall Group at success@brandonhall.com or (561) 865-5017. #analytics
  • 41.

Editor's Notes

  • #8 Over a 1/3 of learning organizations stated that their top priority in 2012 was creating a learning strategy. Why? As an industry, we are still struggling to measure the effectiveness of the learning we create and tie it to business performance. Developing a sound learning strategy requires direction, data and an honest assessment of what’s working and what’s not with your organizations’ learning. Stacey Harris, the VP of Research from Brandon Hall Group, and Mark Hellinger, CEO of Xyleme, will discuss insights on rethinking the idea of learning analytics. New research highlights how consumer driven learning is changing the market, and how new technologies can help you not only address those changes but do a better job at connecting your learning efforts to performance outcomes. We’ll share key practices in evaluating your learning; focusing on content, users, and business outcomes. Topics covered include:• Why today’s view of learning analytics isn’t working• Effective approaches to designing, developing, and measuring consumer driven learning • Learning as a business tool: What Good Analytics can do for you • How to use analytics and social content to drive continuous improvement of learning content.• Examples: Learning Functions that focus on Performance Outcomes
  • #10 Acollection of data sets so large and complex that it becomes difficult to process using on-hand database management tools. The challenges include capture, curation, storage,[3] search, sharing, analysis,[4] and visualization.Brandon Hall GroupEvery day, we create 2.5 quintillion bytes of data — so much that 90% of the data in the world today has been created in the last two years alone. This data comes from everywhere: sensors used to gather climate information, posts to social media sites, digital pictures and videos, purchase transaction records, and cell phone GPS signals to name a few. This data is big data.4 Dimensions to Big Data:Volume: Growing amount of DataVelocity: Speed of Data MovementVariety: Different Types of DataVeracity: Trustworthiness of DataOther factors to consider: Variability (consistency) and Complexity -  it is necessary to connect and correlate relationships, hierarchies and multiple data linkages or your data can quickly spiral out of control. Data governance can help you determine how disparate data relates to common definitions and how to systematically integrate structured and unstructured data assets to produce high-quality information that is useful, appropriate and up-to-date
  • #11 Include a Retail Image – Purchasing –Decisions (Data Mining) – Whole other direction of It is very important to understand that not all of your data will be relevant or useful. But how can you find the data points that matter most? It is a problem that is widely acknowledged. "Most businesses have made slow progress in extracting value from big data. And some companies attempt to use traditional data management practices on big data, only to learn that the old rules no longer apply," says Dan Briody, in the 2011 Economist Intelligence Unit's publication, "Big Data: Harnessing a Game-Changing Asset." "Most businesses have made slow progress in extracting value from big data. And some companies attempt to use traditional data management practices on big data, only to learn that the old rules no longer apply," says Dan Briody, in the 2011 Economist Intelligence Unit's publication, "Big Data: Harnessing a Game-Changing Asset." 
  • #14 Switch Colors!
  • #17 Learning DataPeople DataBusiness DataThe measurement, collection, reporting, and analysis of learning data in the context of other business, performance, financial, and talent data for purposes of making better business decisions, through understanding and optimizing learning and the environments in which it occurs
  • #20 Website Analysis Analogy (screen shot of google analytics)
  • #27 What does search term ranking infer?It indicates what people are interested in.The quality of results indicates the coverage of the subject matter users are interested in.The correlation of a term, and the time spend on the search result indicates the quality of the coverage. If user's bounce off a search result it indicates poor coverage of the subjectComparisons of this data by geography and user group affiliations can indicate how content is being used by segmented populations and draw out unmet needs and localization requirements 
  • #28 This data indicates the distribution by device. Training developers to can use this information in the following waysEnsure that content that is developed is accessible on the devices the audience usesIf goals of supporting mobile platforms are succeedingWhat does the ranking of page visits and long time spent infer?High visits and long time indicate engagement and interest in the subject.High visits and low times and high bounce rate interest but perhaps a problem with the contentIf correlated with low assessment results, high visits and high time can indicate the content is confusing.Comparisons of this data by geography and user group affiliations can indicate how content is being used by segmented populations and draw out unmet needs and localization requirements