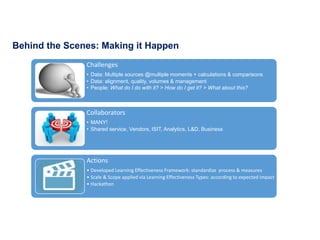
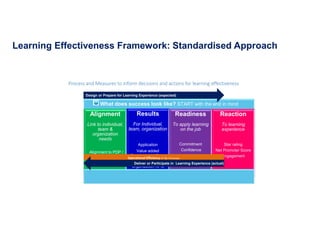
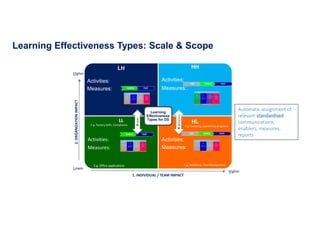
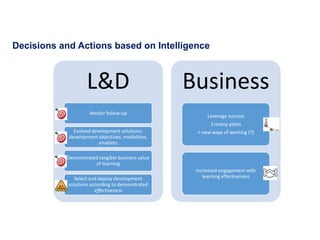
Thurs, 1 March 2018, 1 - 2 pm, Sydney
Ways to participate:
• Q&A Box - comment, whinge & opinions
• Twitter Backchannel - @lrncafe #learningportals
Learning Analytics – From
Reactive to Predictive
Knowledge
Sharing
Better Practices
Experienced
Panel
Introductions
Bayer
Belong
CBA
Cbus Super Fund
Cognizant Technology solutions
DHS
Dimension Data
Director Education
Domain Group
e3Learning
Eastern Health
Ericsson
Fairfax Media
Fuse Universal
GPC AP
Harvey NOrman
Herbert Smith Freehills
Hofffman Consulting
Hostplus
IAG
IAP2
Idaho State University
IMC AG
Instructure Inc
JB Consulting
JLT
LearnD
LearnGeek
Learning Measurement Advisory
Services
Legg Mason
Lever Transfer if Learning
Registrations
100+ 62+
Organisations
2
Vanesa Blewitt
Global Transformation
Lead - Learning
Intelligence &
Effectiveness
Nestle
Macquarie Bank
MCI
Melbourne Business School
NAB
Nestle
Northern Health
Open Colleges
Pepper Group Limited
Presence of IT
PSC
Qantas
QBE
Rio Tinto
Satellite
Savv-e Pty Ltd
SeertechSolutions
SimGHOSTS
simPRO
SimTabs
Skillsoft
Sonic Clinical Services
Sprout Labs
Squiz
Standards Australia
Suncorp
TAL
Telstra
Thiess
University of Limerick
Westpac
Sarajit Poddar
Workforce Planning &
Analytics
Ericsson, Singapore
Ericsson
Jeevan Joshi
LearnD and
LearningCafe
Thought
Leadership
Webinar
Discussions
UnConference
Blog
Magazine
Coffee
Catch Ups
Capability
Building
Workshops Community of
Professionals
with a focus on
implementing ideas
Building
Capability
4
Next Gen Skills Workshop
@learningcafe.com.au
4
Making Agile
Work for
Learning
Content
Curation for
Learning
Foundations of
Capability
Management
http://learningcafe.com.au/category/workshops/
5
6
7
Vanessa Blewitt
8
Global Transformation Lead –
Learning Intelligence & Effectiveness
Nestle
L&D: means to an end…not the end
The end: RESULTS for individuals, teams, organisations
Learning Effectiveness: Learning that delivers tangible business value
…Including data driven insights to inform decisions and actions
Learning Effectiveness & Learning Analytics: Setting the Scene
“Typical”
Pre-
2015
Pione
er &
Pilot
(internatio
nal
Training
Centre)
2015-
2016
Go-
Live in
ITC
2017 GLOBAL
2018-
2020
Training Events
Success looks like:
Our Journey
Pre* During Post
Learning Journeys
Process + Measures
* Higher impact development solutions
Success looks like: +
WHY & WHAT RESULTS:
Alignment > Application > Gaps
Closed > Value added to WoW
During
Industrialised Insights
Inform decisions &
actions
 L&D: Design & Deliver
 Business: Plan,
Prepare & Participate
Example: Current Reporting
• Focus = development solutions
• Reporting = Learning journeys
• Insights provide opportunities for
L&D + Business
• De-emphasise Reaction
• Different level of detail for different
stakeholders
Organisation / Employee / Development Solution / Time
Distribution
by Learning Object Type
Appraisal
* Rating
Application
of learning on the Job
Added Value
to Ways of Working
25%
33%
12%
30%
% Learners Active
eLearnin
g
Virtual
Population Participation
# # & %
Available
Accessed# # & %
Registered Completed
# # & %
Name Type % total learners
Xxx XX nn
Xxx nn
Name Type % appraisal
Xxx XX nn
Xxx nn
Name Type % application
Xxx XX nn
Xxx nn
Name Type added value
Xxx XX nn
Xxx nn
Name Type % total learners
Xxx XX nn
Xxx nn
Name Type % appraisal
Xxx XX nn
Xxx nn
Name Type % application
Xxx XX nn
Xxx nn
Name Type added value
Xxx XX nn
Xxx nn
TOP
10
BOTTOM
10
4.3 3 3.7 4.1
72 73 86 89
28 27 14 11% Did
Not
Apply
%
Applied
48504962
%…
Elearning
Video
Classroom
Learne
r
Development Solutions Learning Experiences
Did they choose it? Did they like it? Did they use it? Did it add value?
Under Development
Behind the Scenes: Making it Happen
Challenges
• Data: Multiple sources @multiple moments + calculations & comparisons
• Data: alignment, quality, volumes & management
• People: What do I do with it? > How do I get it? > What about this?
Collaborators
• MANY!
• Shared service, Vendors, ISIT, Analytics, L&D, Business
Actions
• Developed Learning Effectiveness Framework: standardize process & measures
• Scale & Scope applied via Learning Effectiveness Types: according to expected impact
• Hackathon
What does success look like? START with the end in mind
Alignment
Link to individual,
team &
organization
needs
Alignment to PDP /
OMP
Results
For Individual,
team, organization
Application
Value added
Development Gaps
Closed
Organization KPIs
Readiness
To apply learning
on the job
Commitment
Confidence
Assessments
Reaction
To learning
experience
Star rating
Net Promoter Score
Engagement
Design or Prepare for Learning Experience (expected)
Operational Efficiency of T&L Processes
Deliver or Participate in Learning Experience (actual)
Process and Measures to inform decisions and actions for learning effectiveness
Learning Effectiveness Framework: Standardised Approach
Learning Effectiveness Types: Scale & Scope
LH
Activities:
Measures:
HH
Activities:
Measures:
LL
Activities:
Measures:
HL
Activities:
Measures:
Learning
Effectiveness
Types for DS
2.ORGANIZATIONIMPACT
1. INDIVIDUAL / TEAM IMPACT
Higher
Lower
Higher
Skills
Behaviours
E.g. Factory SOPs, Compliance E.g. Coaching, Leadership programs
E.g. Office applications E.g. Resilience, Time Management
Automatic assignment of
relevant standardised
communications,
enablers, measures,
reports
Decisions and Actions based on Intelligence
L&D
Vendor follow-up
Evolved development solutions:
development objectives, modalities,
enablers
Demonstrated tangible business value
of learning
Select and deploy development
solutions according to demonstrated
effectiveness
Business
Leverage success
1>many pilots
> new ways of working (?)
Increased engagement with
learning effectiveness
• Learning and Development is not always the answer
• Measures alone are not enough
o Start with the WHY, Help with the HOW
• Everyone has a view: keep it as tight as possible but DO
get key stakeholder buy-in
• Looking beyond L&D does not = ownership
• Correlation not Causation
• Walk before you run
o Consistent measures > Correlations > Predictive analytics
Final thoughts
Sarajit Poddar
18
Workforce Planning & Analytics
Ericsson, Singapore
Predictive Analytics
in L&D
THOUGHTS FROM A PEOPLE ANALYTICS PROFESSIONAL
The Worlds Most Valuable Resource
The world’s most
valuable resource is no
longer oil, but data
- The economist
Data vs. Opinion
"If we have data, let’s
look at data. If all we
have are opinions, let’s
go with mine."
-Jim Barksdale, former Netscape CEO
The exponential growth of Data
The data volumes are
exploding, more data has
been created in the past two
years than in the entire
previous history of the human
race.
The Current State
Much Effort
goes into
Creating
Reports
Dashboards
are not
effective in
giving insights
Widespread
misconception
about Reporting
vs. Analytics
How many times do they
give us information on trend
and guide us towards and
action?
How many of them aren’t
just elegant reporting. Do
they tell us our strengths and
weaknesses, and where we
should focus?
What is stopping us from
changing the status quo?
Do they evolve over time?
Transitioning the focus from HR to
Business
HR Process
Focus
Business
Focus
Lets review some areas-
1. What the Organizations
competence needs in next 1
year, 3 years and 5 years
2. What is the savings potential
on Cost of Learning
Vendors?
3. What curriculum have the
most significant impact on
the company’s topline or
bottom-line?
The Approach!
Making sense
of Existing
Data
Look for new
ways of
capturing Data
Scan for Trend in the existing
Data. Look for key learning
Unstructured data captured
in Surveys, descriptions in
performance appraisal
What is stopping us from
changing the status quo?
Consider
Predictive
Analytics
The Art and Science of Prediction
Identify
variables that
impact the
outcome
Learn from
existing data
Predict and
Validate
Identify correlation between
the factors that might
influence the outcome and
the outcome
Train a machine learning
algorithm on the past data
Use the machine learning
algorithm to predict a future
outcome, and wait for that to
occur
A Prediction Scenario
What Learning curriculum will be
effective for a candidate who is
recently promoted to a Leadership
role in a particular country, in a certain
business line, in a certain function,
having certain years of experience?
Some thoughts!
 What competencies make good leaders in the organization?
 What Learning Program were taken by those having marked
improvement in performance?
 Can you predict the outcome of a learning curriculum on the
performance of the participant?
 What learning programs are suited for those identified as
successors of leadership or other critical positions?
 Which learning vendor will have a higher likelihood of having
a positive impact on a new learning curriculum?
Final Thoughts!
Business
Strategy
Analytics is a cross disciplinary approach. It neither starts nor ends
with us!
Workforce Strategy &
Planning
Talent Acquisition
Learning & Development
Talent Management
Total Rewards
People
outcome
Business
Outcome
Jeevan Joshi
30
31
Why is there
plenty of
completion
reporting and
very little
analytics
happening ?
We are using
mandatory
learning
operating
system in a
world of
discretionary
learning.
Takeaways
32
Predictive analytics
will play an important
role in discretionary
learning.
The very nature of
discretionary learning
make learning
analytics difficult to
implement.
You need really large
amounts of robust
date for things like AI
and Machine
Learning.
There is cost to
measure. Not all
learning needs to be
measured as long as
it is consumed.
Organisational Learning is shifting away from
mandatory Learning
http://www.simplypsychology.org/maslow.html
Compliance
Technical Training etc.
Behaviour
Productivity
Innovation
Culture
MandatorylearningDiscretionarylearning
Source : Jeevan Joshi, LearningCafe
Competitive
Advantage
Mandatory
Easy to
Measure
Difficult to
Measure
Compliance
Technical Training
etc.
Innovation
Culture
Behaviour
Productivity
Current
L&D world
What
business
needs
What
business
gets
Source : Jeevan Joshi, LearningCafe
Expanding Learning Footprint is a challenge
36
Online Courses on LMS + Webinar
Classroom Courses/ Online
Coaching
On Job Activities (competence demo)
Assessments/surveys (e.g. survey
monkey)
Simulation
Performance Support Tool
Secondment
Intranet – Videos/podcasts
Discussion Boards (COP)(yammer)
Wiki
On job activities (Perf Management)
Discussions
Team meetings (learning component)
Other business systems
MOOCs
External courses
Formal Education (Degrees)
Formal Collaborative Program with
Unis
Memberships/prof bodies
Formal mentoring programs
Certifications/exams
Social Media
Youtube
Facebook
Website – HBR
Any web resource
External COP
Coffee conversations
Formality
Sources
Internal
Informal
External
Formal
Source : Jeevan Joshi, LearningCafe
Controlled
Environment
37
Layers of Tin Can Onion
38
Layer 1
• Modern version of
SCORM
Layer 2
• Record any
learning
experience
Layer 3
• Frees data from
LMS
Layer 4
• Correlate job
performance and
training data
http://tincanapi.com/the-layers-of-tin-can/
Happening Aspirational
Technical Strategic
Low readiness Maturity /capability
39
Learning Café View
Time ->2016
Now
2020
Face to Face
Online Learning – Legacy /compliance approach
Online Learning – Next Gen (VR,AR, Social)
Predictive analytics
Self Organising Learning
Tin
Can
L&D Capability
Jump 3
L&D Capability
Jump 2
L&D Capability
Jump 1
????
Professional Development Framework
for the Next Gen L&D - Where do I start?
41
Business Partnership
Project Management
L&D Theory
Analysis
Design
Development
Implementation
Evaluation
DigitalAcumen
ConsultingApproach
BusinessAcumen
Agile&DesignThinking
Emerging
Tech
Start Up/
Entrepreneurship
Knowledge
Management
Workforce/HR
Trends
Emerging Research in Management
Industry
Knowledge
Capability Management
Existing Capability
Next Gen Capability
Scaffolding Awareness
Takeaways
42
Predictive analytics
will play an important
role in discretionary
learning
The very nature of
discretionary learning
make learning
analytics difficult to
implement.
You need really large
amounts of robust
date for things like AI
and Machine
Learning.
There is cost to
measure. Not all
learning needs to be
measured as long as
it is consumed.
www.learningcafe.com.au
lrncafe
http://bit.ly/lcafefb
blogs
learning conversations
free resources
workshops
UnConference
Sydney Melbourne
Webinar recording, ebooks, L&D frameworks
Building Effective Employee Social Networks
43
Ideas@work Collaborations
Next Steps
Join Special
Interest
Community
Attend Workshops
Attend
UnConference
Melbourne
Brisbane
LearningCafe
LinkedIn Subgroup
Register interest
www.learningcafe.com.au
Register interest
www.learningcafe.com.au
Or send us an email - enquiry@learningcafe.com.au
44

Learning Analytics – From Reactive to Predictive

  • 1.
    Thurs, 1 March2018, 1 - 2 pm, Sydney Ways to participate: • Q&A Box - comment, whinge & opinions • Twitter Backchannel - @lrncafe #learningportals Learning Analytics – From Reactive to Predictive Knowledge Sharing Better Practices Experienced Panel
  • 2.
    Introductions Bayer Belong CBA Cbus Super Fund CognizantTechnology solutions DHS Dimension Data Director Education Domain Group e3Learning Eastern Health Ericsson Fairfax Media Fuse Universal GPC AP Harvey NOrman Herbert Smith Freehills Hofffman Consulting Hostplus IAG IAP2 Idaho State University IMC AG Instructure Inc JB Consulting JLT LearnD LearnGeek Learning Measurement Advisory Services Legg Mason Lever Transfer if Learning Registrations 100+ 62+ Organisations 2 Vanesa Blewitt Global Transformation Lead - Learning Intelligence & Effectiveness Nestle Macquarie Bank MCI Melbourne Business School NAB Nestle Northern Health Open Colleges Pepper Group Limited Presence of IT PSC Qantas QBE Rio Tinto Satellite Savv-e Pty Ltd SeertechSolutions SimGHOSTS simPRO SimTabs Skillsoft Sonic Clinical Services Sprout Labs Squiz Standards Australia Suncorp TAL Telstra Thiess University of Limerick Westpac Sarajit Poddar Workforce Planning & Analytics Ericsson, Singapore Ericsson Jeevan Joshi LearnD and LearningCafe
  • 3.
  • 4.
    Next Gen SkillsWorkshop @learningcafe.com.au 4 Making Agile Work for Learning Content Curation for Learning Foundations of Capability Management http://learningcafe.com.au/category/workshops/
  • 5.
  • 6.
  • 7.
  • 8.
    Vanessa Blewitt 8 Global TransformationLead – Learning Intelligence & Effectiveness Nestle
  • 9.
    L&D: means toan end…not the end The end: RESULTS for individuals, teams, organisations Learning Effectiveness: Learning that delivers tangible business value …Including data driven insights to inform decisions and actions Learning Effectiveness & Learning Analytics: Setting the Scene
  • 10.
    “Typical” Pre- 2015 Pione er & Pilot (internatio nal Training Centre) 2015- 2016 Go- Live in ITC 2017GLOBAL 2018- 2020 Training Events Success looks like: Our Journey Pre* During Post Learning Journeys Process + Measures * Higher impact development solutions Success looks like: + WHY & WHAT RESULTS: Alignment > Application > Gaps Closed > Value added to WoW During Industrialised Insights Inform decisions & actions  L&D: Design & Deliver  Business: Plan, Prepare & Participate
  • 11.
    Example: Current Reporting •Focus = development solutions • Reporting = Learning journeys • Insights provide opportunities for L&D + Business • De-emphasise Reaction • Different level of detail for different stakeholders
  • 12.
    Organisation / Employee/ Development Solution / Time Distribution by Learning Object Type Appraisal * Rating Application of learning on the Job Added Value to Ways of Working 25% 33% 12% 30% % Learners Active eLearnin g Virtual Population Participation # # & % Available Accessed# # & % Registered Completed # # & % Name Type % total learners Xxx XX nn Xxx nn Name Type % appraisal Xxx XX nn Xxx nn Name Type % application Xxx XX nn Xxx nn Name Type added value Xxx XX nn Xxx nn Name Type % total learners Xxx XX nn Xxx nn Name Type % appraisal Xxx XX nn Xxx nn Name Type % application Xxx XX nn Xxx nn Name Type added value Xxx XX nn Xxx nn TOP 10 BOTTOM 10 4.3 3 3.7 4.1 72 73 86 89 28 27 14 11% Did Not Apply % Applied 48504962 %… Elearning Video Classroom Learne r Development Solutions Learning Experiences Did they choose it? Did they like it? Did they use it? Did it add value? Under Development
  • 13.
    Behind the Scenes:Making it Happen Challenges • Data: Multiple sources @multiple moments + calculations & comparisons • Data: alignment, quality, volumes & management • People: What do I do with it? > How do I get it? > What about this? Collaborators • MANY! • Shared service, Vendors, ISIT, Analytics, L&D, Business Actions • Developed Learning Effectiveness Framework: standardize process & measures • Scale & Scope applied via Learning Effectiveness Types: according to expected impact • Hackathon
  • 14.
    What does successlook like? START with the end in mind Alignment Link to individual, team & organization needs Alignment to PDP / OMP Results For Individual, team, organization Application Value added Development Gaps Closed Organization KPIs Readiness To apply learning on the job Commitment Confidence Assessments Reaction To learning experience Star rating Net Promoter Score Engagement Design or Prepare for Learning Experience (expected) Operational Efficiency of T&L Processes Deliver or Participate in Learning Experience (actual) Process and Measures to inform decisions and actions for learning effectiveness Learning Effectiveness Framework: Standardised Approach
  • 15.
    Learning Effectiveness Types:Scale & Scope LH Activities: Measures: HH Activities: Measures: LL Activities: Measures: HL Activities: Measures: Learning Effectiveness Types for DS 2.ORGANIZATIONIMPACT 1. INDIVIDUAL / TEAM IMPACT Higher Lower Higher Skills Behaviours E.g. Factory SOPs, Compliance E.g. Coaching, Leadership programs E.g. Office applications E.g. Resilience, Time Management Automatic assignment of relevant standardised communications, enablers, measures, reports
  • 16.
    Decisions and Actionsbased on Intelligence L&D Vendor follow-up Evolved development solutions: development objectives, modalities, enablers Demonstrated tangible business value of learning Select and deploy development solutions according to demonstrated effectiveness Business Leverage success 1>many pilots > new ways of working (?) Increased engagement with learning effectiveness
  • 17.
    • Learning andDevelopment is not always the answer • Measures alone are not enough o Start with the WHY, Help with the HOW • Everyone has a view: keep it as tight as possible but DO get key stakeholder buy-in • Looking beyond L&D does not = ownership • Correlation not Causation • Walk before you run o Consistent measures > Correlations > Predictive analytics Final thoughts
  • 18.
    Sarajit Poddar 18 Workforce Planning& Analytics Ericsson, Singapore
  • 19.
    Predictive Analytics in L&D THOUGHTSFROM A PEOPLE ANALYTICS PROFESSIONAL
  • 20.
    The Worlds MostValuable Resource The world’s most valuable resource is no longer oil, but data - The economist
  • 21.
    Data vs. Opinion "Ifwe have data, let’s look at data. If all we have are opinions, let’s go with mine." -Jim Barksdale, former Netscape CEO
  • 22.
    The exponential growthof Data The data volumes are exploding, more data has been created in the past two years than in the entire previous history of the human race.
  • 23.
    The Current State MuchEffort goes into Creating Reports Dashboards are not effective in giving insights Widespread misconception about Reporting vs. Analytics How many times do they give us information on trend and guide us towards and action? How many of them aren’t just elegant reporting. Do they tell us our strengths and weaknesses, and where we should focus? What is stopping us from changing the status quo? Do they evolve over time?
  • 24.
    Transitioning the focusfrom HR to Business HR Process Focus Business Focus Lets review some areas- 1. What the Organizations competence needs in next 1 year, 3 years and 5 years 2. What is the savings potential on Cost of Learning Vendors? 3. What curriculum have the most significant impact on the company’s topline or bottom-line?
  • 25.
    The Approach! Making sense ofExisting Data Look for new ways of capturing Data Scan for Trend in the existing Data. Look for key learning Unstructured data captured in Surveys, descriptions in performance appraisal What is stopping us from changing the status quo? Consider Predictive Analytics
  • 26.
    The Art andScience of Prediction Identify variables that impact the outcome Learn from existing data Predict and Validate Identify correlation between the factors that might influence the outcome and the outcome Train a machine learning algorithm on the past data Use the machine learning algorithm to predict a future outcome, and wait for that to occur
  • 27.
    A Prediction Scenario WhatLearning curriculum will be effective for a candidate who is recently promoted to a Leadership role in a particular country, in a certain business line, in a certain function, having certain years of experience?
  • 28.
    Some thoughts!  Whatcompetencies make good leaders in the organization?  What Learning Program were taken by those having marked improvement in performance?  Can you predict the outcome of a learning curriculum on the performance of the participant?  What learning programs are suited for those identified as successors of leadership or other critical positions?  Which learning vendor will have a higher likelihood of having a positive impact on a new learning curriculum?
  • 29.
    Final Thoughts! Business Strategy Analytics isa cross disciplinary approach. It neither starts nor ends with us! Workforce Strategy & Planning Talent Acquisition Learning & Development Talent Management Total Rewards People outcome Business Outcome
  • 30.
  • 31.
    31 Why is there plentyof completion reporting and very little analytics happening ? We are using mandatory learning operating system in a world of discretionary learning.
  • 32.
    Takeaways 32 Predictive analytics will playan important role in discretionary learning. The very nature of discretionary learning make learning analytics difficult to implement. You need really large amounts of robust date for things like AI and Machine Learning. There is cost to measure. Not all learning needs to be measured as long as it is consumed.
  • 33.
    Organisational Learning isshifting away from mandatory Learning http://www.simplypsychology.org/maslow.html Compliance Technical Training etc. Behaviour Productivity Innovation Culture MandatorylearningDiscretionarylearning Source : Jeevan Joshi, LearningCafe
  • 34.
    Competitive Advantage Mandatory Easy to Measure Difficult to Measure Compliance TechnicalTraining etc. Innovation Culture Behaviour Productivity Current L&D world What business needs What business gets Source : Jeevan Joshi, LearningCafe
  • 35.
    Source : JeevanJoshi, LearningCafe
  • 36.
    Expanding Learning Footprintis a challenge 36 Online Courses on LMS + Webinar Classroom Courses/ Online Coaching On Job Activities (competence demo) Assessments/surveys (e.g. survey monkey) Simulation Performance Support Tool Secondment Intranet – Videos/podcasts Discussion Boards (COP)(yammer) Wiki On job activities (Perf Management) Discussions Team meetings (learning component) Other business systems MOOCs External courses Formal Education (Degrees) Formal Collaborative Program with Unis Memberships/prof bodies Formal mentoring programs Certifications/exams Social Media Youtube Facebook Website – HBR Any web resource External COP Coffee conversations Formality Sources Internal Informal External Formal Source : Jeevan Joshi, LearningCafe Controlled Environment
  • 37.
  • 38.
    Layers of TinCan Onion 38 Layer 1 • Modern version of SCORM Layer 2 • Record any learning experience Layer 3 • Frees data from LMS Layer 4 • Correlate job performance and training data http://tincanapi.com/the-layers-of-tin-can/ Happening Aspirational Technical Strategic Low readiness Maturity /capability
  • 39.
  • 40.
    Learning Café View Time->2016 Now 2020 Face to Face Online Learning – Legacy /compliance approach Online Learning – Next Gen (VR,AR, Social) Predictive analytics Self Organising Learning Tin Can L&D Capability Jump 3 L&D Capability Jump 2 L&D Capability Jump 1 ????
  • 41.
    Professional Development Framework forthe Next Gen L&D - Where do I start? 41 Business Partnership Project Management L&D Theory Analysis Design Development Implementation Evaluation DigitalAcumen ConsultingApproach BusinessAcumen Agile&DesignThinking Emerging Tech Start Up/ Entrepreneurship Knowledge Management Workforce/HR Trends Emerging Research in Management Industry Knowledge Capability Management Existing Capability Next Gen Capability Scaffolding Awareness
  • 42.
    Takeaways 42 Predictive analytics will playan important role in discretionary learning The very nature of discretionary learning make learning analytics difficult to implement. You need really large amounts of robust date for things like AI and Machine Learning. There is cost to measure. Not all learning needs to be measured as long as it is consumed.
  • 43.
    www.learningcafe.com.au lrncafe http://bit.ly/lcafefb blogs learning conversations free resources workshops UnConference SydneyMelbourne Webinar recording, ebooks, L&D frameworks Building Effective Employee Social Networks 43 Ideas@work Collaborations
  • 44.
    Next Steps Join Special Interest Community AttendWorkshops Attend UnConference Melbourne Brisbane LearningCafe LinkedIn Subgroup Register interest www.learningcafe.com.au Register interest www.learningcafe.com.au Or send us an email - enquiry@learningcafe.com.au 44