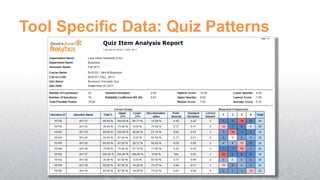
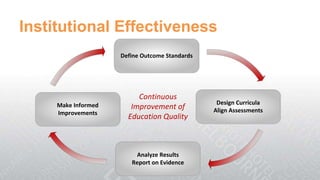
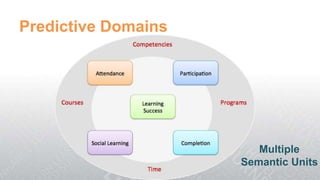
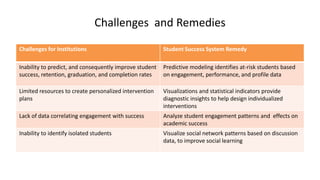
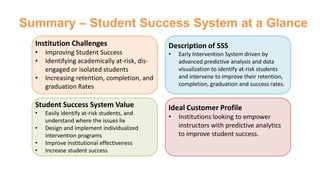
Norman,
Oklahoma
What is Analytics?
• Analytics is the use of data, statistical and
  quantitative methods, and explanatory and
  predictive models to allow organizations and
  individuals to gain insights into and act on
  complex issues.
• In colleges and universities, analytics is used to
  improve operational efficiency and student
  success.
           Source: Educause, Oblinger: Let’s Talk Analytics
           http://www.educause.edu/ero/article/lets-talk-analytics
What is Analytics?
• The term big data is often used interchangeably
  with analytics, but the scientific community
  uses big data to describe research that uses
  massive amounts of data.
• The use of analytics to improve administrative
  functions is often called business
  intelligence; similarly, academic analytics is
  used to help run the business of the higher
  education institution.
          Source: Educause, Oblinger: Let’s Talk Analytics
          http://www.educause.edu/ero/article/lets-talk-analytics
What is Analytics?
• Finally, learning analytics focuses specifically on
  students and their learning behaviors, gathering
  data from course management and student
  information systems in order to improve student
  success.
• Although the labels can be confusing, overall the
  term analytics refers to an approach that can be
  used to explore a broad range of questions.
           Source: Educause, Oblinger: Let’s Talk Analytics
           http://www.educause.edu/ero/article/lets-talk-analytics
Advanced Analytics
Analytics Maturity Levels
Information Value


                      Insight
Analytics: Big Data (R2)
                  Multiple Levels of
                     Reporting
                  with Drill-Down
                       Filters
                                         Extensive
                                       Data Domains


                                   Aggregates and
                                  Trends Over Time
Big Data: Data Sets
•   Enrollments. The enrollment data mart tracks user enrollments and withdrawals
    across one or more organizations.
•   Competencies. The competencies data mart tracks competencies, learning objectives,
    activities and rubrics by user, department, program, institution, and system.
•   User Logins. The user access data mart tracks the number of user logins/distinct
    sessions over a period of time. It is a very simple way of tracking student patterns of
    accessing the system.
•   Content and Tool Access. The module data mart tracks content access & tool usage.
•   Web Analytics. The web analytics data marts track internet statistics such as
    bandwidth usage, geographical location, and browser types.
•   Test and Quizzes. The quizzing data mart tracks quiz, test, and survey results,
    including measuring of quiz effectiveness.
•   Grades. The grades data mart tracks grades at student, course, department or school
    level, including filtering by grade ranges or date ranges.
Tech Data
•   IIS Web Analytics
•   Client Access
    (OS/Browser)
•   SMTP
•   Global/Local
    Traffic Manager
    Logs
Elemental LMS Data
Elemental LMS Data: Data Mining
Tool Usage: Overall vs. Pattern
Tool Specific Data: Content
Tool Specific Data: Quiz Overall
Tool Specific Data: Quiz Patterns
Grades Data: Org vs. Course
Institutional Effectiveness
                     Define Outcome Standards


                          Continuous
     Make Informed                               Design Curricula
                        Improvement of          Align Assessments
     Improvements
                       Education Quality


                         Analyze Results
                        Report on Evidence
Curriculum Mapping: Mechanics
Institution


  Program


      Department


        Courses
Curriculum Mapping: Big Data
Learning Outcome Evaluation
Learner Competency Progress


                          }   View Overall
                              Proficiencies
Big Data: Risk Analysis
Analytics Maturity Levels
Information Value


                      Insight
Analytics Optimization


            finding an optimal path to a desired future
Application Logic

          Exceptional
Predict                 Intervene   Success
            At-Risk
Application Workflow
                  Understand the Problem

                   Interrogate Raw Data

                    Reach a Diagnosis

                 Intervene, Make a Referral

                    Track the Success
Limitations of Current Approach
• Interpretation
   • Not enough information for intervention
• Interactivity
   • Unable to interrogate and make sense of the particulars
• Generalizability
   • Same model is used for every course at every
     institution
Collective Intelligence


          Consensus decision making
Predictive Domains


                        Multiple
                     Semantic Units
Student Success System (S3)
SSS is an Early Intervention System. It empower institutions with predictive
analytics tools for improving student success, retention, completion, and
graduation rates.

Highlights
– Course-specific predictions of student success and risk levels
– Success index that enables comparison of key success indicators
– Innovative data visualizations
– Case history and intervention management

Availability
General Availability in 2013. (Pilot project starting Oct. 2012)
Student Success System
Powerful Reporting and Analysis
             Personalized                 Detailed analysis lets you drill
             assessment                   down to individual classes


Intervention   }

                                                                         }
management
                                                                             In-depth
Success
indicators
             }                                                               reporting


                             Innovative data visualizations
Challenges and Remedies
Challenges for Institutions                              Student Success System Remedy

Inability to predict, and consequently improve student   Predictive modeling identifies at-risk students based
success, retention, graduation, and completion rates     on engagement, performance, and profile data

Limited resources to create personalized intervention    Visualizations and statistical indicators provide
plans                                                    diagnostic insights to help design individualized
                                                         interventions
Lack of data correlating engagement with success         Analyze student engagement patterns and effects on
                                                         academic success
Inability to identify isolated students                  Visualize social network patterns based on discussion
                                                         data, to improve social learning
Value to Institutions and Students
• Predictive analytics provides early identification of at-risk
  students enabling instructors to identify and understand
  where issues are and create appropriate resolution plans
  to address the problem
• Graduation and retention rates are increased when at-risk
  students are identified early on the process and supported
  throughout the term with informed counter-tactics
Summary – Student Success System at a Glance
  Institution Challenges                       Description of SSS
  •   Improving Student Success                •   Early Intervention System driven by
  •   Identifying academically at-risk, dis-       advanced predictive analysis and data
      engaged or isolated students                 visualization to identify at-risk students
  •   Increasing retention, completion, and        and intervene to improve their retention,
      graduation Rates                             completion, graduation and success rates.


  Student Success System Value                 Ideal Customer Profile
  •   Easily identify at-risk students, and
                                               •   Institutions looking to empower
      understand where the issues lie
  •   Design and implement individualized          instructors with predictive analytics
      intervention programs                        to improve student success.
  •   Improve institutional effectiveness
  •   Increase student success
Norman,
Oklahoma

Desire2Learn Analytics Oklahoma RUF

  • 1.
  • 2.
    What is Analytics? •Analytics is the use of data, statistical and quantitative methods, and explanatory and predictive models to allow organizations and individuals to gain insights into and act on complex issues. • In colleges and universities, analytics is used to improve operational efficiency and student success. Source: Educause, Oblinger: Let’s Talk Analytics http://www.educause.edu/ero/article/lets-talk-analytics
  • 3.
    What is Analytics? •The term big data is often used interchangeably with analytics, but the scientific community uses big data to describe research that uses massive amounts of data. • The use of analytics to improve administrative functions is often called business intelligence; similarly, academic analytics is used to help run the business of the higher education institution. Source: Educause, Oblinger: Let’s Talk Analytics http://www.educause.edu/ero/article/lets-talk-analytics
  • 4.
    What is Analytics? •Finally, learning analytics focuses specifically on students and their learning behaviors, gathering data from course management and student information systems in order to improve student success. • Although the labels can be confusing, overall the term analytics refers to an approach that can be used to explore a broad range of questions. Source: Educause, Oblinger: Let’s Talk Analytics http://www.educause.edu/ero/article/lets-talk-analytics
  • 5.
  • 6.
  • 7.
    Analytics: Big Data(R2) Multiple Levels of Reporting with Drill-Down Filters Extensive Data Domains Aggregates and Trends Over Time
  • 8.
    Big Data: DataSets • Enrollments. The enrollment data mart tracks user enrollments and withdrawals across one or more organizations. • Competencies. The competencies data mart tracks competencies, learning objectives, activities and rubrics by user, department, program, institution, and system. • User Logins. The user access data mart tracks the number of user logins/distinct sessions over a period of time. It is a very simple way of tracking student patterns of accessing the system. • Content and Tool Access. The module data mart tracks content access & tool usage. • Web Analytics. The web analytics data marts track internet statistics such as bandwidth usage, geographical location, and browser types. • Test and Quizzes. The quizzing data mart tracks quiz, test, and survey results, including measuring of quiz effectiveness. • Grades. The grades data mart tracks grades at student, course, department or school level, including filtering by grade ranges or date ranges.
  • 9.
    Tech Data • IIS Web Analytics • Client Access (OS/Browser) • SMTP • Global/Local Traffic Manager Logs
  • 10.
  • 11.
  • 12.
  • 13.
  • 14.
    Tool Specific Data:Quiz Overall
  • 15.
    Tool Specific Data:Quiz Patterns
  • 16.
    Grades Data: Orgvs. Course
  • 17.
    Institutional Effectiveness Define Outcome Standards Continuous Make Informed Design Curricula Improvement of Align Assessments Improvements Education Quality Analyze Results Report on Evidence
  • 18.
  • 19.
  • 20.
  • 21.
    Learner Competency Progress } View Overall Proficiencies
  • 22.
  • 23.
  • 24.
    Analytics Optimization finding an optimal path to a desired future
  • 25.
    Application Logic Exceptional Predict Intervene Success At-Risk
  • 26.
    Application Workflow Understand the Problem Interrogate Raw Data Reach a Diagnosis Intervene, Make a Referral Track the Success
  • 27.
    Limitations of CurrentApproach • Interpretation • Not enough information for intervention • Interactivity • Unable to interrogate and make sense of the particulars • Generalizability • Same model is used for every course at every institution
  • 28.
    Collective Intelligence Consensus decision making
  • 29.
    Predictive Domains Multiple Semantic Units
  • 30.
    Student Success System(S3) SSS is an Early Intervention System. It empower institutions with predictive analytics tools for improving student success, retention, completion, and graduation rates. Highlights – Course-specific predictions of student success and risk levels – Success index that enables comparison of key success indicators – Innovative data visualizations – Case history and intervention management Availability General Availability in 2013. (Pilot project starting Oct. 2012)
  • 31.
  • 32.
    Powerful Reporting andAnalysis Personalized Detailed analysis lets you drill assessment down to individual classes Intervention } } management In-depth Success indicators } reporting Innovative data visualizations
  • 33.
    Challenges and Remedies Challengesfor Institutions Student Success System Remedy Inability to predict, and consequently improve student Predictive modeling identifies at-risk students based success, retention, graduation, and completion rates on engagement, performance, and profile data Limited resources to create personalized intervention Visualizations and statistical indicators provide plans diagnostic insights to help design individualized interventions Lack of data correlating engagement with success Analyze student engagement patterns and effects on academic success Inability to identify isolated students Visualize social network patterns based on discussion data, to improve social learning
  • 34.
    Value to Institutionsand Students • Predictive analytics provides early identification of at-risk students enabling instructors to identify and understand where issues are and create appropriate resolution plans to address the problem • Graduation and retention rates are increased when at-risk students are identified early on the process and supported throughout the term with informed counter-tactics
  • 35.
    Summary – StudentSuccess System at a Glance Institution Challenges Description of SSS • Improving Student Success • Early Intervention System driven by • Identifying academically at-risk, dis- advanced predictive analysis and data engaged or isolated students visualization to identify at-risk students • Increasing retention, completion, and and intervene to improve their retention, graduation Rates completion, graduation and success rates. Student Success System Value Ideal Customer Profile • Easily identify at-risk students, and • Institutions looking to empower understand where the issues lie • Design and implement individualized instructors with predictive analytics intervention programs to improve student success. • Improve institutional effectiveness • Increase student success
  • 36.

Editor's Notes

  • #34 Market demand for predictive analytics is growing very rapidly, especially in higher education Trends indicated in EduCause reportsD2L Quarterly Market Update Q1/2012Predictive models have been developed at Capella UniversityRio Salado College University of Phoenix