Download as PDF, PPTX

![Page 13
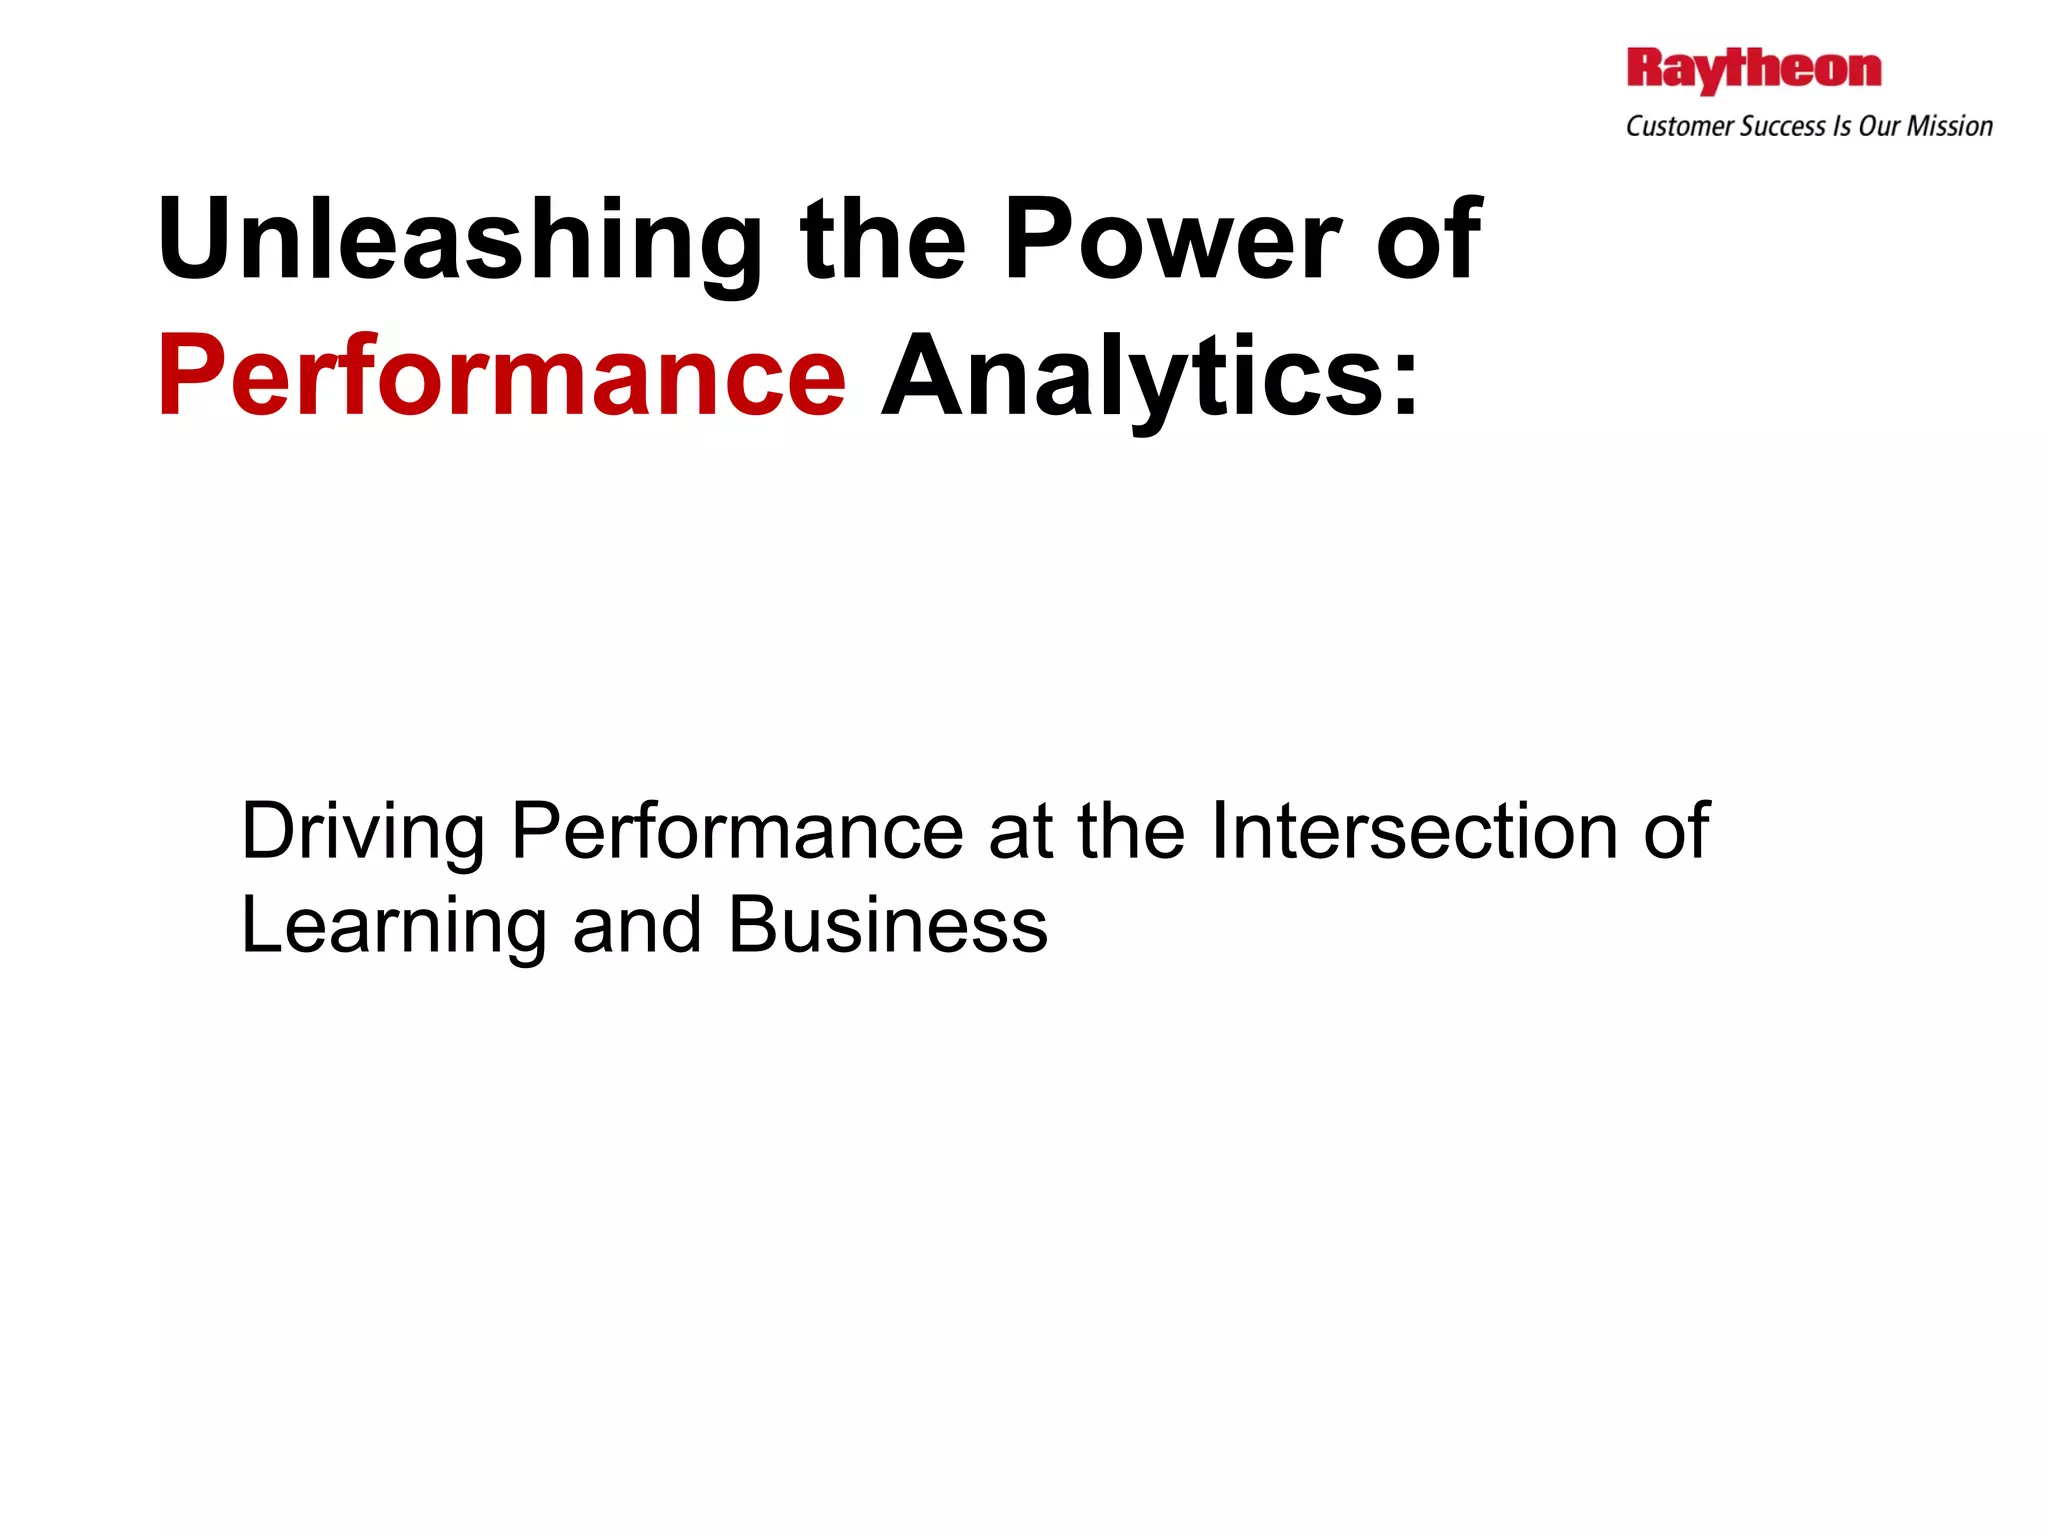
Half of all organizations are using HR and
business data in their learning analytics.
71%
54%
48%
11%
0% 20% 40% 60% 80%
Learning analytics (i.e. course and
curriculum completions, certification
level)
Performance analytics (i.e. business
KPIs [descriptive, diagnostics or
predictive])
HR or talent management analytics
(i.e. attrition, loyalty, education level)
None of the above
Sources of Data used by L&D](https://image.slidesharecdn.com/9-151008150238-lva1-app6892/75/Unleashing-the-Power-of-Analytics-Driving-Performance-at-the-Intersection-of-Learning-and-Business-13-2048.jpg)
![Page 24
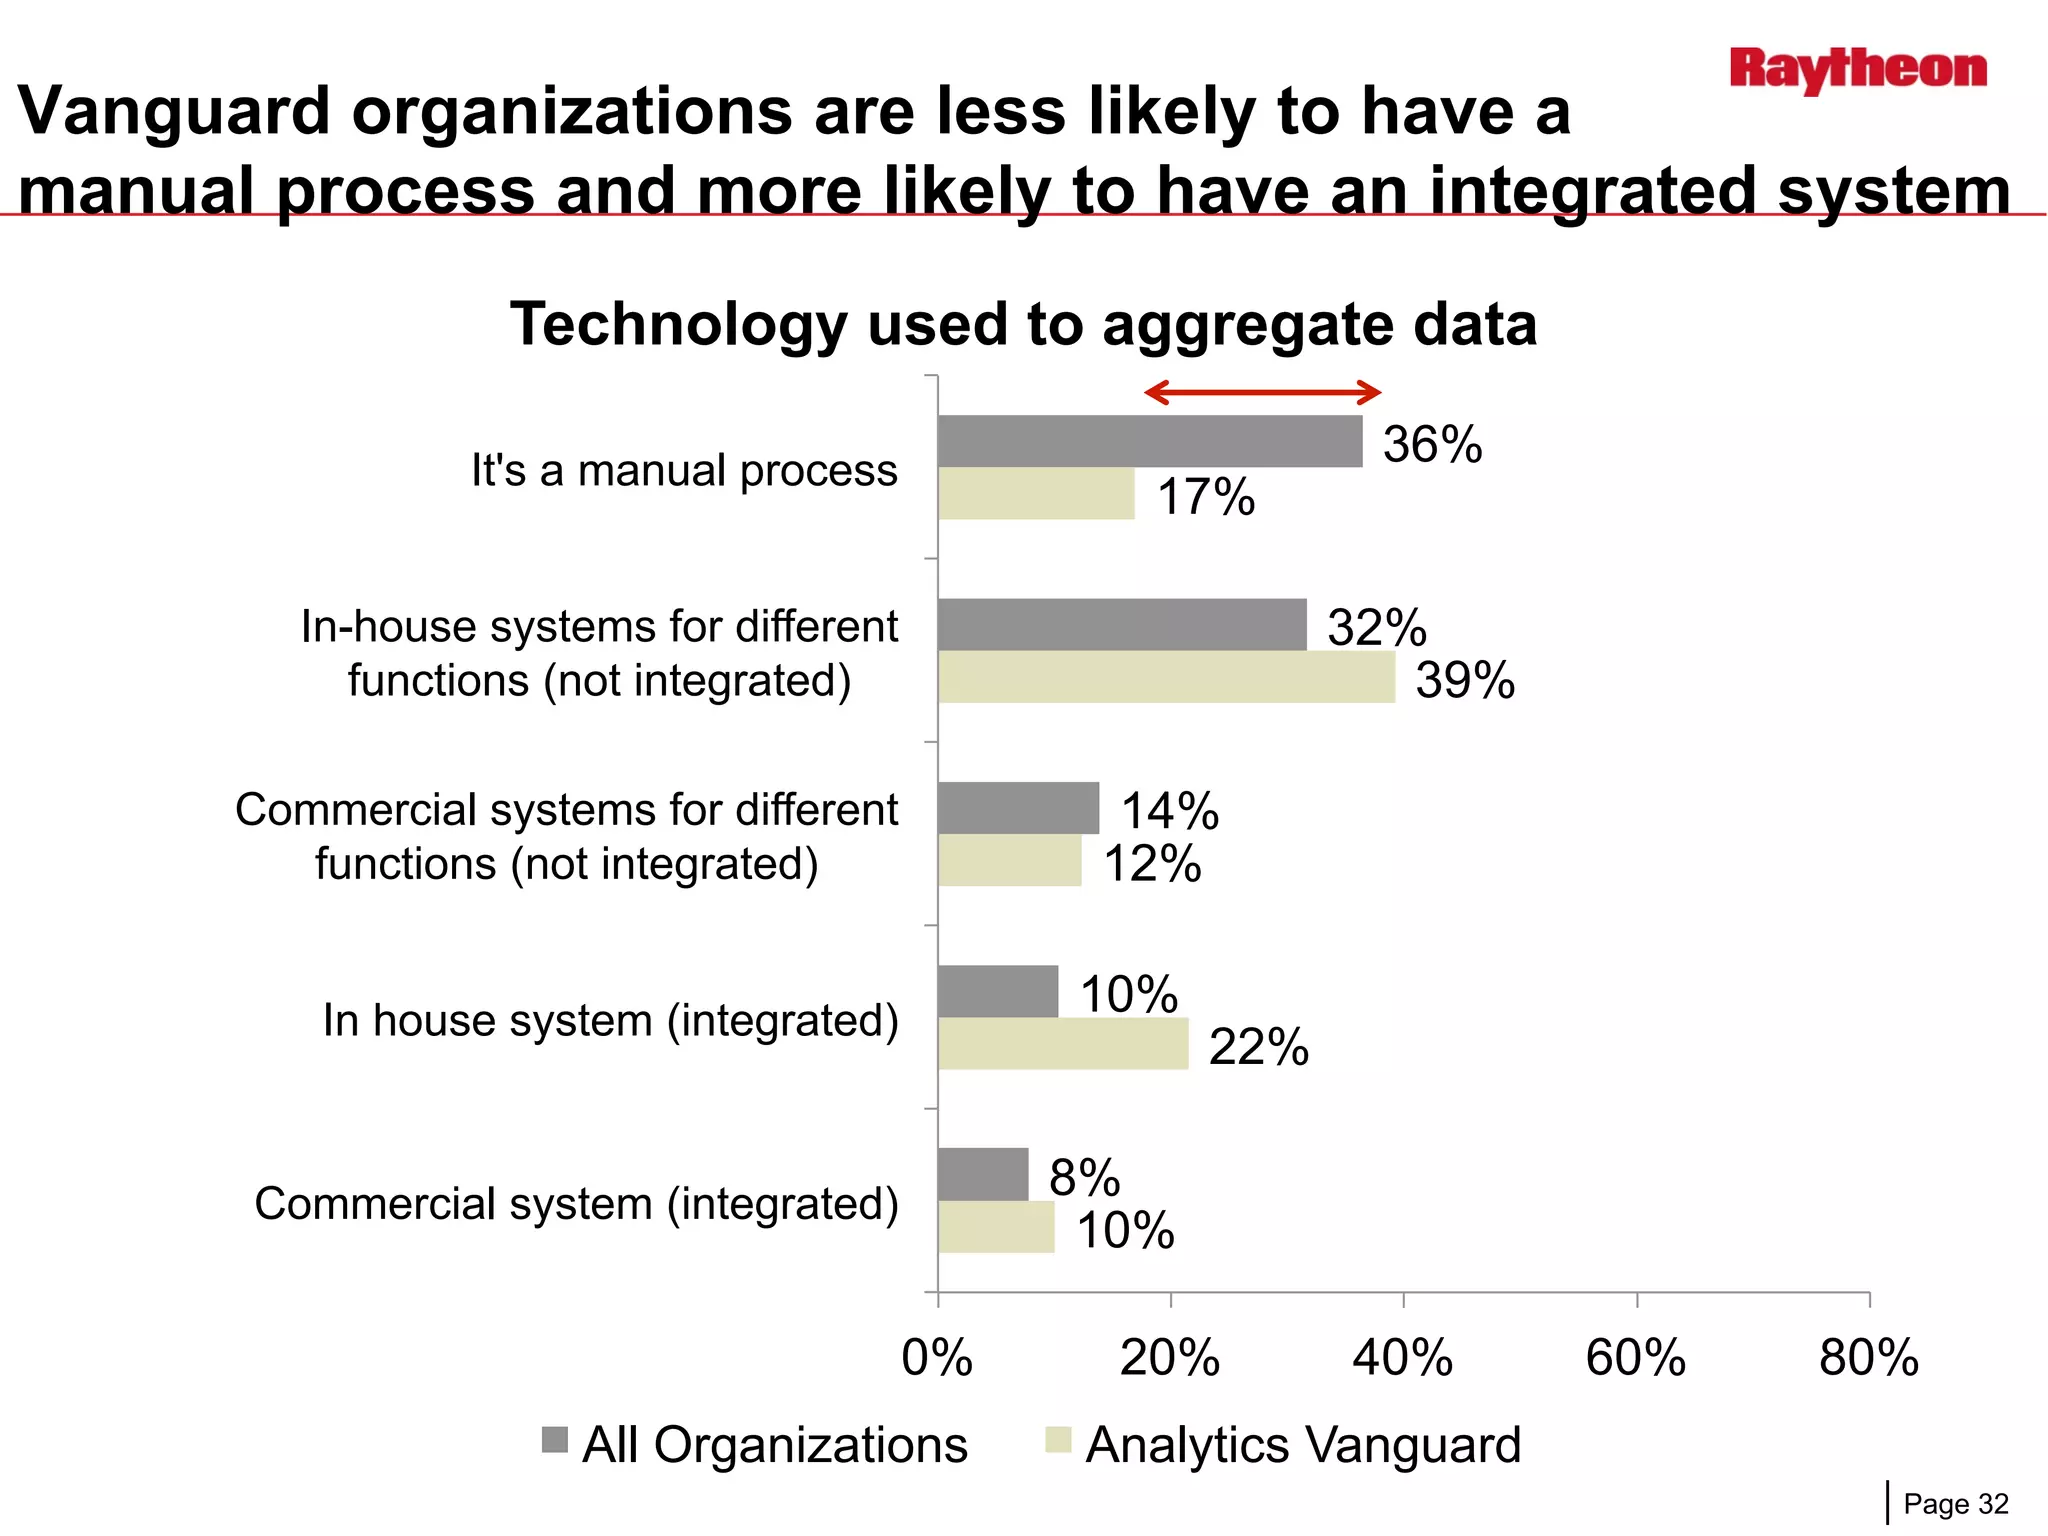
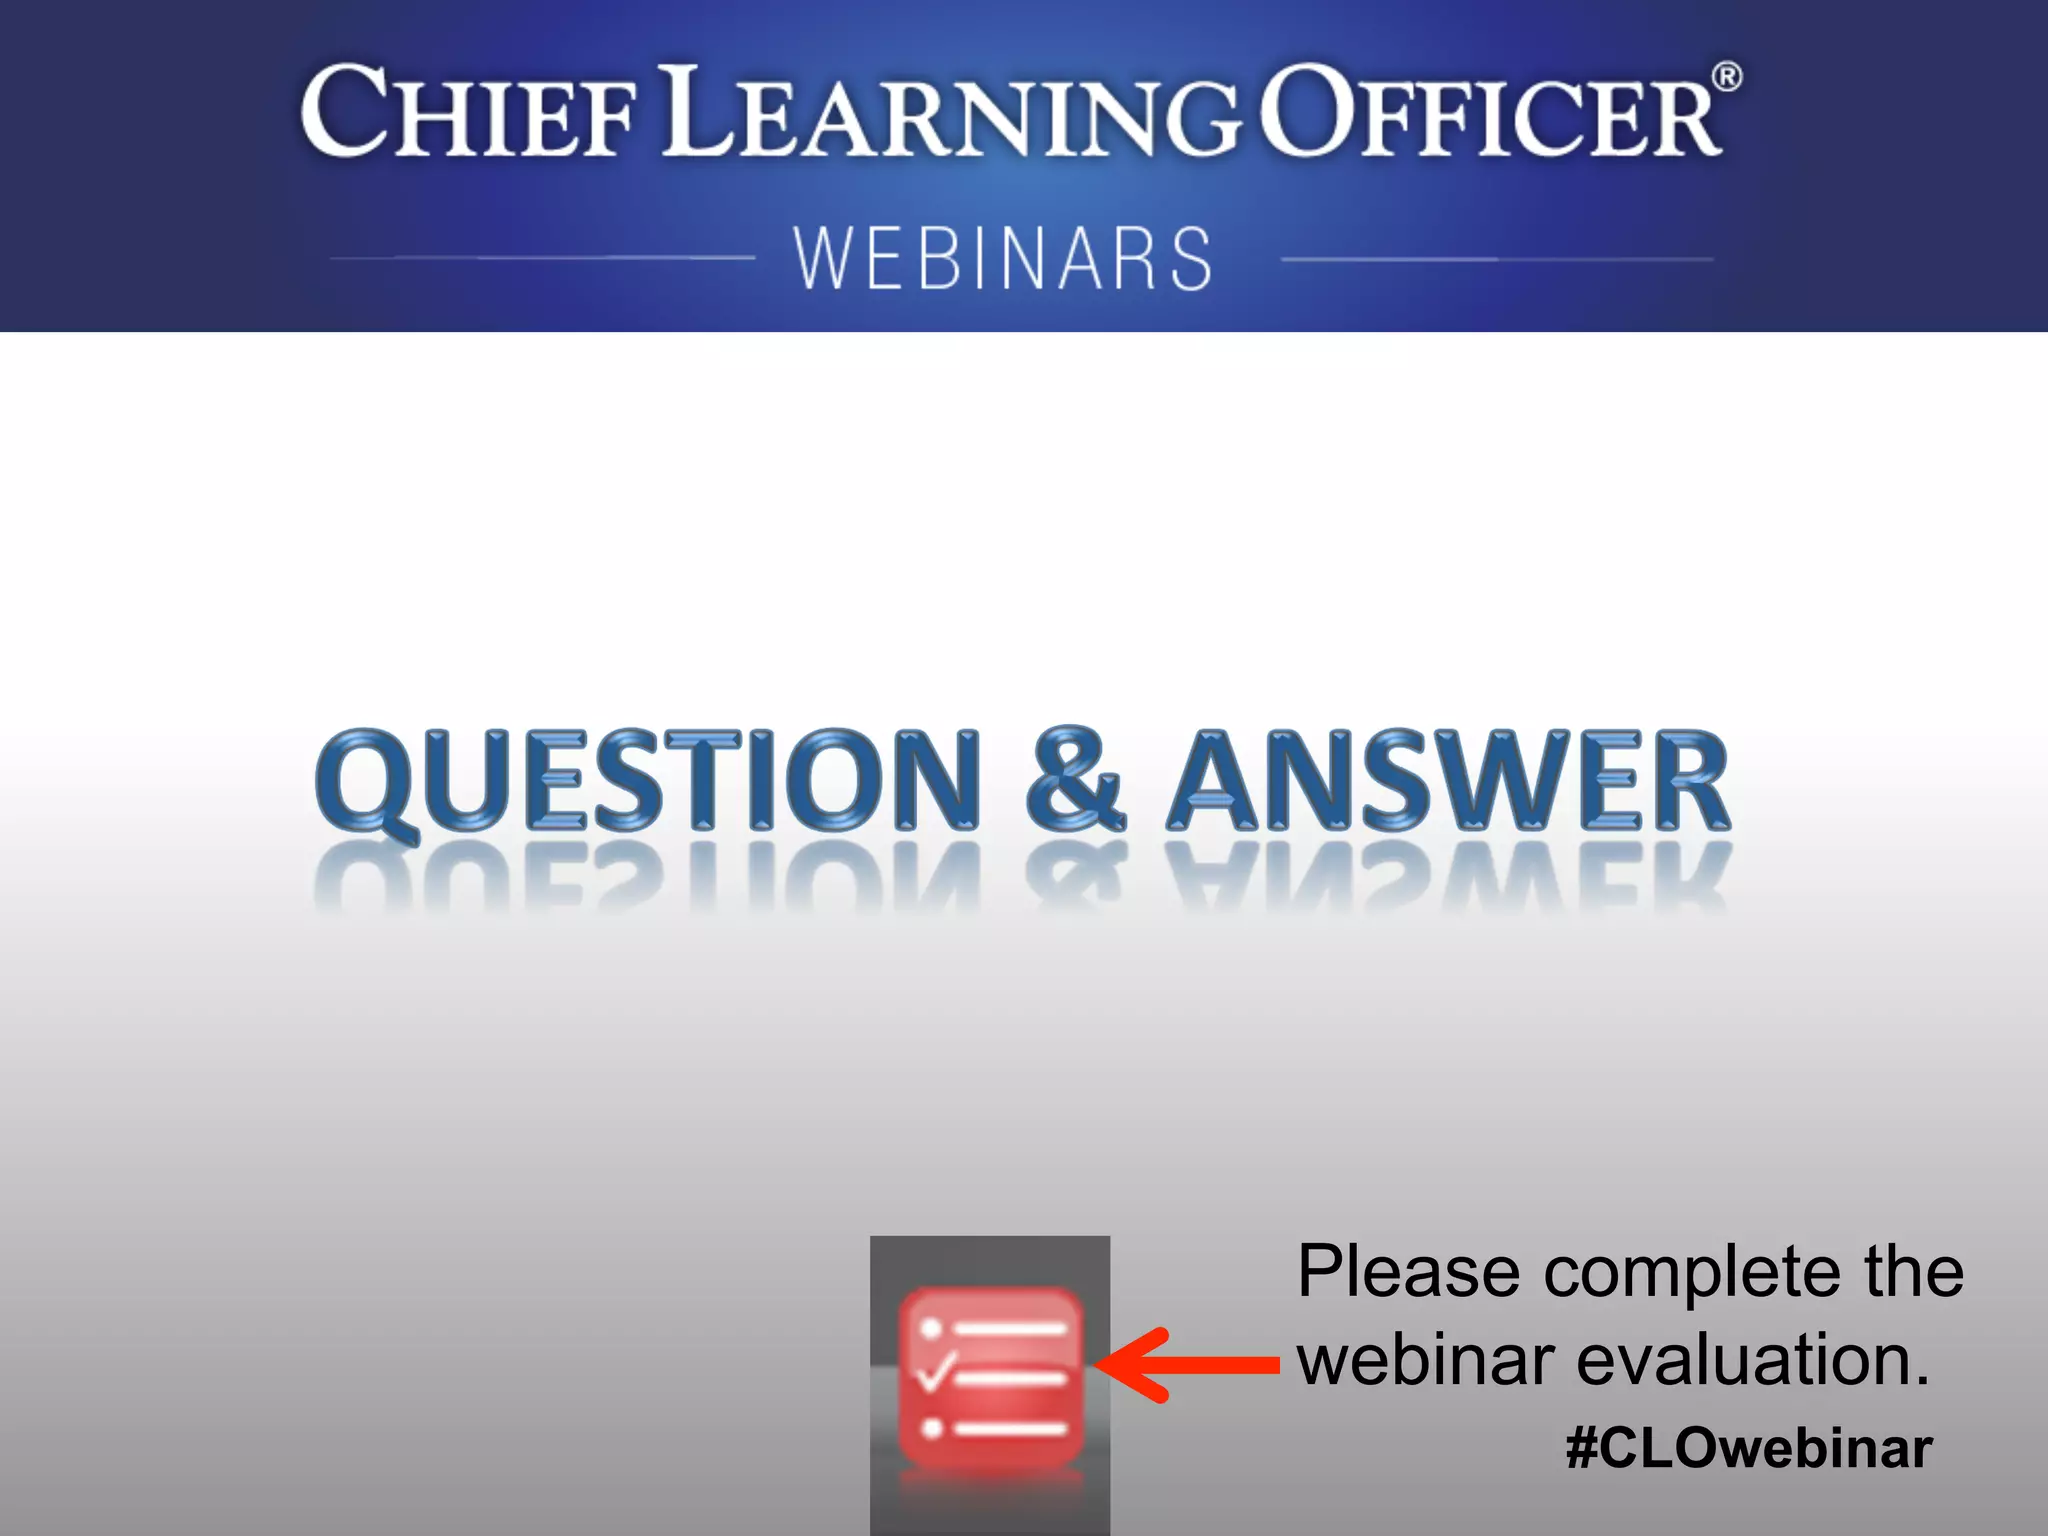
Vanguard use more sources of data and more
business data for analytics
71%
54%
48%
11%
85%
72%
54%
3%
0% 20% 40% 60% 80% 100%
Learning analytics (i.e. course and
curriculum completions, certification
level)
Performance analytics (i.e. business
KPIs [descriptive, diagnostics or
predictive])
HR or talent management analytics
(i.e. attrition, loyalty, education level)
None of the above
Data Sources Used by L&D
All Organizations Analytics Vanguard](https://image.slidesharecdn.com/9-151008150238-lva1-app6892/75/Unleashing-the-Power-of-Analytics-Driving-Performance-at-the-Intersection-of-Learning-and-Business-24-2048.jpg)


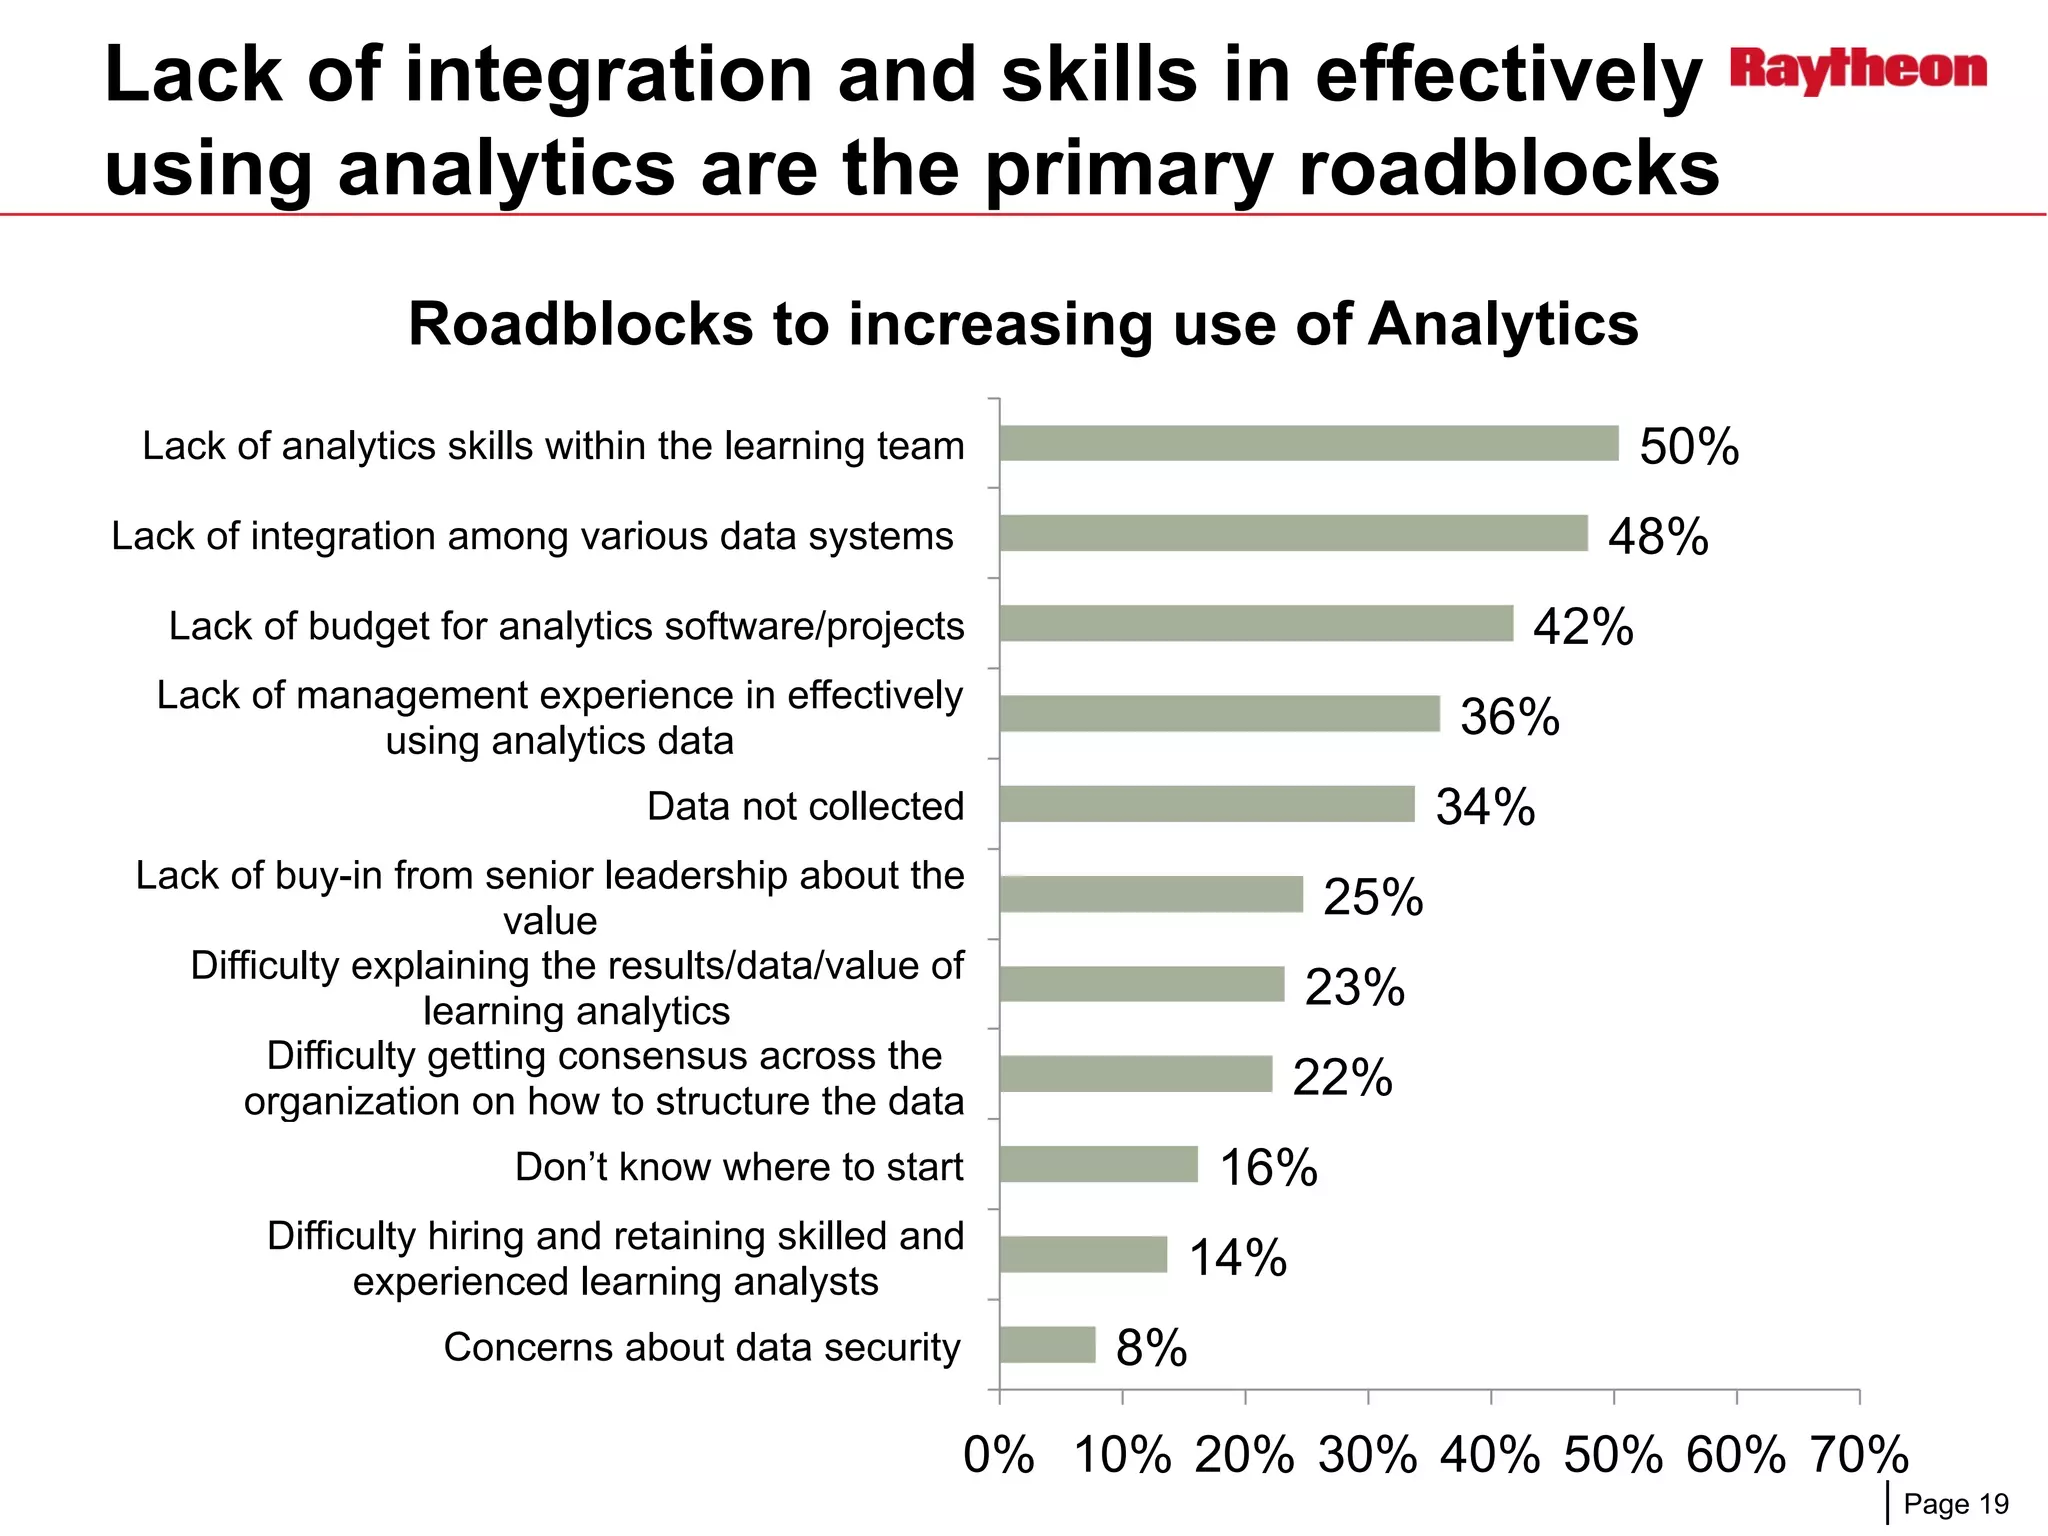
The document outlines insights from a webinar focusing on the role of analytics in learning and development (L&D) and its potential to drive business performance. It highlights the current landscape of learning analytics, the challenges organizations face in integrating and utilizing analytics effectively, and the future direction expected for analytics capabilities. Key findings suggest a substantial increase in organizations planning to enhance their learning analytics capabilities within the next two years, despite existing roadblocks such as lack of skills and integration.


