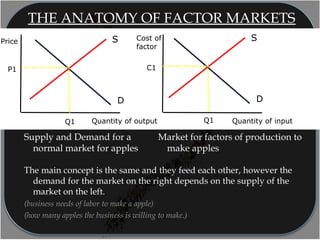
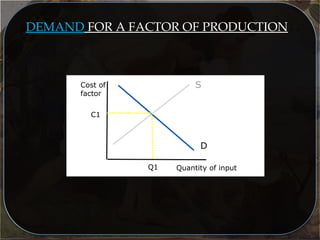
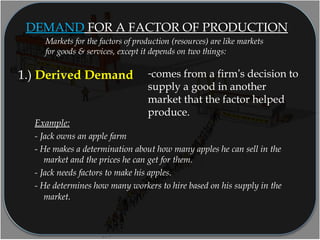
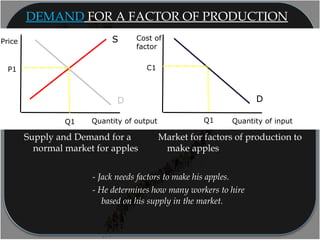
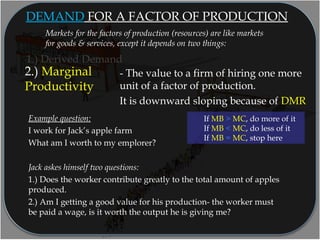
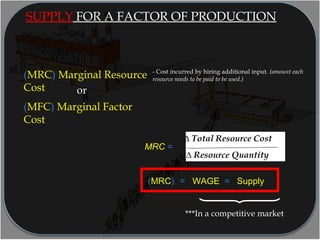
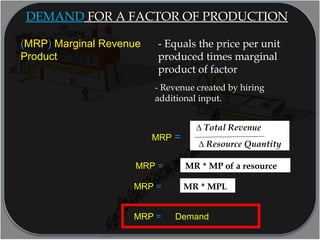
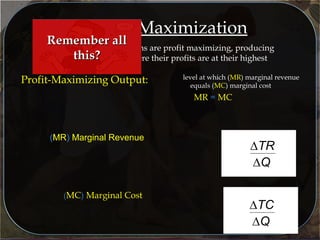
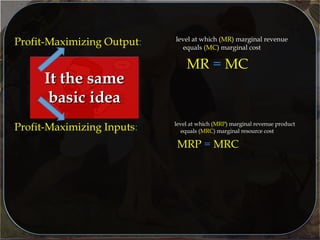
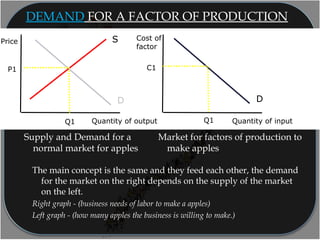
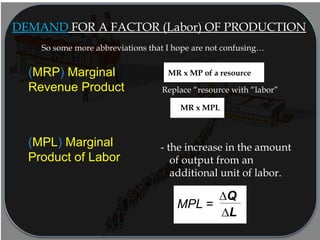
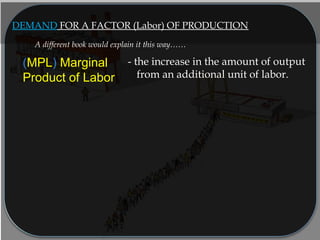
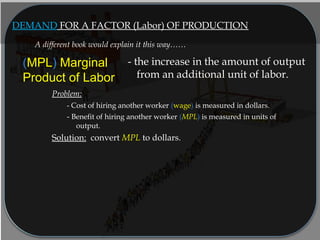
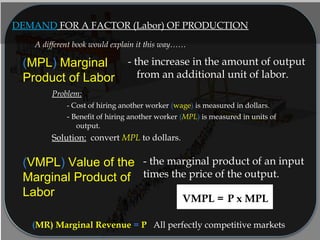
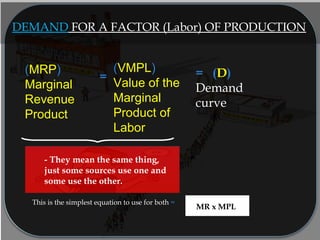
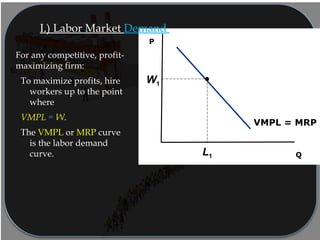
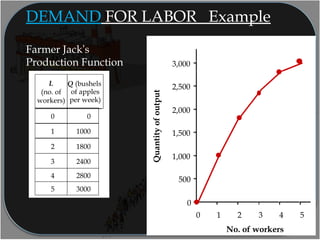
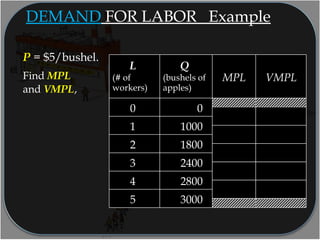
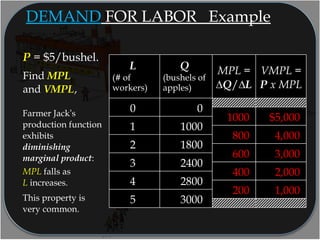
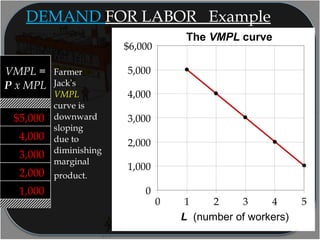
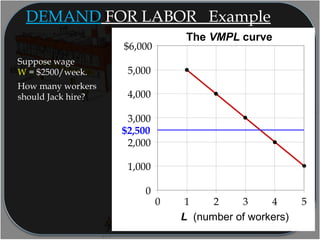
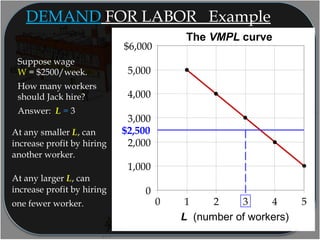
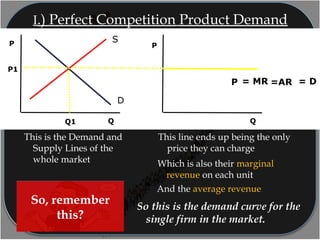
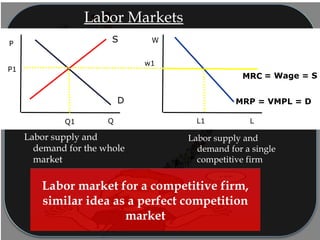
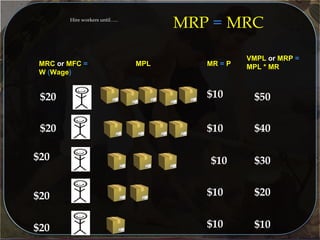
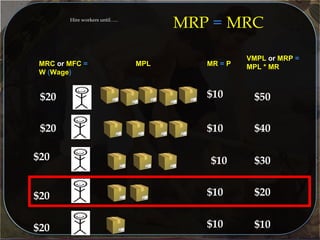
- Labor markets can be analyzed using supply and demand models. The demand for labor is derived from the demand for the firm's product and depends on the marginal productivity of labor. Firms will hire labor up to the point where the marginal revenue product of labor (MRP) equals the marginal cost of labor (wage).
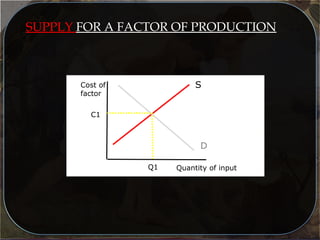
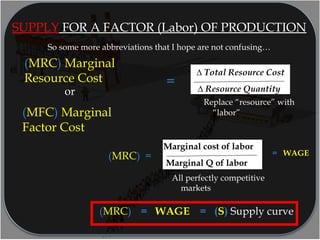
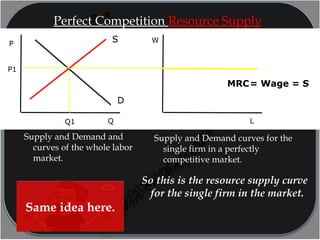
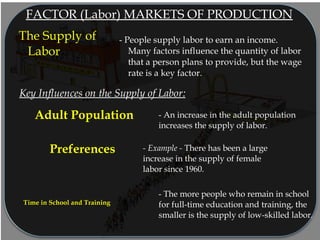
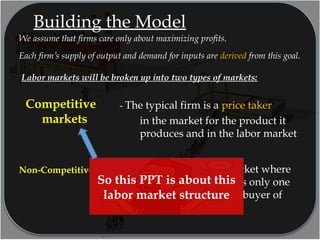
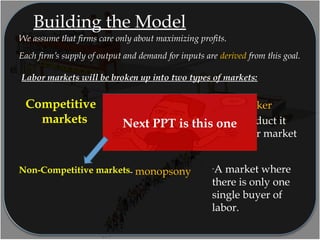
- The labor supply depends on various factors like the adult population, preferences, and time spent in school. Individuals supply labor to earn income, and the quantity supplied increases with higher wages. In competitive labor markets, firms are price takers and pay the market wage rate.