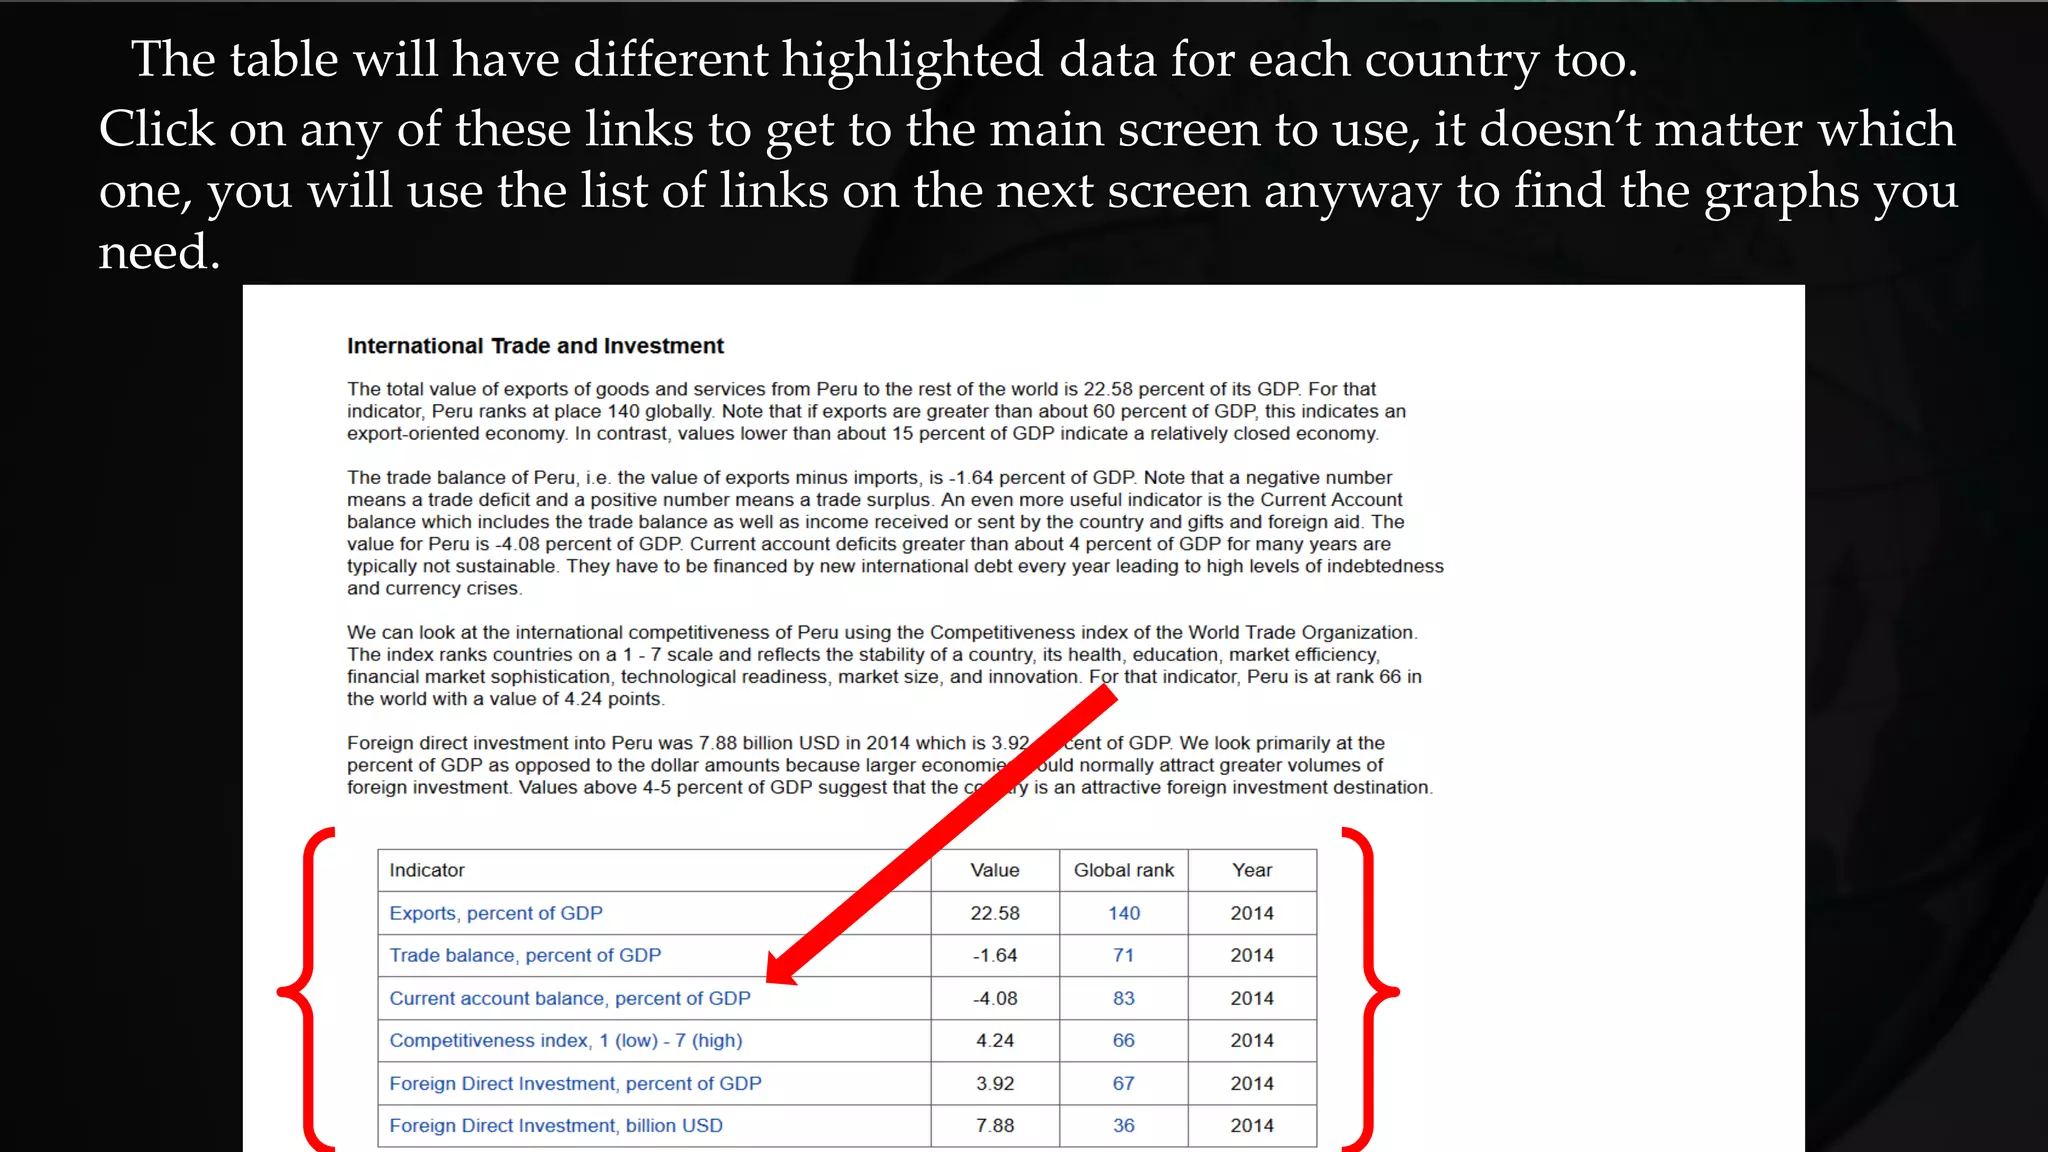
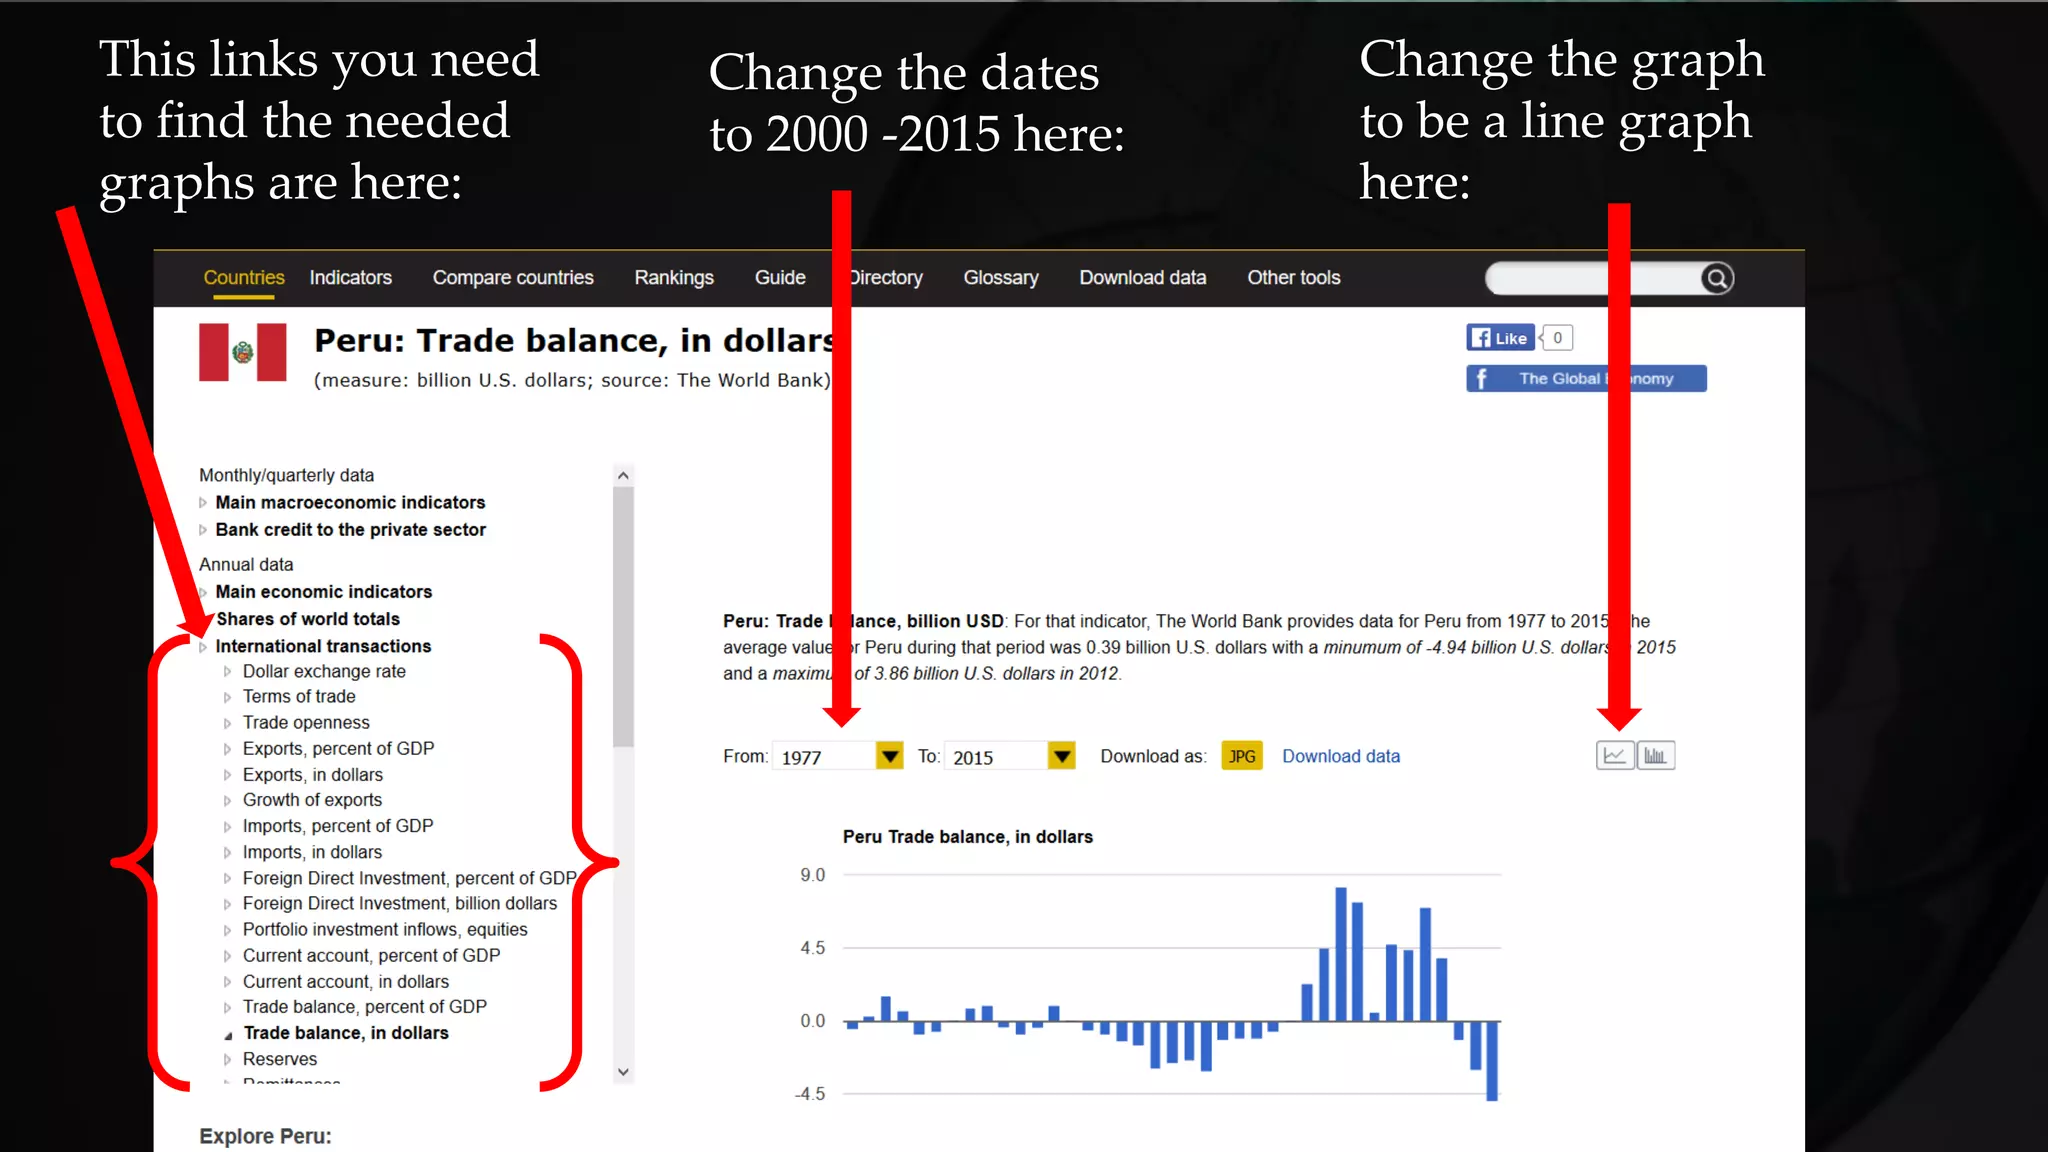
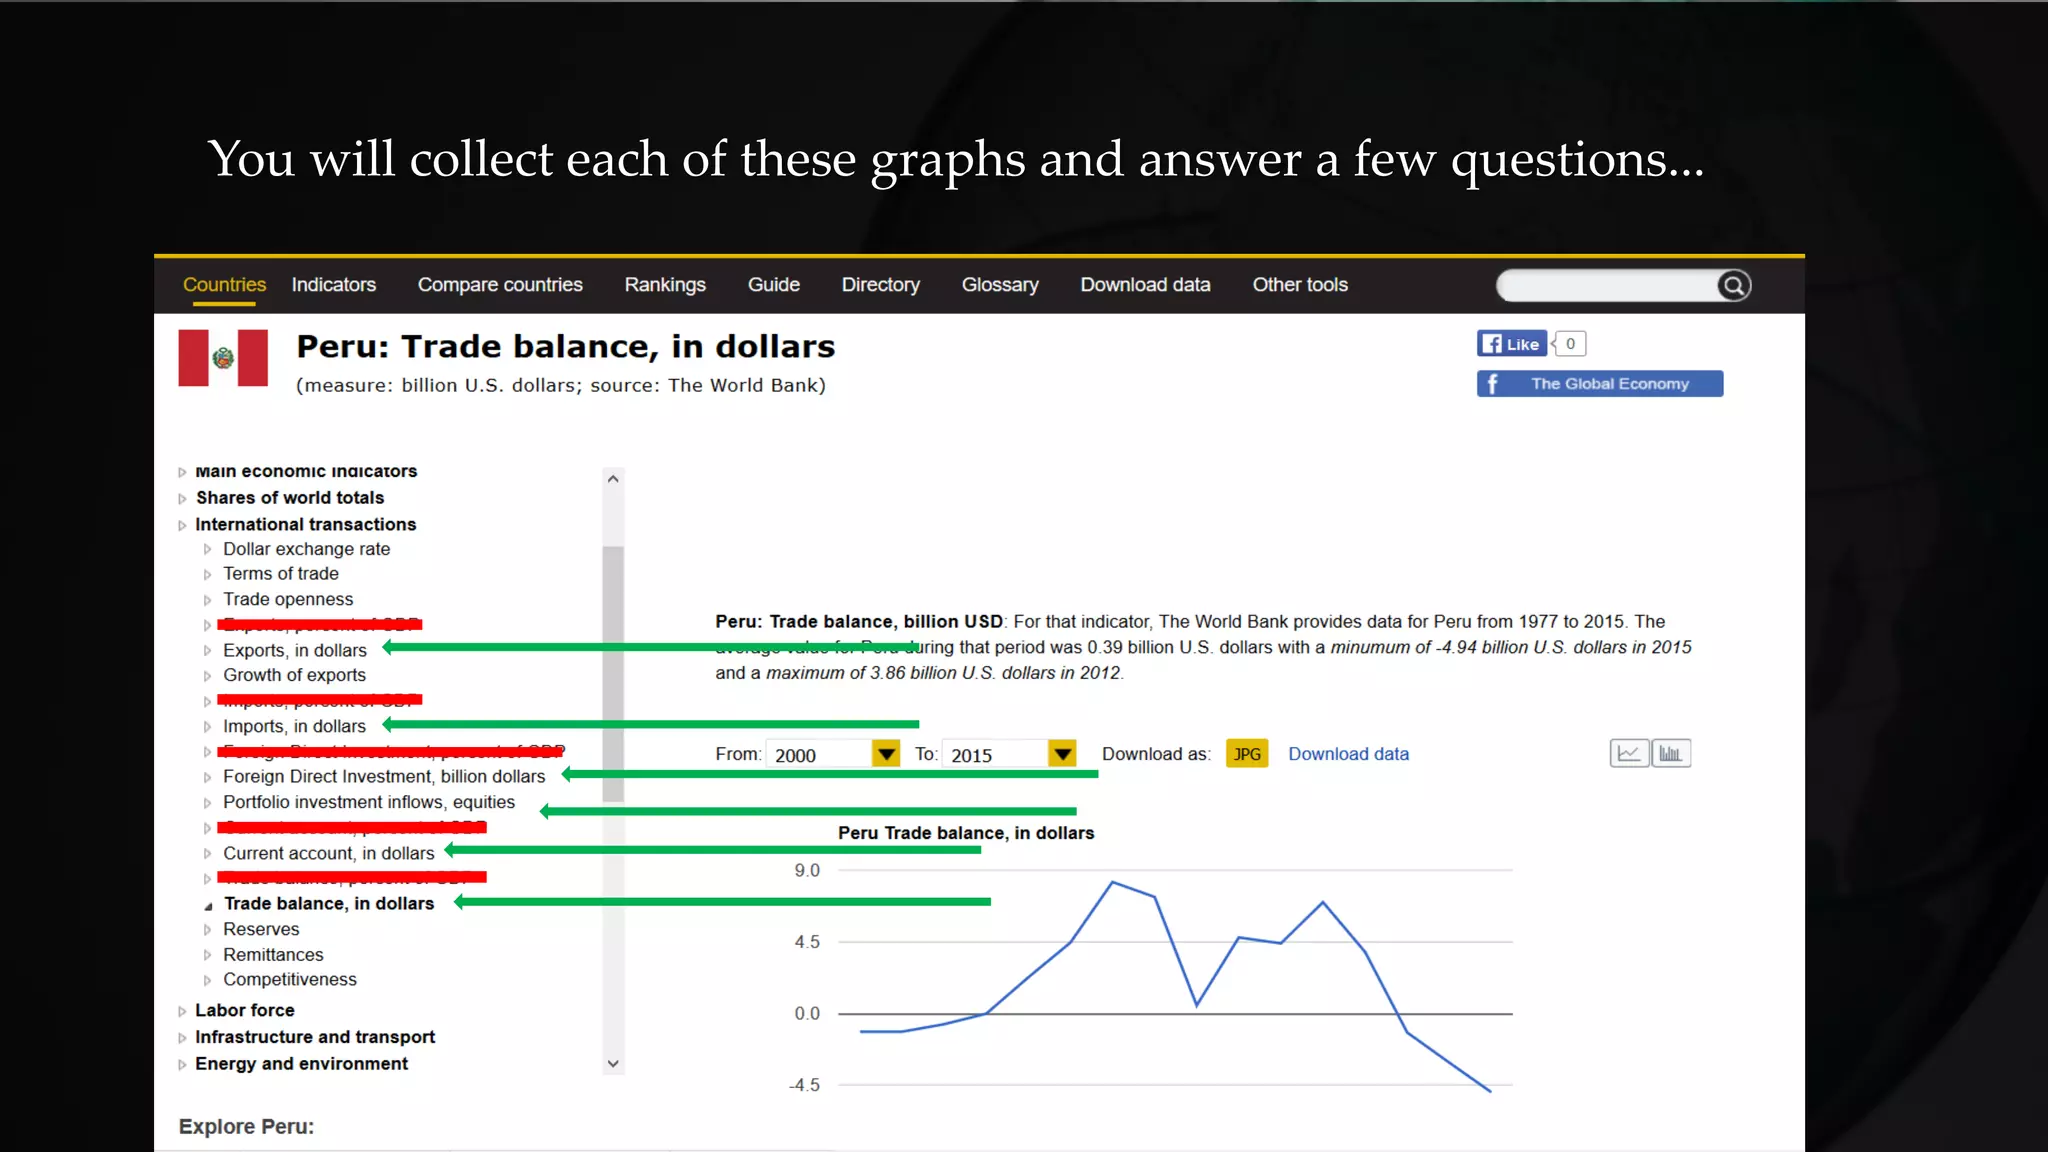
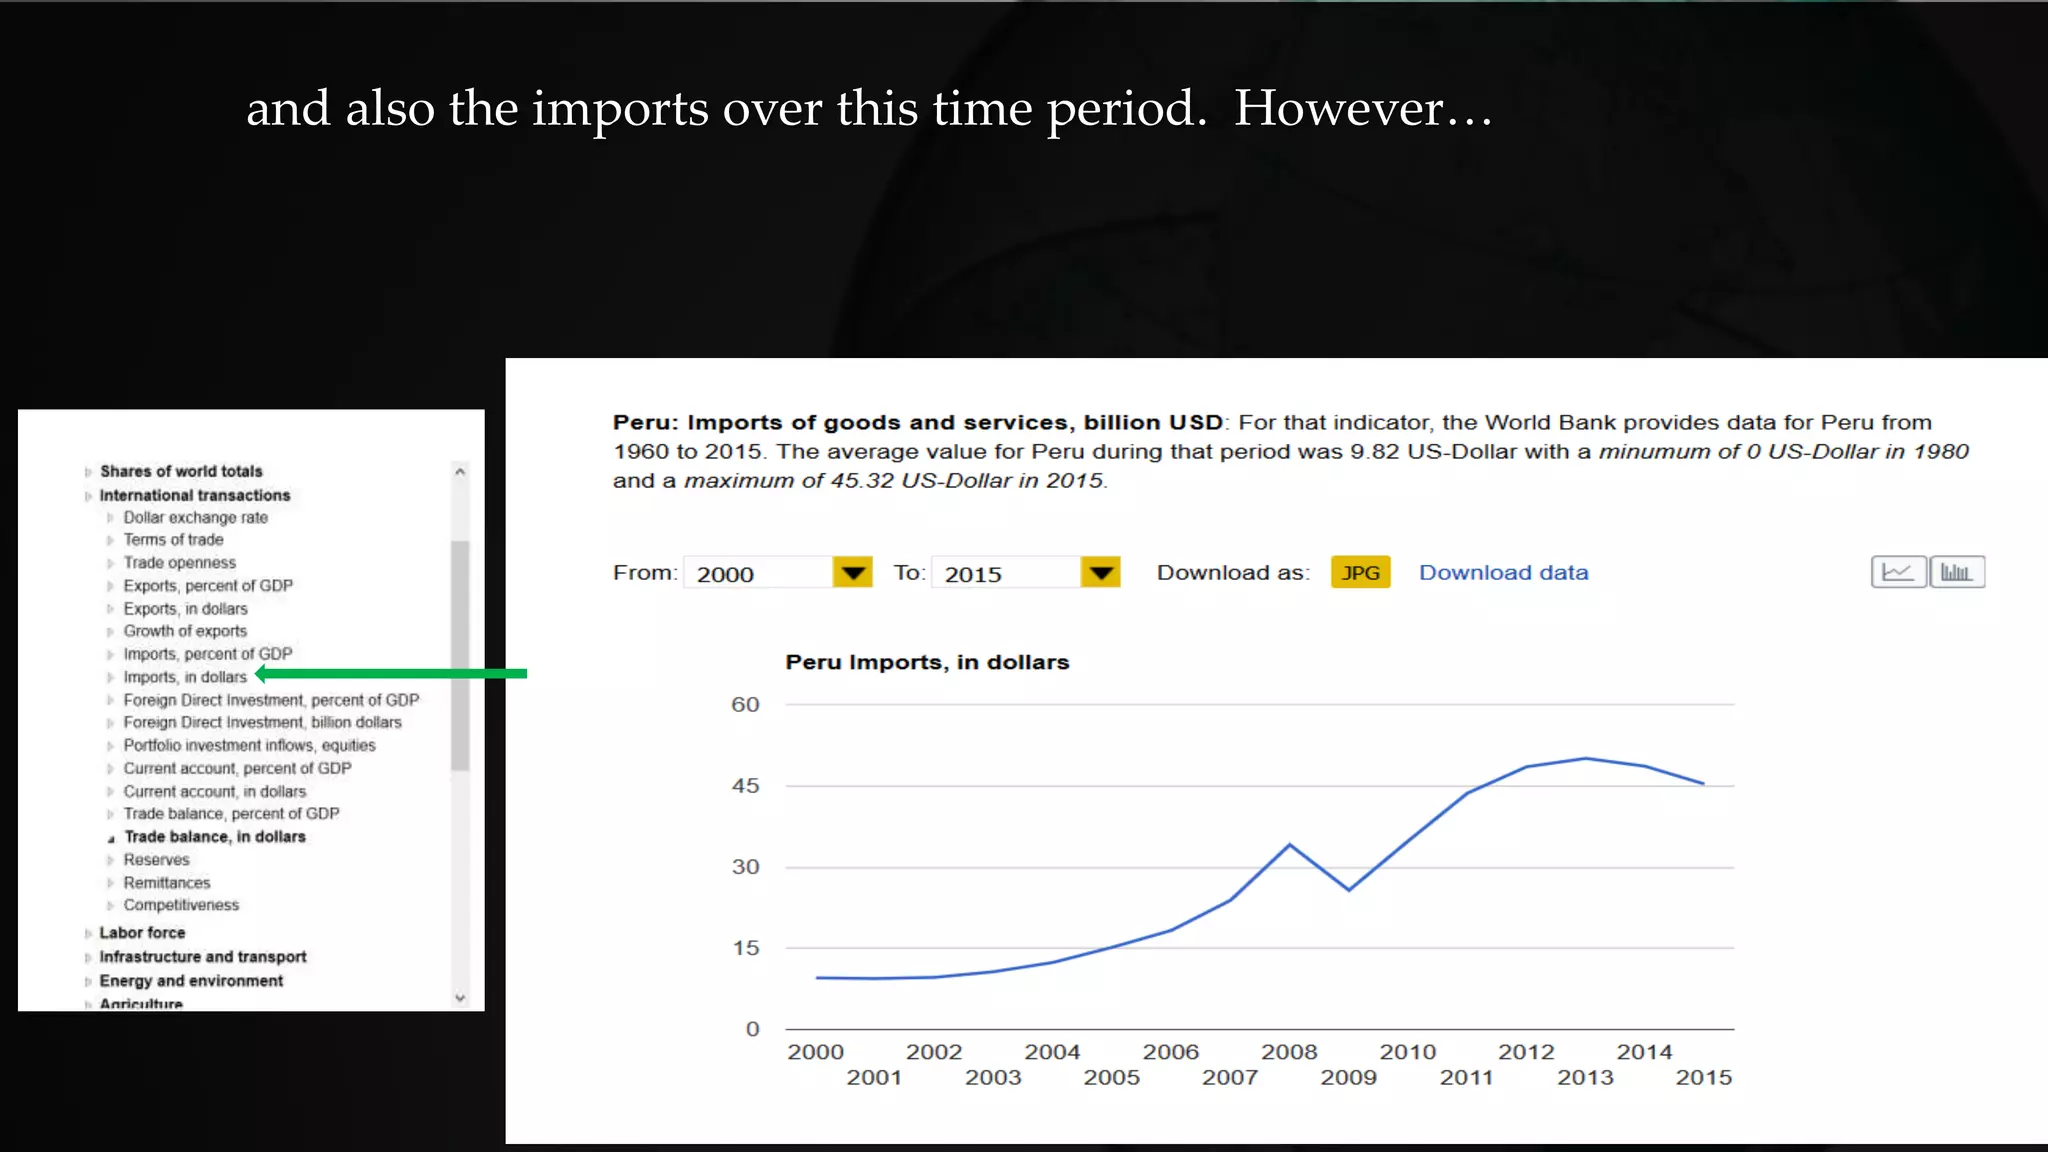
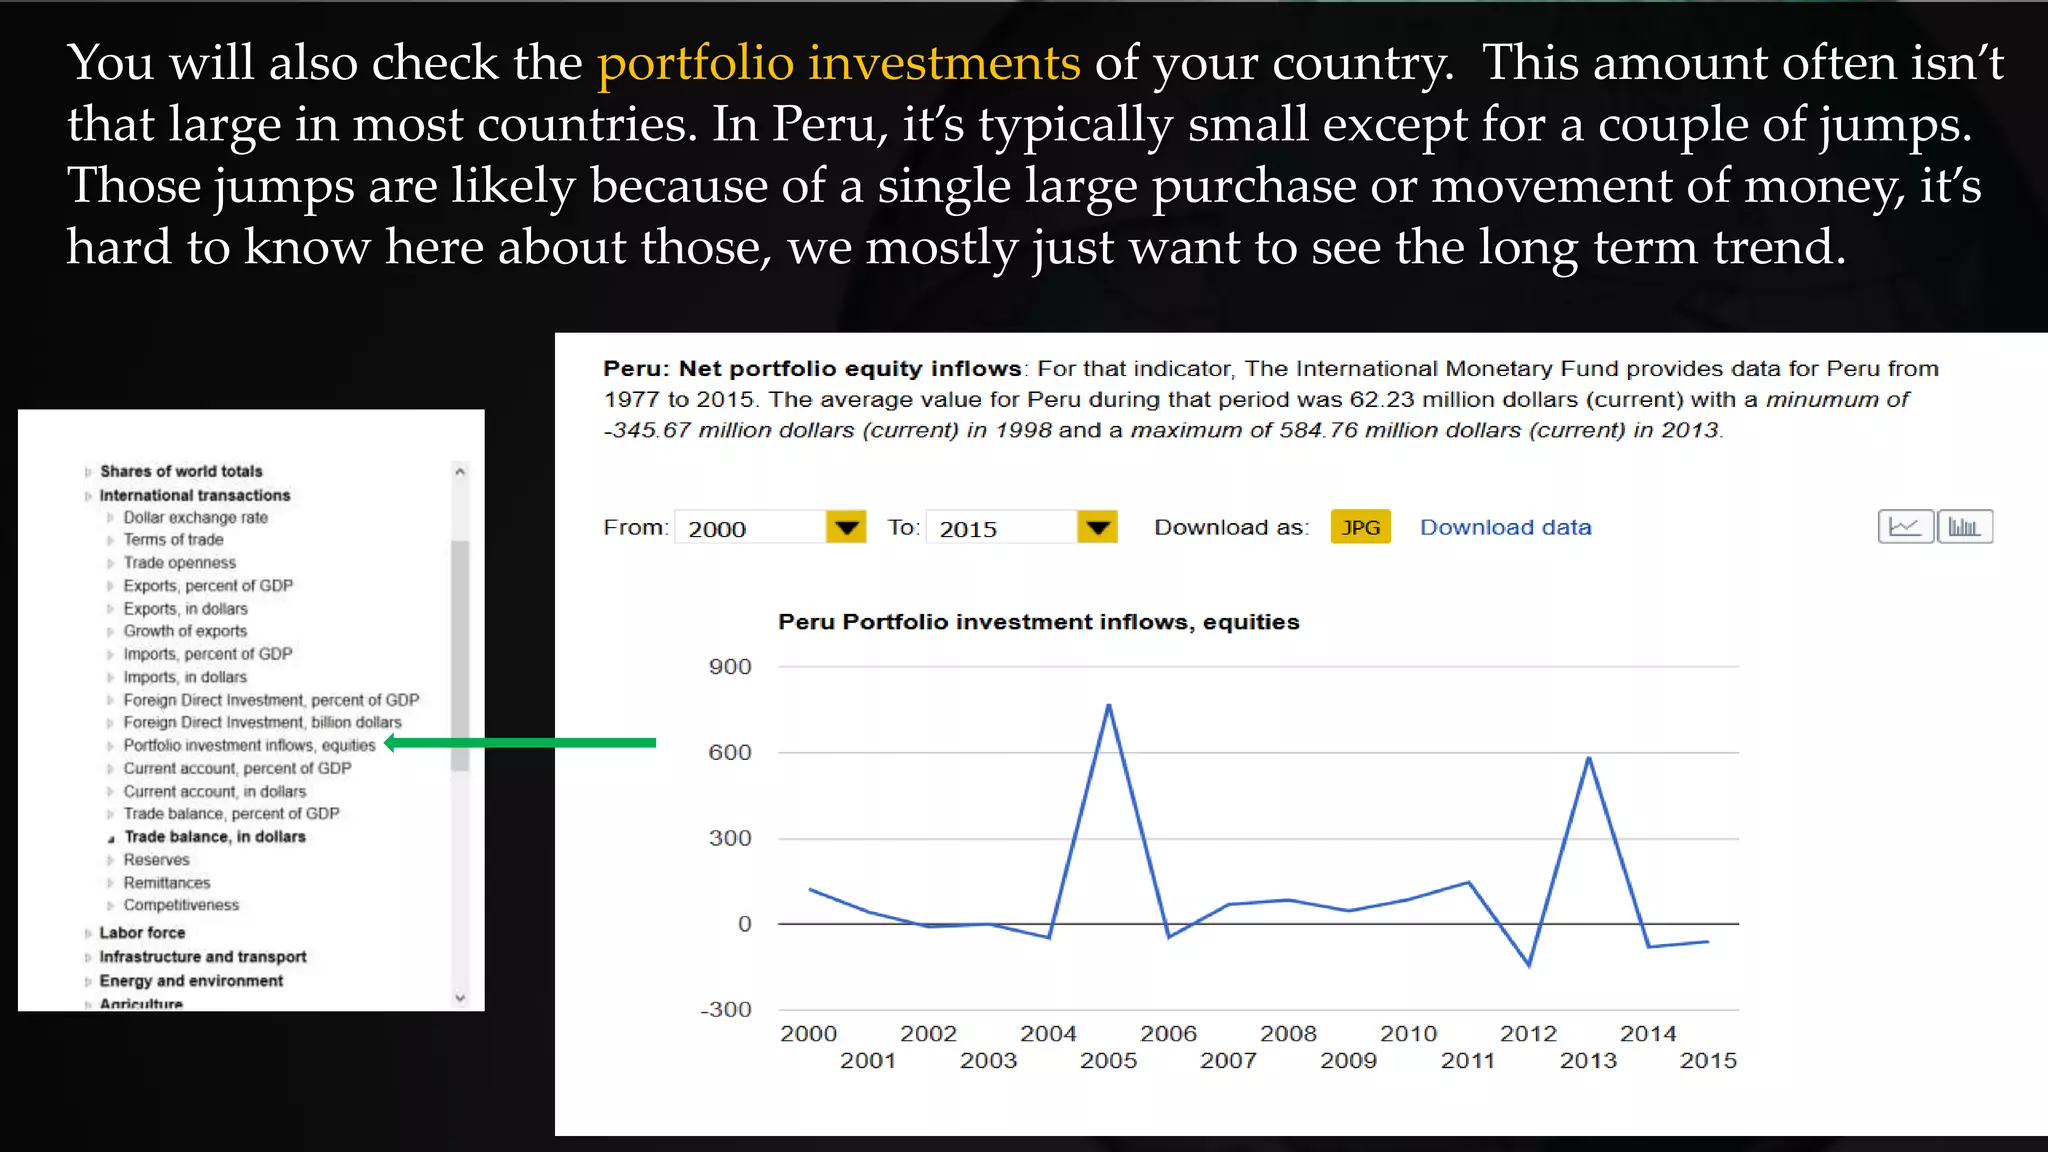
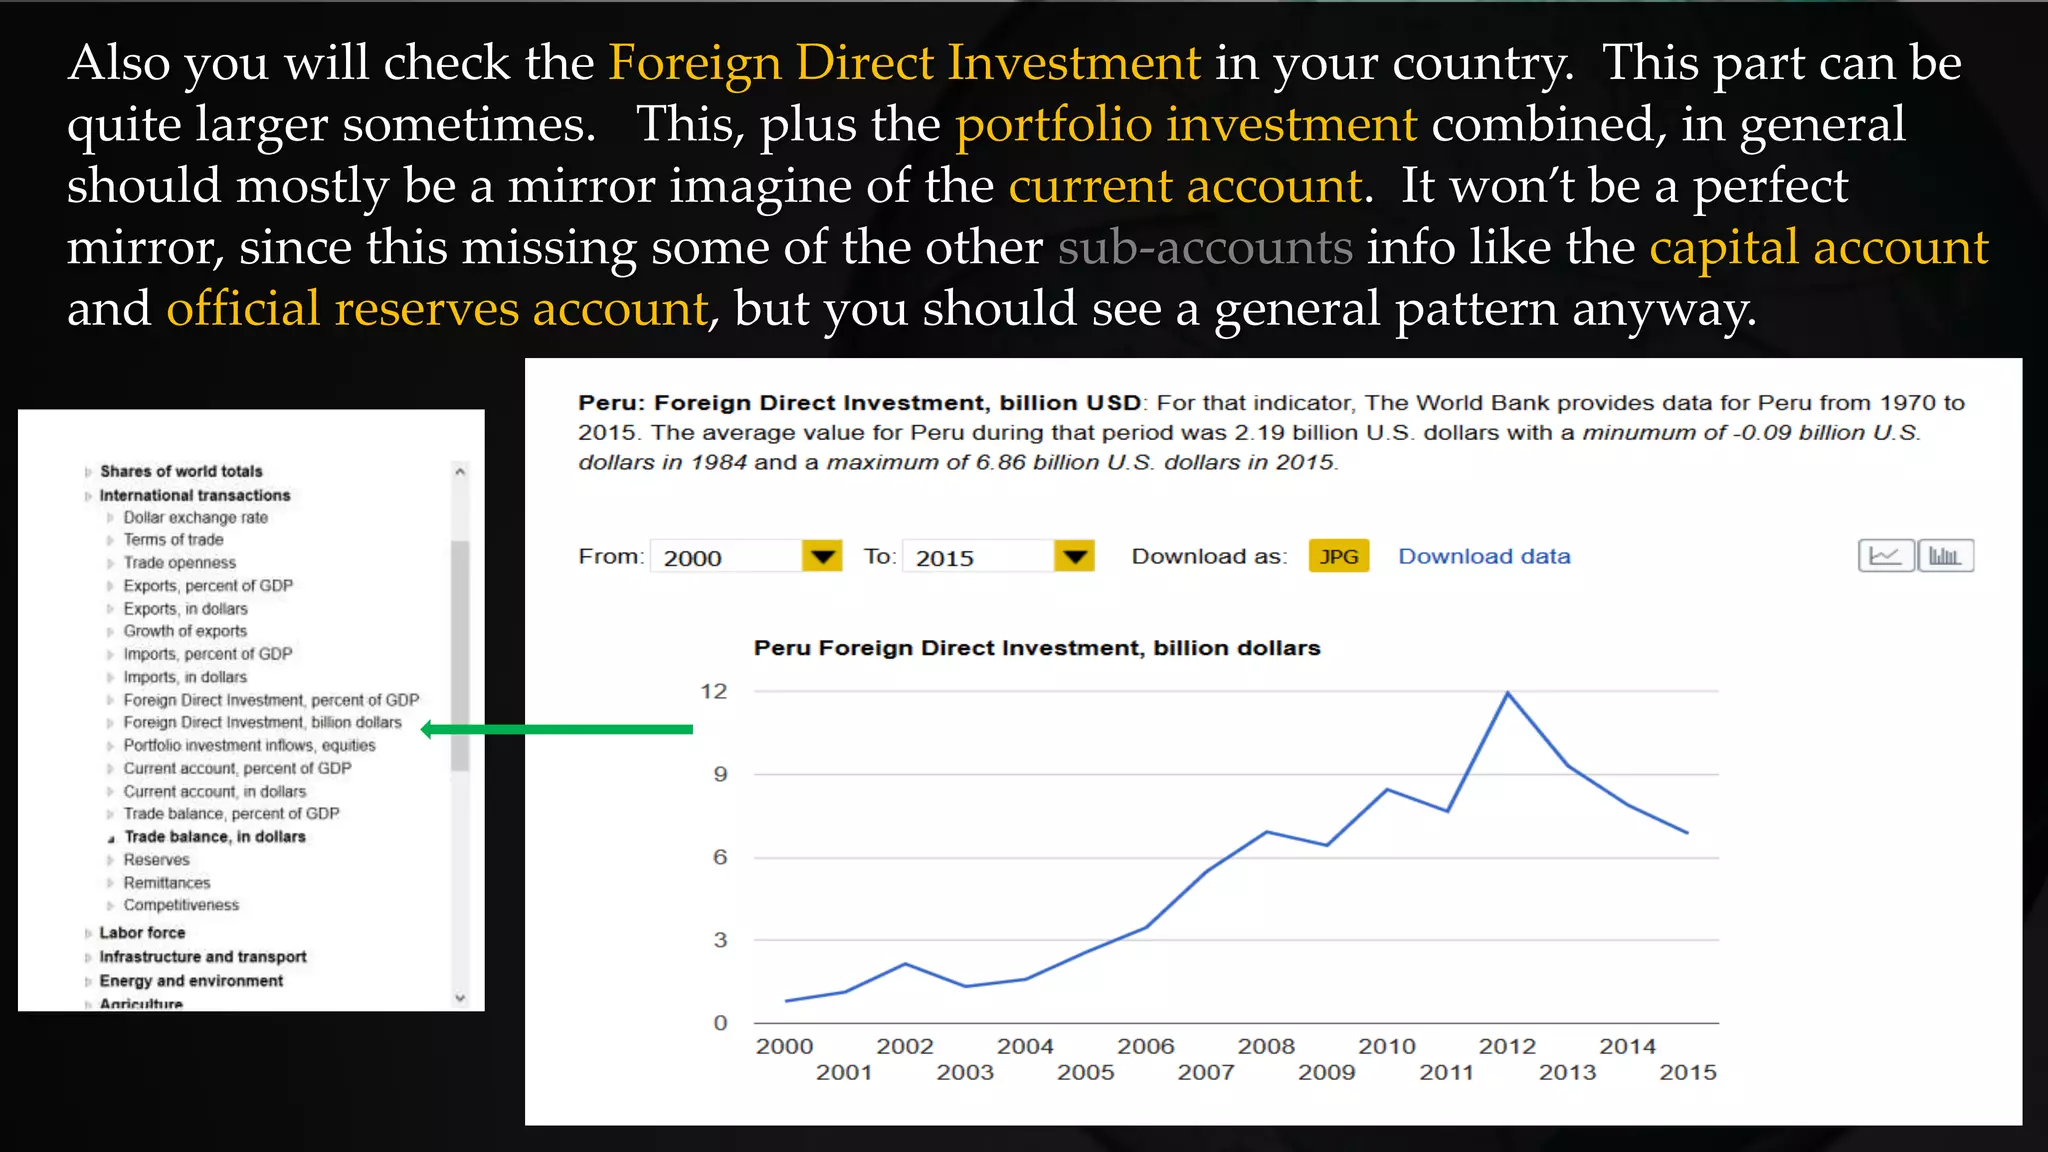
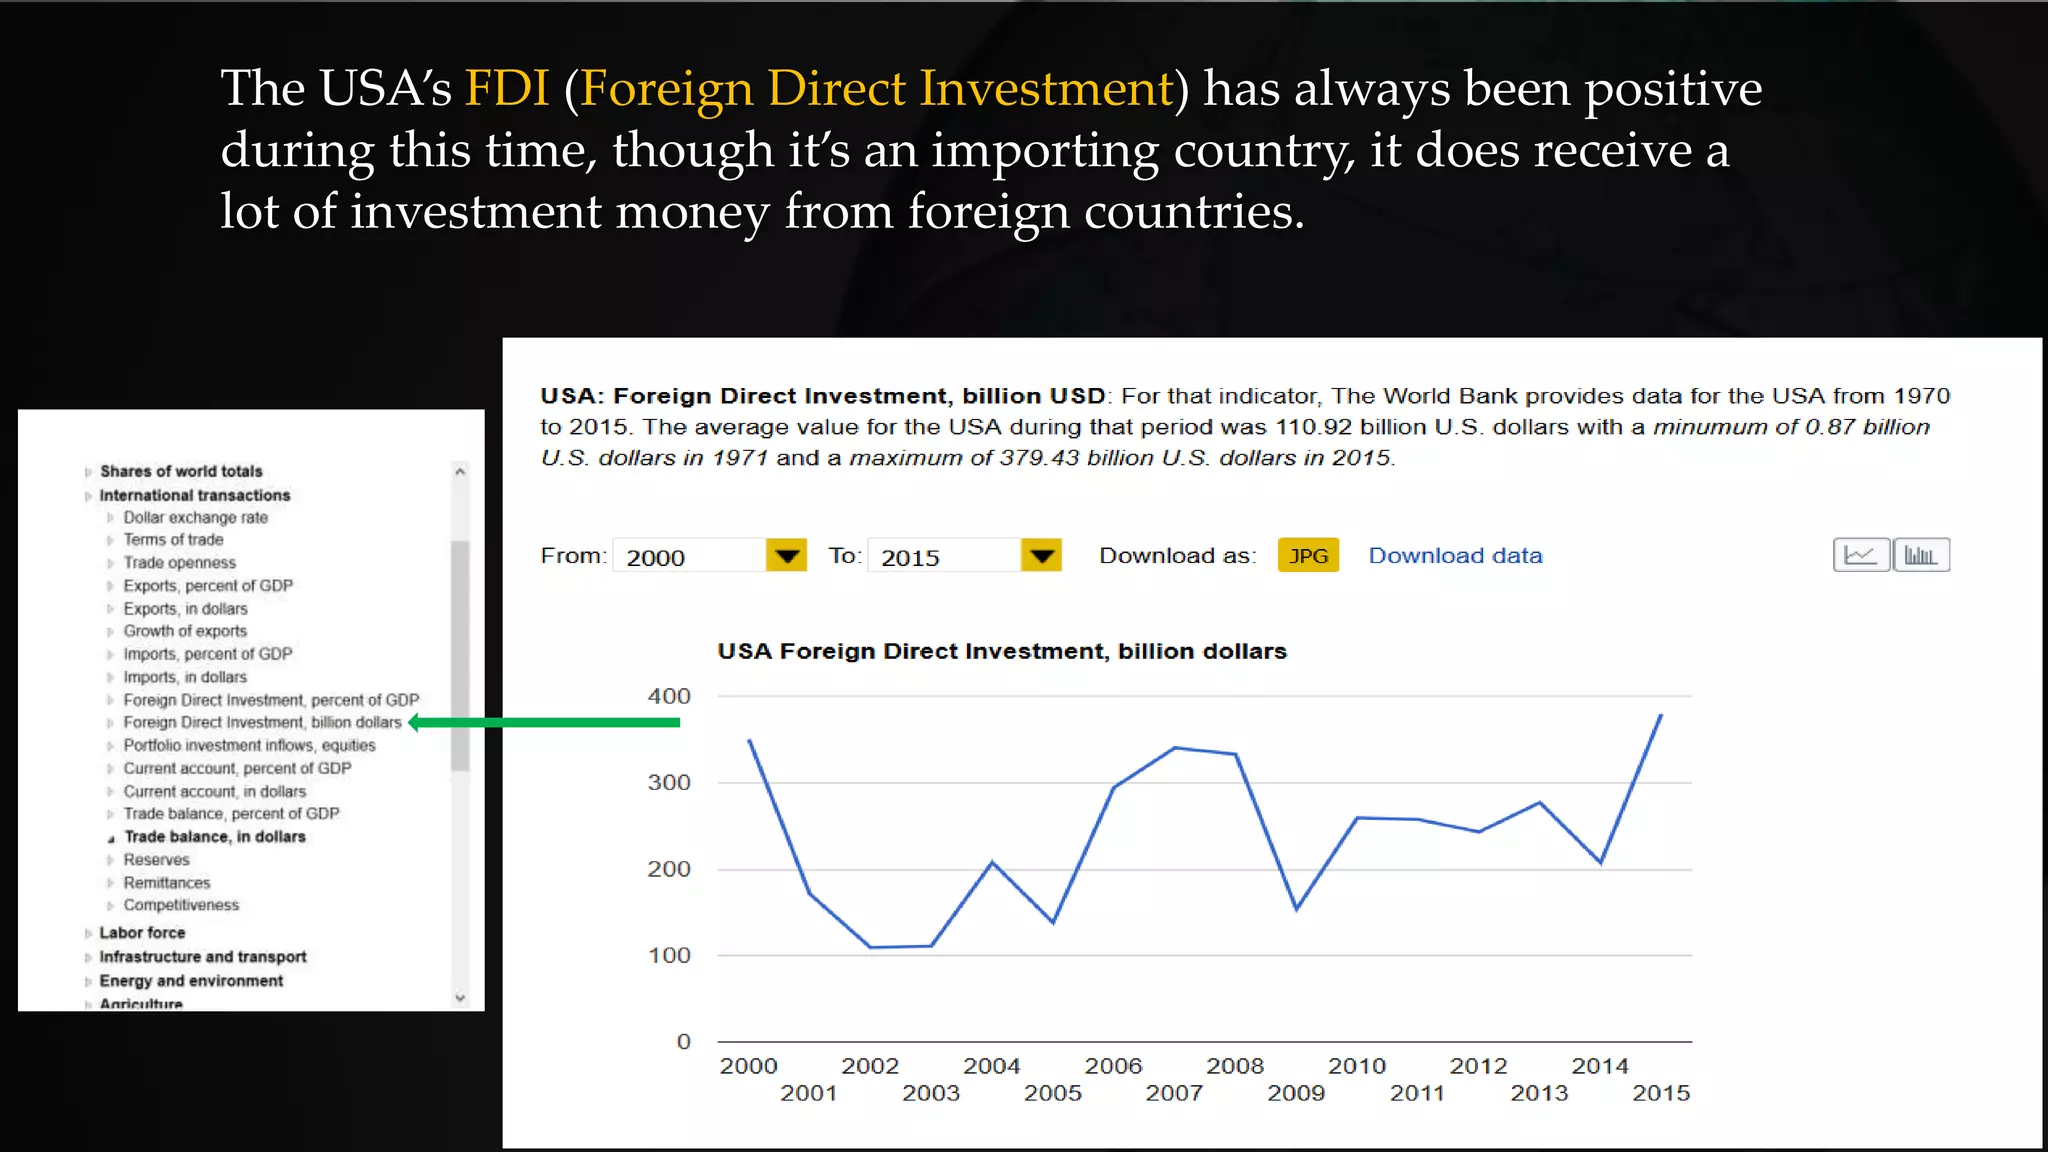
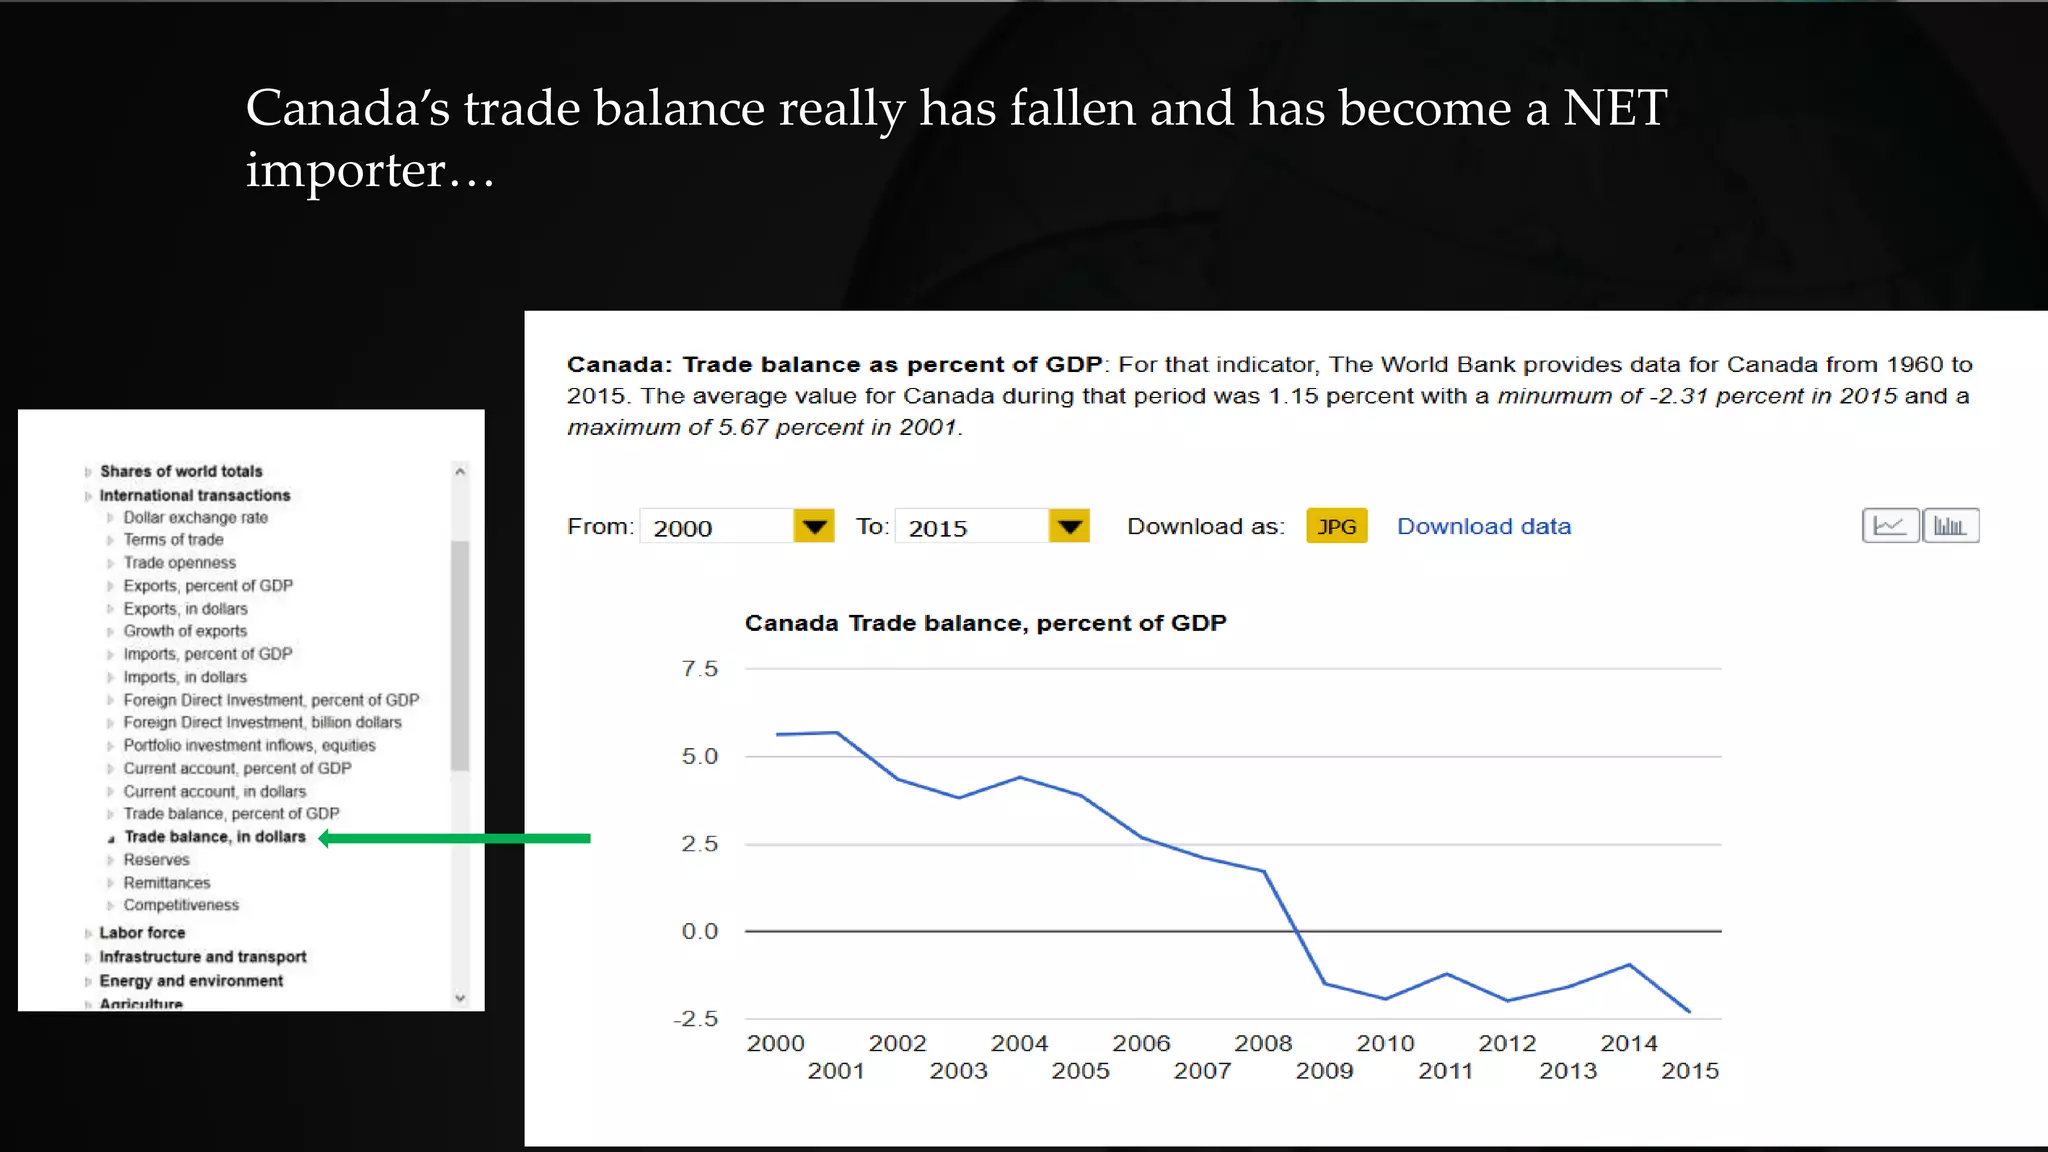
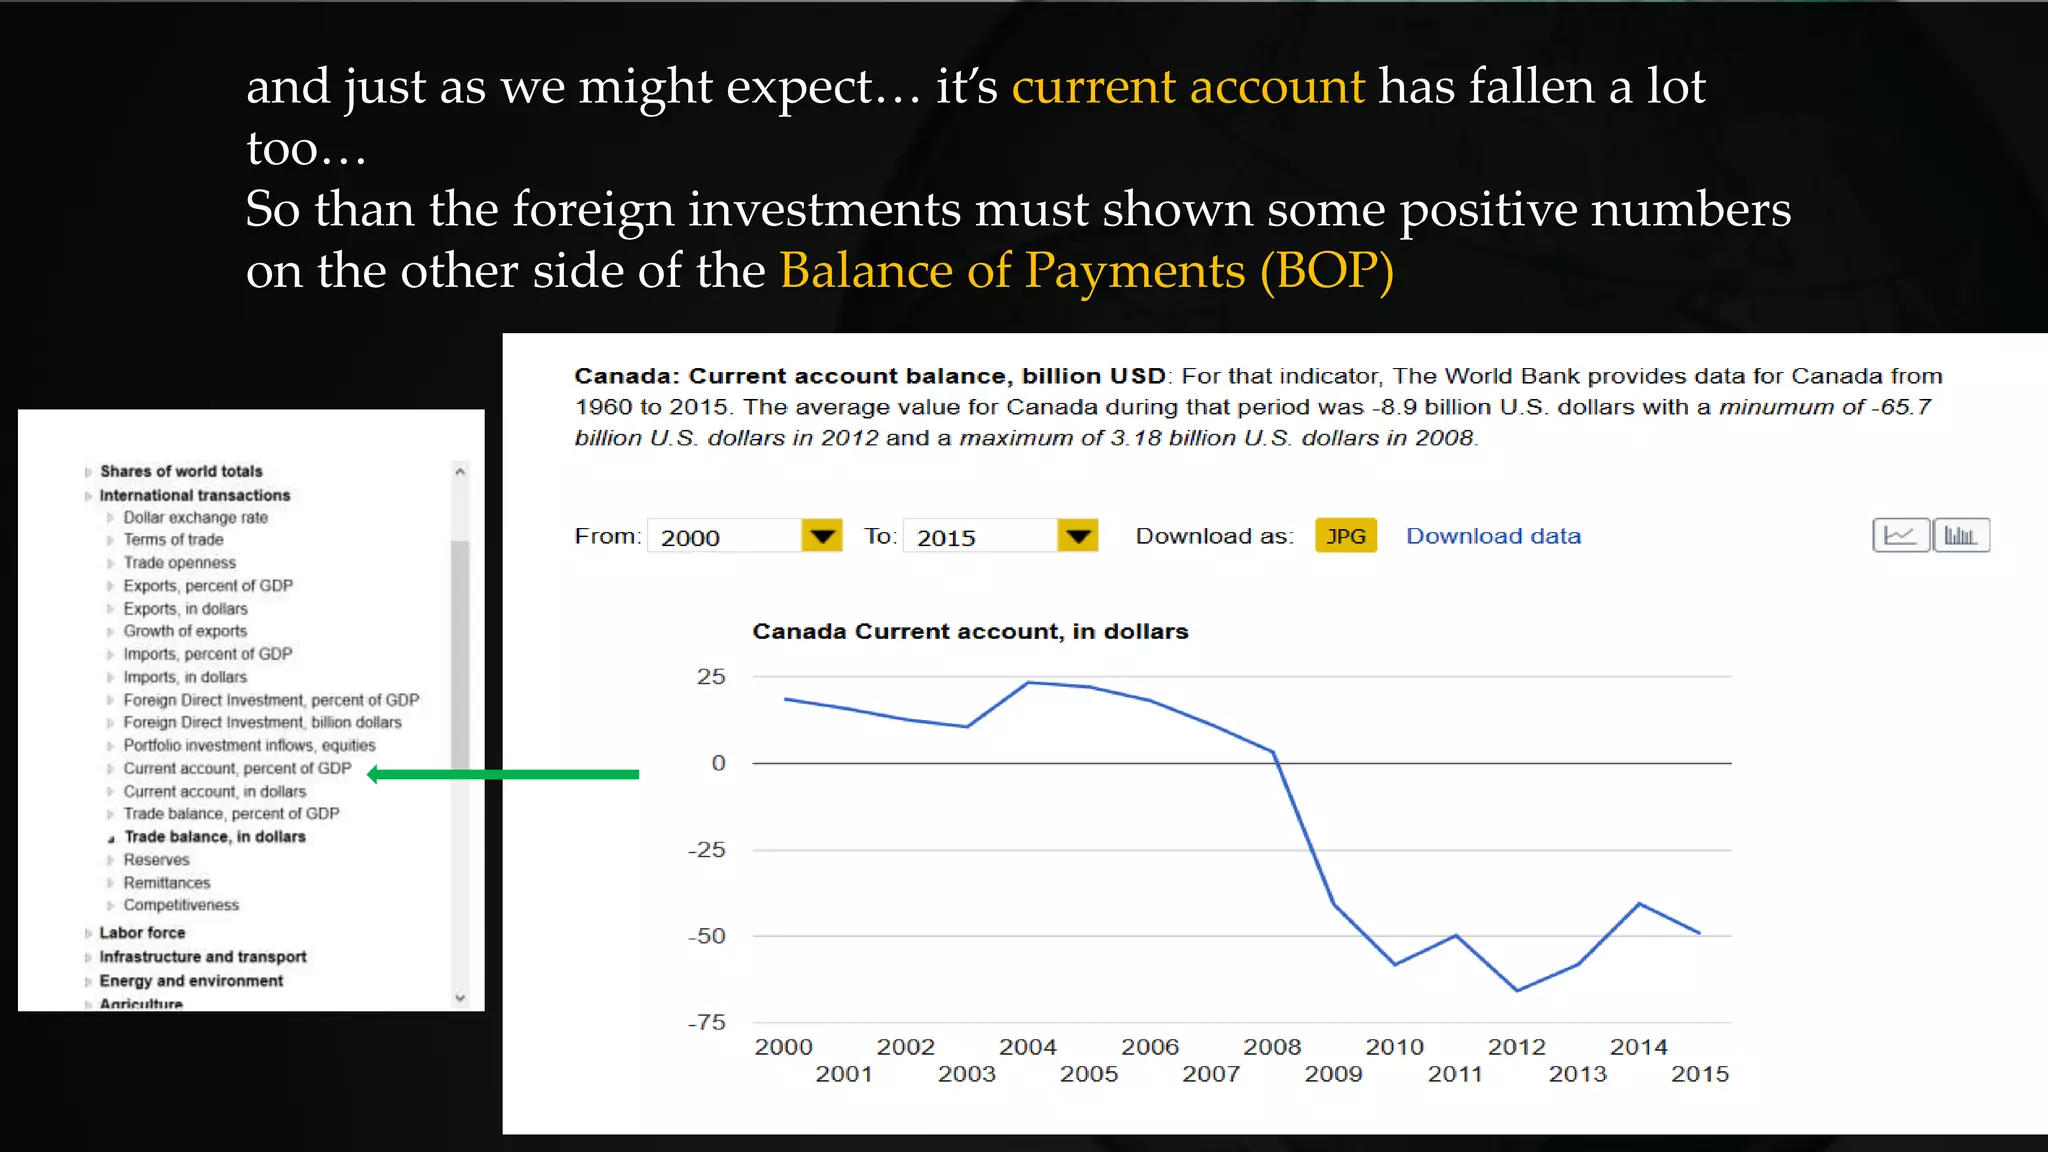
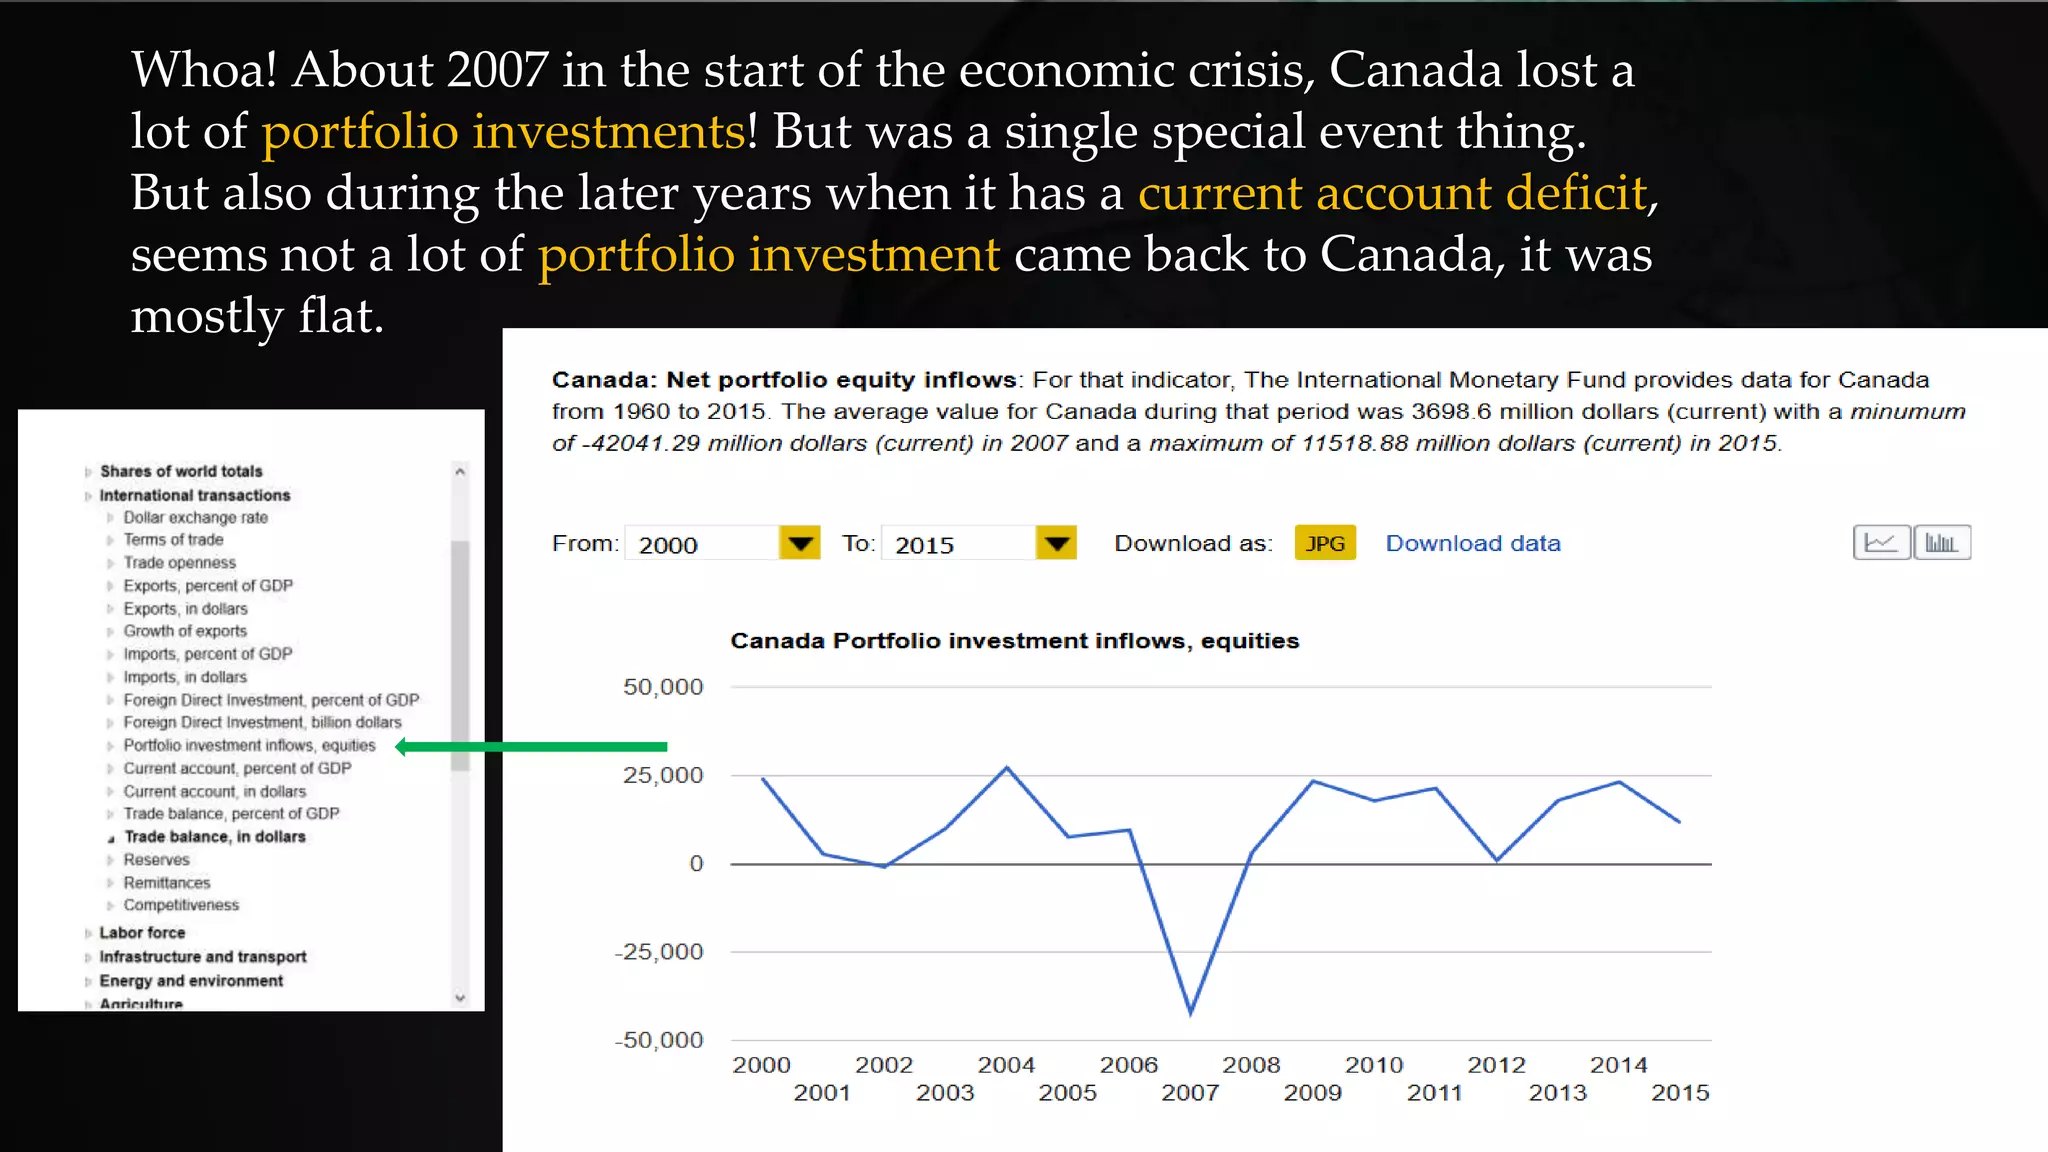
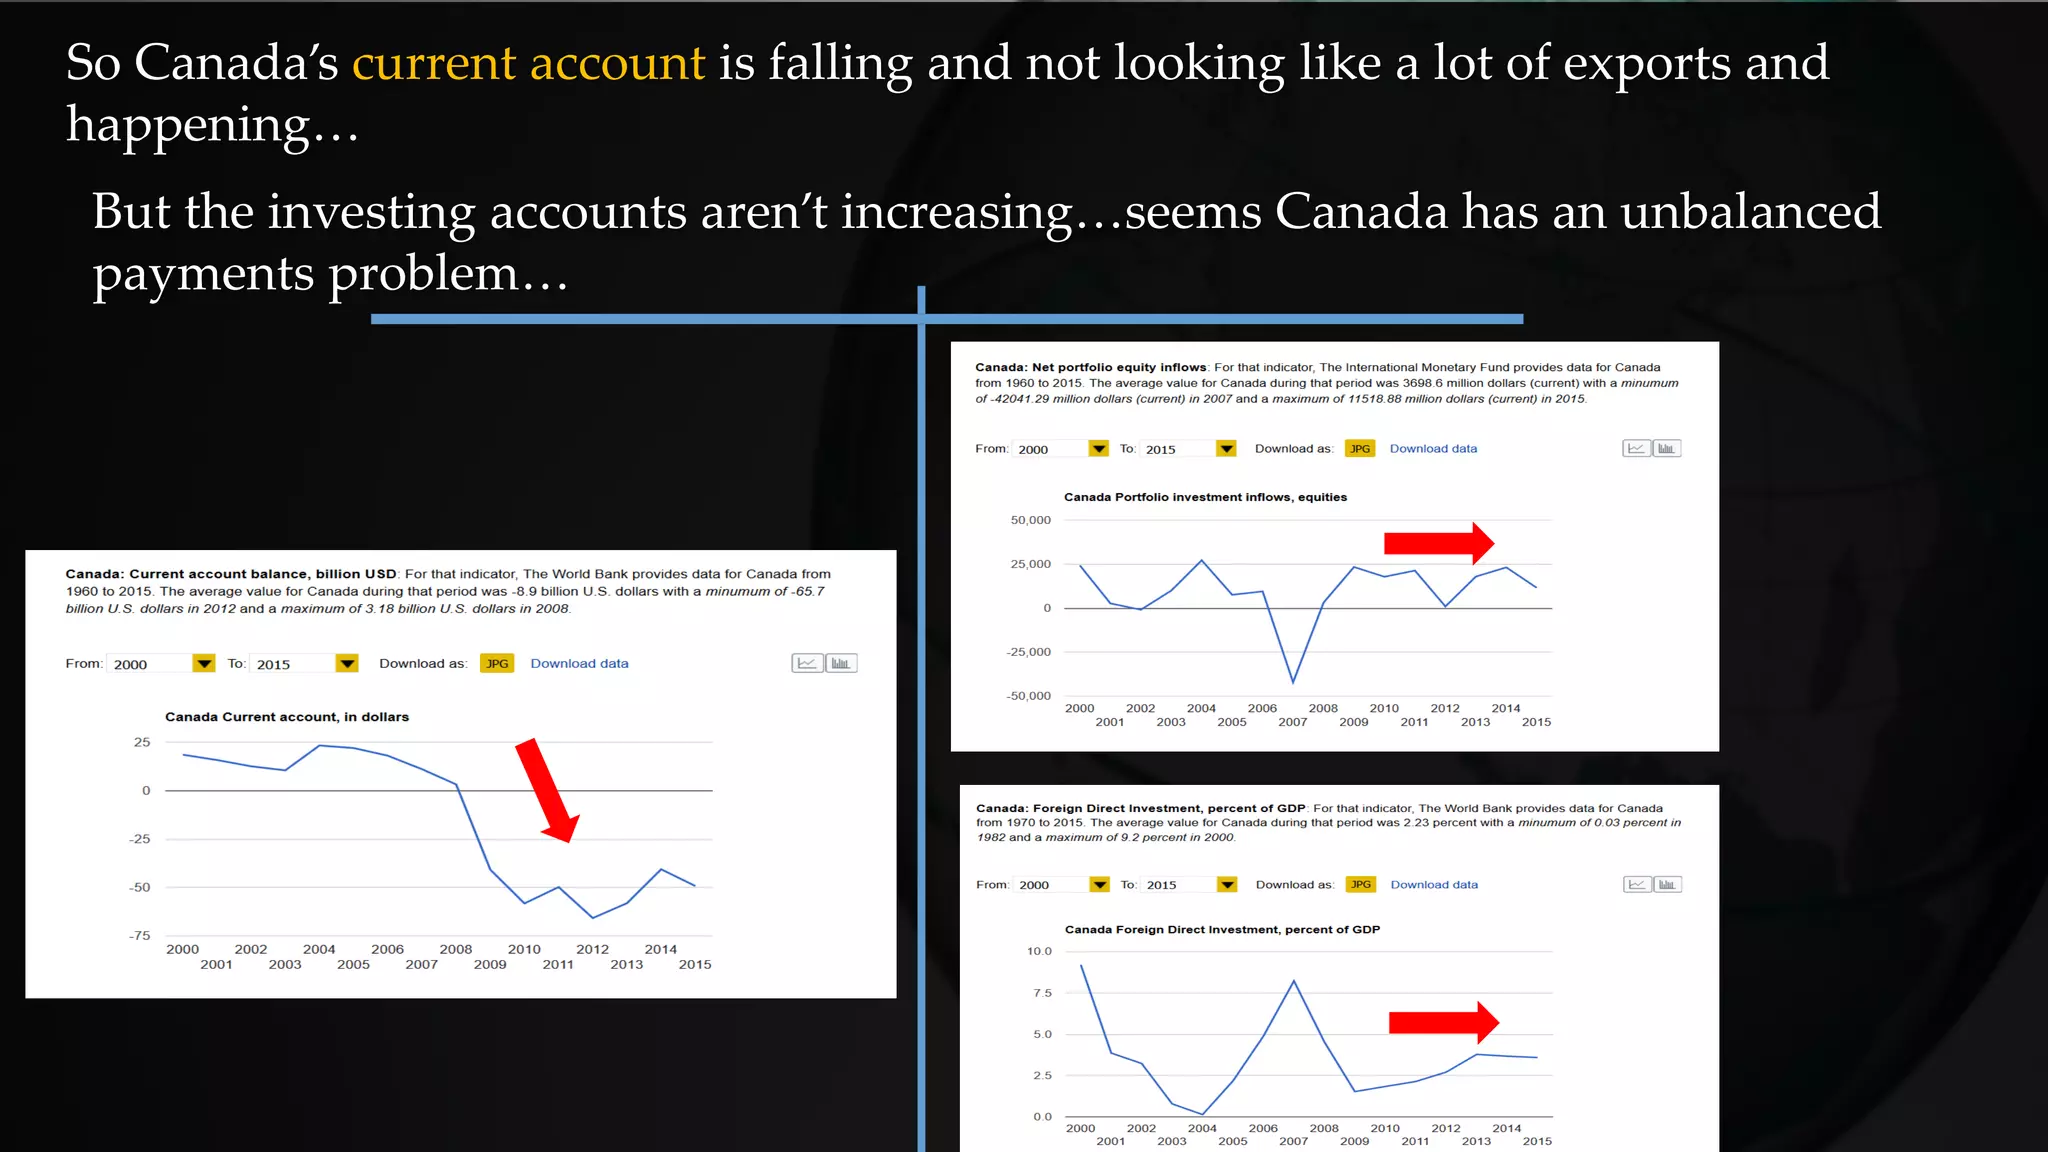
So for this assignment the goal for you is to
continue doing some research like you did
before but now about the Balance of
Payments…
You will use this website to do you
research:
http://atlas.media.mit.edu/
I will give you an example of what you will
do in this PPT…
http://www.theglobaleconomy.com
Just a little of
this one again if
needed:
So you already know this website:
http://atlas.media.mit.edu/
Now we will mostly use this one too:
http://www.theglobaleconomy.com
Click here to find your country, I will use Peru again.
You must use the same
country you used last time.
Find your country on the list:
Scroll down the page until you see the title that says
“International trade and Investment”
There will be a couple of paragraphs that summaries some trade data
about the country. Each country might have different data that is
discussed there depending on what are the important things to note
about this particular country.
The table will have different highlighted data for each country too.
Click on any of these links to get to the main screen to use, it doesn’t matter which
one, you will use the list of links on the next screen anyway to find the graphs you
need.
This links you need
to find the needed
graphs are here:
Change the dates
to 2000 -2015 here:
Change the graph
to be a line graph
here:
These are the graphs we wish to have and to collect for
this research assignment.
You will use the graphs that are about the balance of payments and international
trade here. However, be sure to use the ones that are list “in dollars or similar”
You will use the graphs that are about the balance of payments and international
trade here. However, be sure to use the ones that are list “in dollars or similar”
NOT “percent of GDP” ones
You will collect each of these graphs and answer a few questions...
The graph and the trade balance will be used to know about the
countries total NET exports and imports.
You can use this website to find the total exports over this time
period…
and also the imports over this time period. However…
Alternatively you can find the trade balance on this
website and is actually better to see the trade balance
with.
This is basically the last two graphs combined into one here. I can see how
Peru’s trade balance has changed. It drastically increased the amount of
imports and exports in it’s economy, always being a NET exporter until
recently in the last few years.
Peru’s current account records the balance of trade in Peru as well as other things like
income and current transfers (remittances are a part of current transfers) I can see that
even though Peru is a NET exporter most years the current account has decreased
and become a larger deficit over the years. This can be a signal of problems…
You will also check the portfolio investments of your country. This amount often isn’t
that large in most countries. In Peru, it’s typically small except for a couple of jumps.
Those jumps are likely because of a single large purchase or movement of money, it’s
hard to know here about those, we mostly just want to see the long term trend.
Also you will check the Foreign Direct Investment in your country. This part can be
quite larger sometimes. This, plus the portfolio investment combined, in general
should mostly be a mirror imagine of the current account. It won’t be a perfect
mirror, since this missing some of the other sub-accounts info like the capital account
and official reserves account, but you should see a general pattern anyway.
I see that in general this is true for Peru’s as the current account trends down, the
investment accounts trend up, this would show the tendency of the balance of
payments to “be kinda balanced” This might not be true in your country. You are to
check if your country follows this correct pattern or if it is very different (hint –China
is different)
Ya, crazy
stuff here but
the numbers
on the graph
are small so I
won’t worry
too much
about this
here.
Let’s do another county’s current account and
investment accounts for an example to help…
We are not looking at every single sub account, just the
big ones, so it won’t always be a perfect match. Also
some countries don’t have a good balance of payments
equilibrium (like China) so it might look weird
because that country is experiencing some crazy
situation. And… that is part of the point, to be able to
see if the country has some crazy fundamental
problem or not in it’s trading situation.
Here is the USA’s trade balance. Notice that it is very negative, it
really imports waaayyyyy more than it exports.
Yep look, USA’s current account is waaayyyy negative too. Quite
different from Peru. Peru was a NET exporting country and turned
into a NET importing country. USA has always been a NET
importing country at this time.
The USA’s FDI (Foreign Direct Investment) has always been positive
during this time, though it’s an importing country, it does receive a
lot of investment money from foreign countries.
The portfolio account is also odd pattern, but again, is positive as
expected but also the numbers are quite lower anyway compared to
the FDI and current accounts.
So there is a general trend here you can kinda see, they kinda mirror each other…
When this deficit increases… (spending more abroad on imports)
This surplus increase… (foreign investment spending in the US increases)
When you combine these increases and decreases they mostly offset so the NET
spending in the financial account might not change too much…
And the NET spending in the current account didn’t change much…
So this shows it can “mostly” balance each side of the Balance of Payments (BOP)
Not super
accurate, but
close
anyway…
It’s not perfect…but hopefully you can see some patterns in your country that are
similar.
(China will not be like this really, China is a little different, it’s not so “balanced”)
Ok…one last example to this effect…
Some countries won’t be so balanced because they
have some crazy things happen to them…
Canada’s trade balance really has fallen and has become a NET
importer…
and just as we might expect… it’s current account has fallen a lot
too…
So than the foreign investments must shown some positive numbers
on the other side of the Balance of Payments (BOP)
Whoa! About 2007 in the start of the economic crisis, Canada lost a
lot of portfolio investments! But was a single special event thing.
But also during the later years when it has a current account deficit,
seems not a lot of portfolio investment came back to Canada, it was
mostly flat.
But Whoa again! At that time FDI went super high! Seems some foreigners
decided to buy some companies in Canada for a some cheap prices (mostly
bought Canadian oil companies actually)…
But again, not a lot of investment kept coming in later years, also average
was flat.
So Canada’s current account is falling and not looking like a lot of exports and
happening…
But the investing accounts aren’t increasing…seems Canada has an unbalanced
payments problem…
- Describe your country’s balance of trade trends from 2000-2015.
- Describe your country’s current account trends from 2000-2015.
- Describe your country’s Foreign Direct Investment (FDI) trends from 2000-2015.
- Describe your country’s portfolio investment trends from 2000-2015.
- Does your country’s current account and financial account tend to balance each other? Describe the patterns
you see and attempt to explain them the best that you can. Since you aren’t using all of the sub-accounts and
have graphs for all of them, try to infer what you can, (deduction) perhaps some of those missing accounts can
help explain the pattern you might see.
Your country also might be suffering for a Balance of Payments (BOP) disequilibrium problem. This might
be hard to know at this point. The goal of this is for you to practice and get the main idea how it works. It is
a complicated and messy thing that doesn’t have perfect results, so I understand if it’s challenging to figure
out. I hope you can try and still get the basic points. Thanks.
Questions to answer:
So your homework….
You are to do something like what I did here, except you are to center your
story around your own country. Lucky for you if you have Canada or the US!
1.) Use the same country you had before for the last research assignment. Answer
the questions below and find some connections and try to show some patterns of
the BOP that you notice with your country.

Trading research part2

  • 1.
    So for thisassignment the goal for you is to continue doing some research like you did before but now about the Balance of Payments…
  • 2.
    You will usethis website to do you research: http://atlas.media.mit.edu/ I will give you an example of what you will do in this PPT… http://www.theglobaleconomy.com Just a little of this one again if needed:
  • 3.
    So you alreadyknow this website: http://atlas.media.mit.edu/
  • 4.
    Now we willmostly use this one too: http://www.theglobaleconomy.com
  • 5.
    Click here tofind your country, I will use Peru again. You must use the same country you used last time.
  • 6.
    Find your countryon the list:
  • 7.
    Scroll down thepage until you see the title that says “International trade and Investment”
  • 8.
    There will bea couple of paragraphs that summaries some trade data about the country. Each country might have different data that is discussed there depending on what are the important things to note about this particular country.
  • 9.
    The table willhave different highlighted data for each country too. Click on any of these links to get to the main screen to use, it doesn’t matter which one, you will use the list of links on the next screen anyway to find the graphs you need.
  • 10.
    This links youneed to find the needed graphs are here: Change the dates to 2000 -2015 here: Change the graph to be a line graph here:
  • 11.
    These are thegraphs we wish to have and to collect for this research assignment.
  • 12.
    You will usethe graphs that are about the balance of payments and international trade here. However, be sure to use the ones that are list “in dollars or similar”
  • 13.
    You will usethe graphs that are about the balance of payments and international trade here. However, be sure to use the ones that are list “in dollars or similar” NOT “percent of GDP” ones
  • 14.
    You will collecteach of these graphs and answer a few questions...
  • 15.
    The graph andthe trade balance will be used to know about the countries total NET exports and imports.
  • 16.
    You can usethis website to find the total exports over this time period…
  • 17.
    and also theimports over this time period. However…
  • 18.
    Alternatively you canfind the trade balance on this website and is actually better to see the trade balance with.
  • 19.
    This is basicallythe last two graphs combined into one here. I can see how Peru’s trade balance has changed. It drastically increased the amount of imports and exports in it’s economy, always being a NET exporter until recently in the last few years.
  • 20.
    Peru’s current accountrecords the balance of trade in Peru as well as other things like income and current transfers (remittances are a part of current transfers) I can see that even though Peru is a NET exporter most years the current account has decreased and become a larger deficit over the years. This can be a signal of problems…
  • 21.
    You will alsocheck the portfolio investments of your country. This amount often isn’t that large in most countries. In Peru, it’s typically small except for a couple of jumps. Those jumps are likely because of a single large purchase or movement of money, it’s hard to know here about those, we mostly just want to see the long term trend.
  • 22.
    Also you willcheck the Foreign Direct Investment in your country. This part can be quite larger sometimes. This, plus the portfolio investment combined, in general should mostly be a mirror imagine of the current account. It won’t be a perfect mirror, since this missing some of the other sub-accounts info like the capital account and official reserves account, but you should see a general pattern anyway.
  • 23.
    I see thatin general this is true for Peru’s as the current account trends down, the investment accounts trend up, this would show the tendency of the balance of payments to “be kinda balanced” This might not be true in your country. You are to check if your country follows this correct pattern or if it is very different (hint –China is different) Ya, crazy stuff here but the numbers on the graph are small so I won’t worry too much about this here.
  • 24.
    Let’s do anothercounty’s current account and investment accounts for an example to help… We are not looking at every single sub account, just the big ones, so it won’t always be a perfect match. Also some countries don’t have a good balance of payments equilibrium (like China) so it might look weird because that country is experiencing some crazy situation. And… that is part of the point, to be able to see if the country has some crazy fundamental problem or not in it’s trading situation.
  • 25.
    Here is theUSA’s trade balance. Notice that it is very negative, it really imports waaayyyyy more than it exports.
  • 26.
    Yep look, USA’scurrent account is waaayyyy negative too. Quite different from Peru. Peru was a NET exporting country and turned into a NET importing country. USA has always been a NET importing country at this time.
  • 27.
    The USA’s FDI(Foreign Direct Investment) has always been positive during this time, though it’s an importing country, it does receive a lot of investment money from foreign countries.
  • 28.
    The portfolio accountis also odd pattern, but again, is positive as expected but also the numbers are quite lower anyway compared to the FDI and current accounts.
  • 29.
    So there isa general trend here you can kinda see, they kinda mirror each other… When this deficit increases… (spending more abroad on imports) This surplus increase… (foreign investment spending in the US increases)
  • 30.
    When you combinethese increases and decreases they mostly offset so the NET spending in the financial account might not change too much… And the NET spending in the current account didn’t change much… So this shows it can “mostly” balance each side of the Balance of Payments (BOP) Not super accurate, but close anyway…
  • 31.
    It’s not perfect…buthopefully you can see some patterns in your country that are similar. (China will not be like this really, China is a little different, it’s not so “balanced”)
  • 32.
    Ok…one last exampleto this effect… Some countries won’t be so balanced because they have some crazy things happen to them…
  • 33.
    Canada’s trade balancereally has fallen and has become a NET importer…
  • 34.
    and just aswe might expect… it’s current account has fallen a lot too… So than the foreign investments must shown some positive numbers on the other side of the Balance of Payments (BOP)
  • 35.
    Whoa! About 2007in the start of the economic crisis, Canada lost a lot of portfolio investments! But was a single special event thing. But also during the later years when it has a current account deficit, seems not a lot of portfolio investment came back to Canada, it was mostly flat.
  • 36.
    But Whoa again!At that time FDI went super high! Seems some foreigners decided to buy some companies in Canada for a some cheap prices (mostly bought Canadian oil companies actually)… But again, not a lot of investment kept coming in later years, also average was flat.
  • 37.
    So Canada’s currentaccount is falling and not looking like a lot of exports and happening… But the investing accounts aren’t increasing…seems Canada has an unbalanced payments problem…
  • 38.
    - Describe yourcountry’s balance of trade trends from 2000-2015. - Describe your country’s current account trends from 2000-2015. - Describe your country’s Foreign Direct Investment (FDI) trends from 2000-2015. - Describe your country’s portfolio investment trends from 2000-2015. - Does your country’s current account and financial account tend to balance each other? Describe the patterns you see and attempt to explain them the best that you can. Since you aren’t using all of the sub-accounts and have graphs for all of them, try to infer what you can, (deduction) perhaps some of those missing accounts can help explain the pattern you might see. Your country also might be suffering for a Balance of Payments (BOP) disequilibrium problem. This might be hard to know at this point. The goal of this is for you to practice and get the main idea how it works. It is a complicated and messy thing that doesn’t have perfect results, so I understand if it’s challenging to figure out. I hope you can try and still get the basic points. Thanks. Questions to answer: So your homework…. You are to do something like what I did here, except you are to center your story around your own country. Lucky for you if you have Canada or the US! 1.) Use the same country you had before for the last research assignment. Answer the questions below and find some connections and try to show some patterns of the BOP that you notice with your country.

Editor's Notes