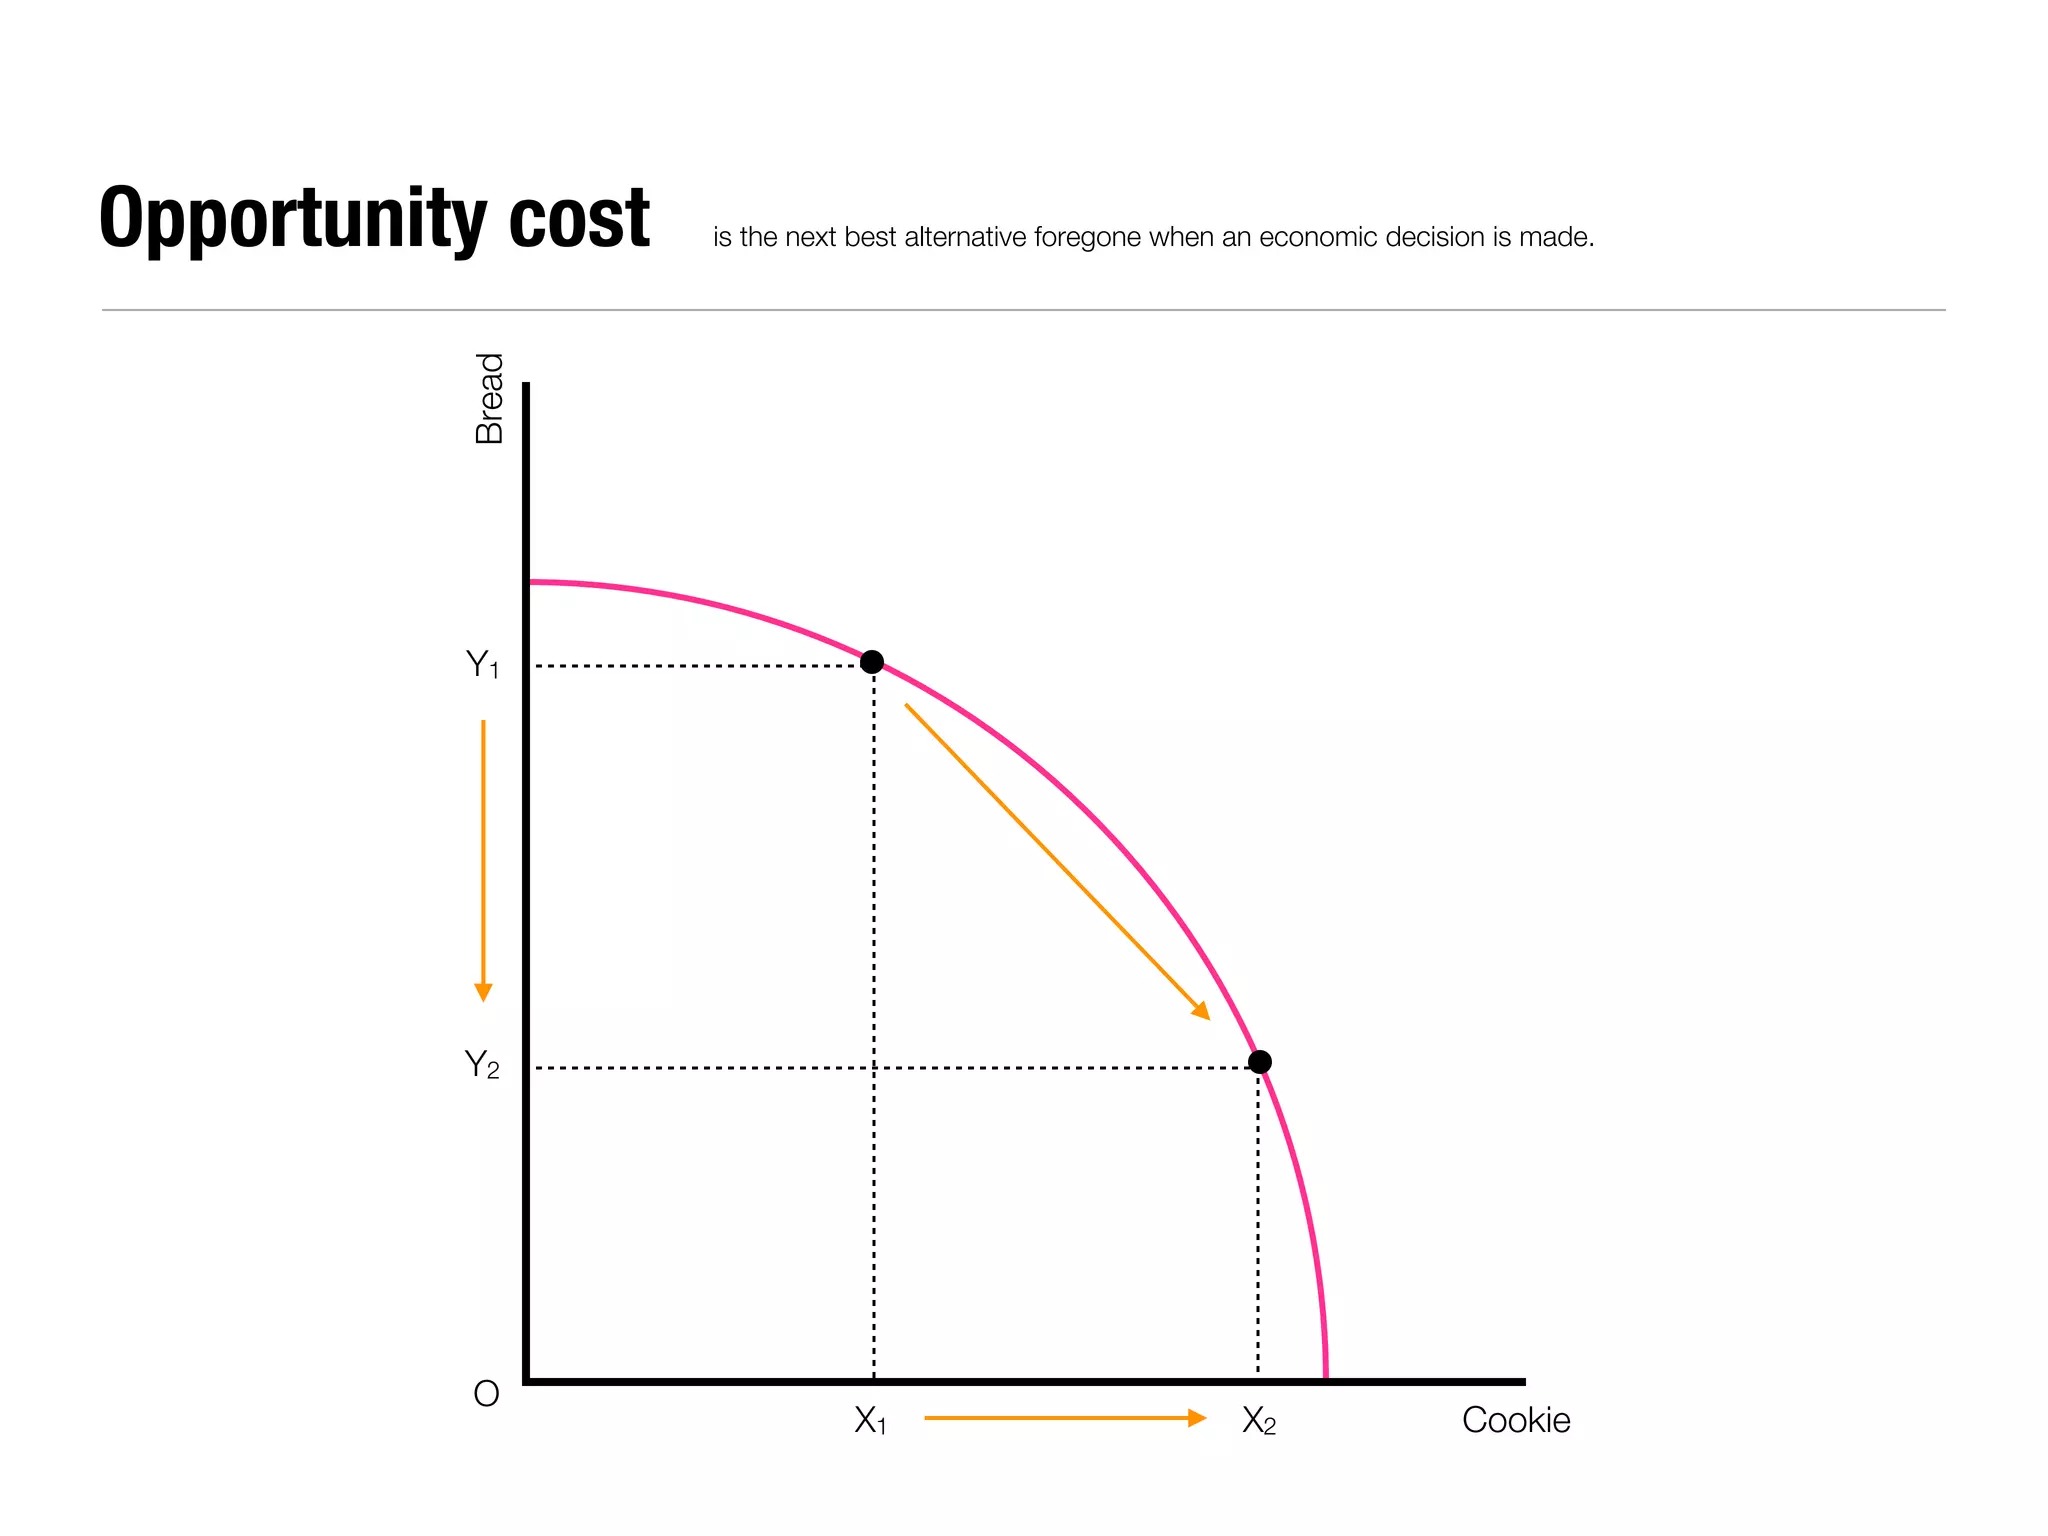
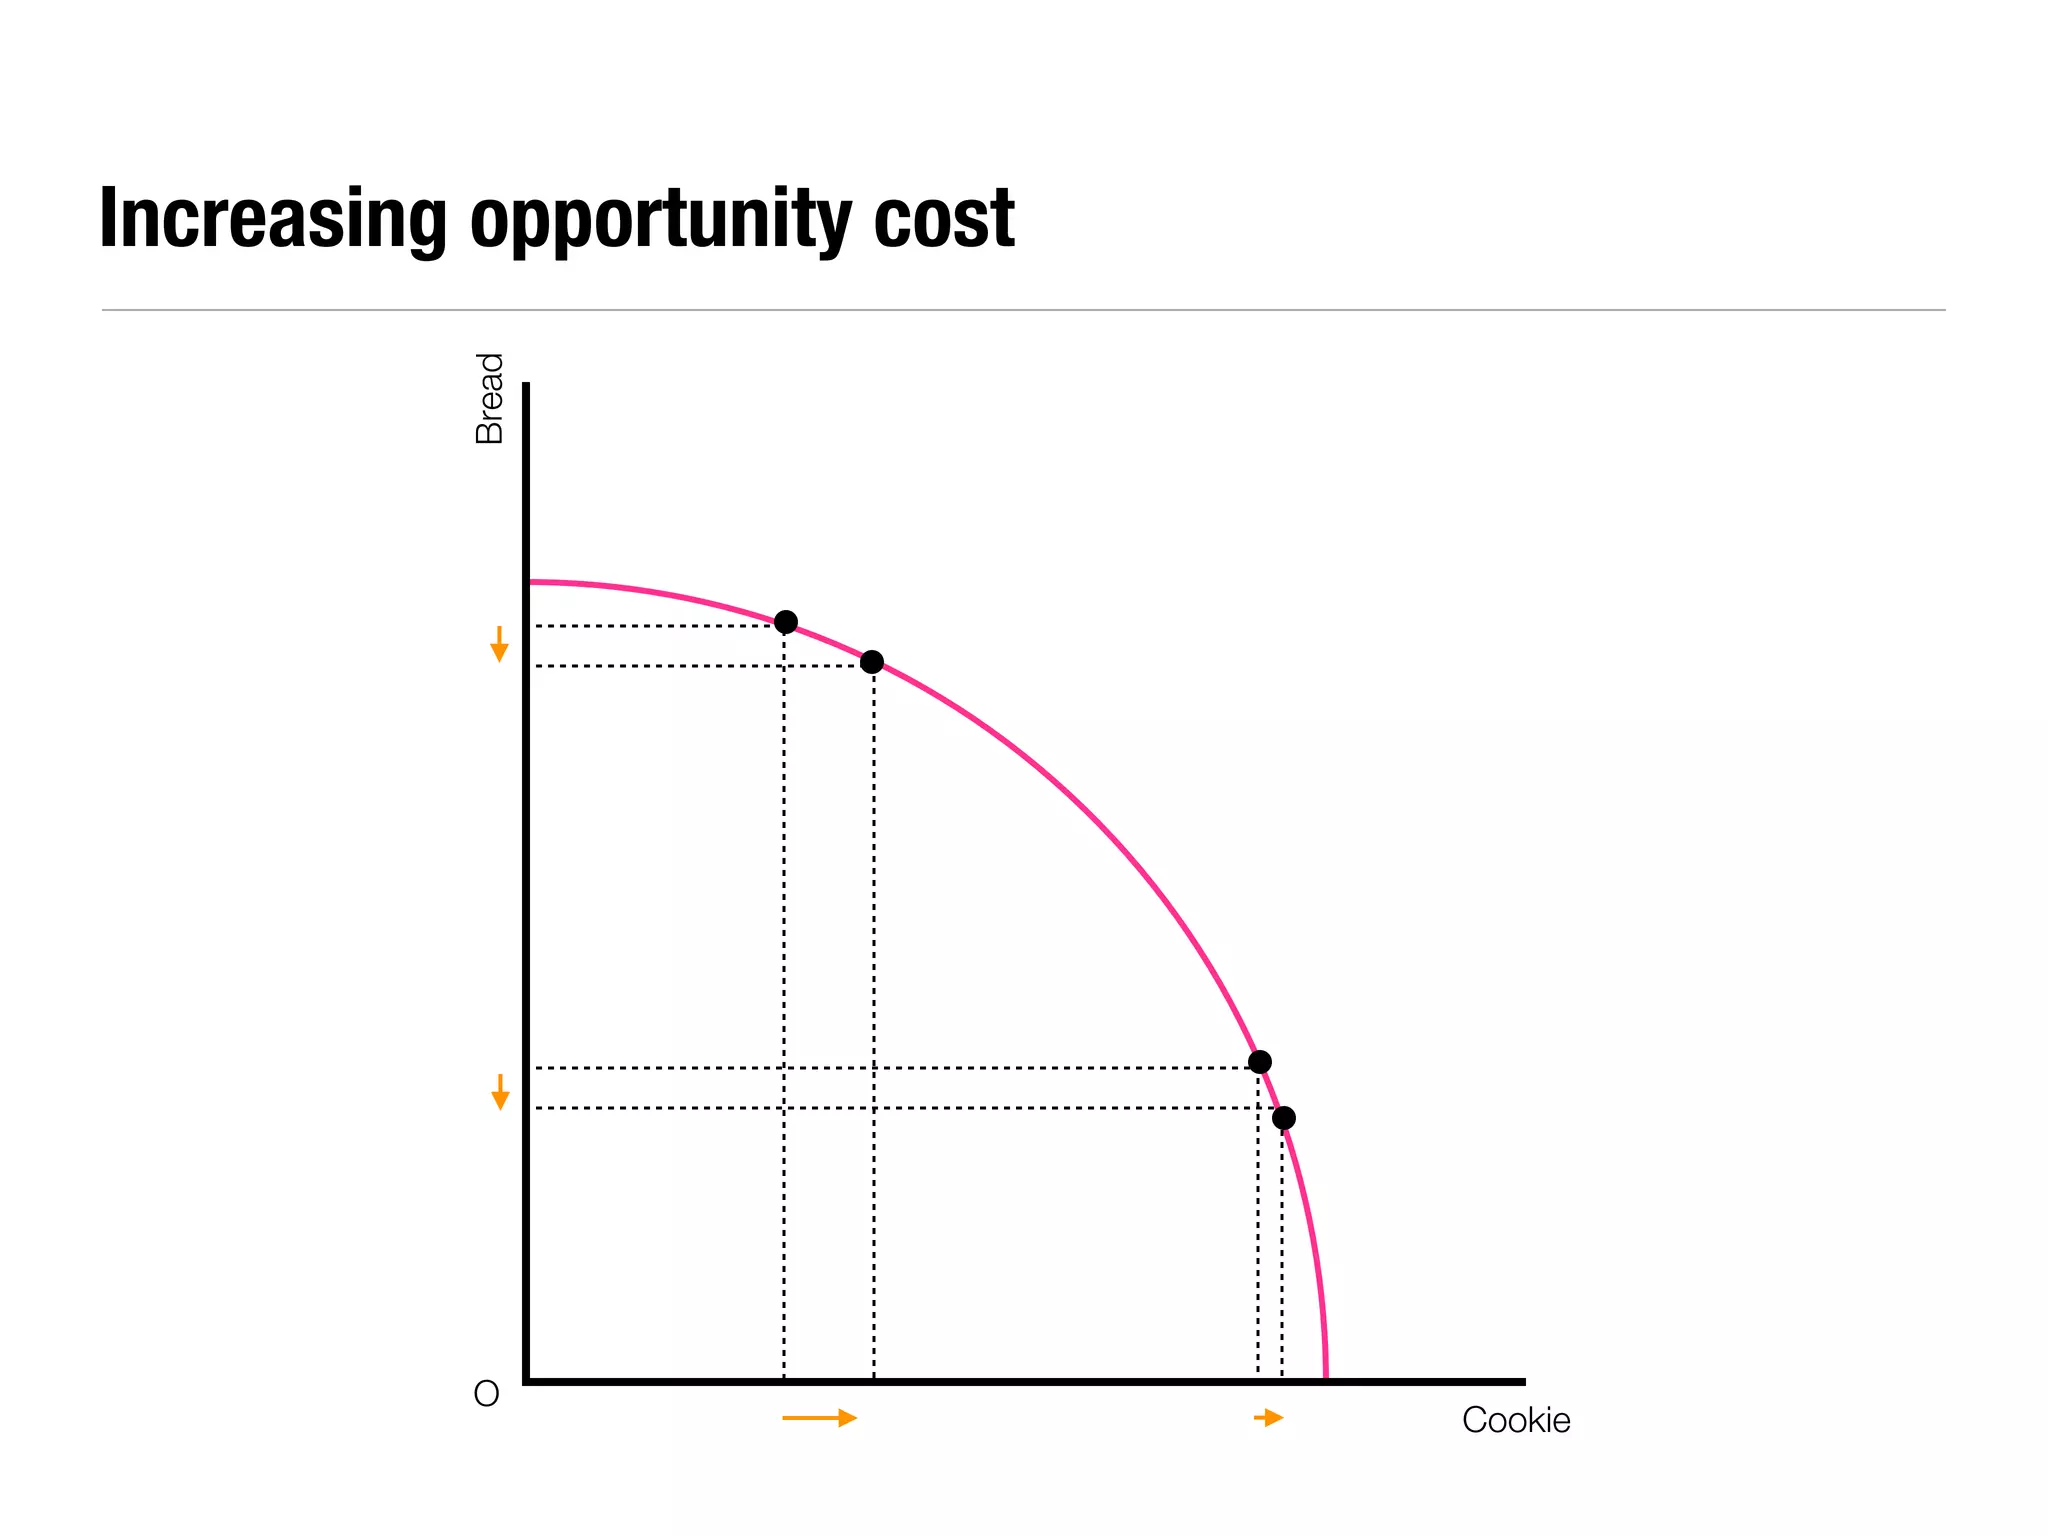
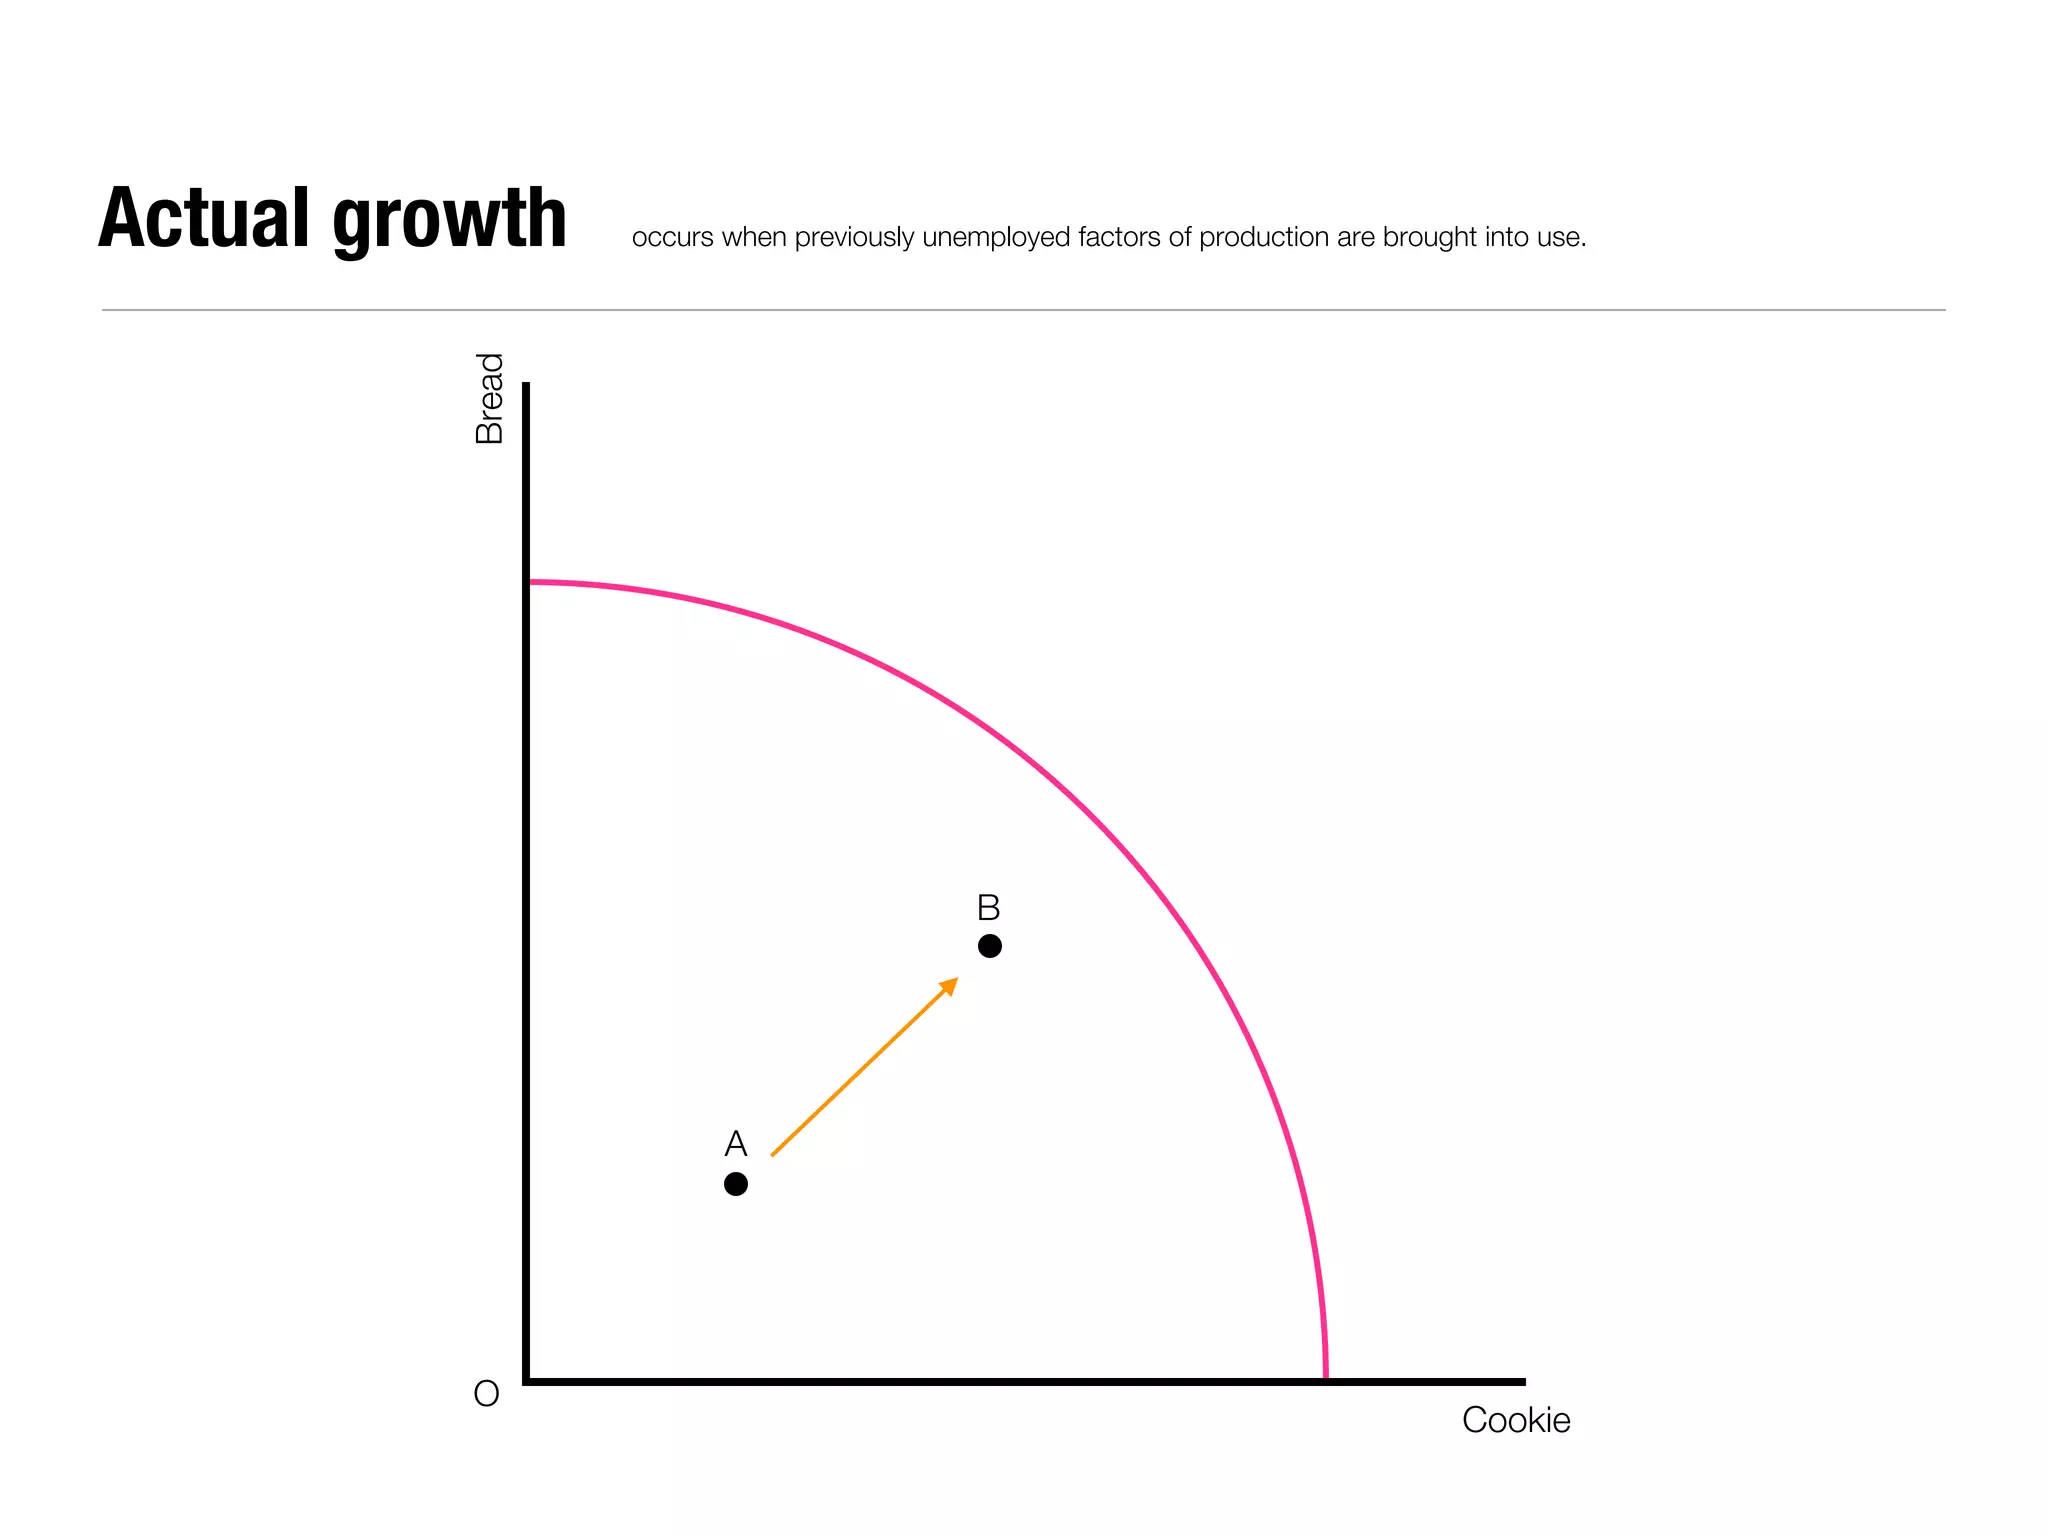
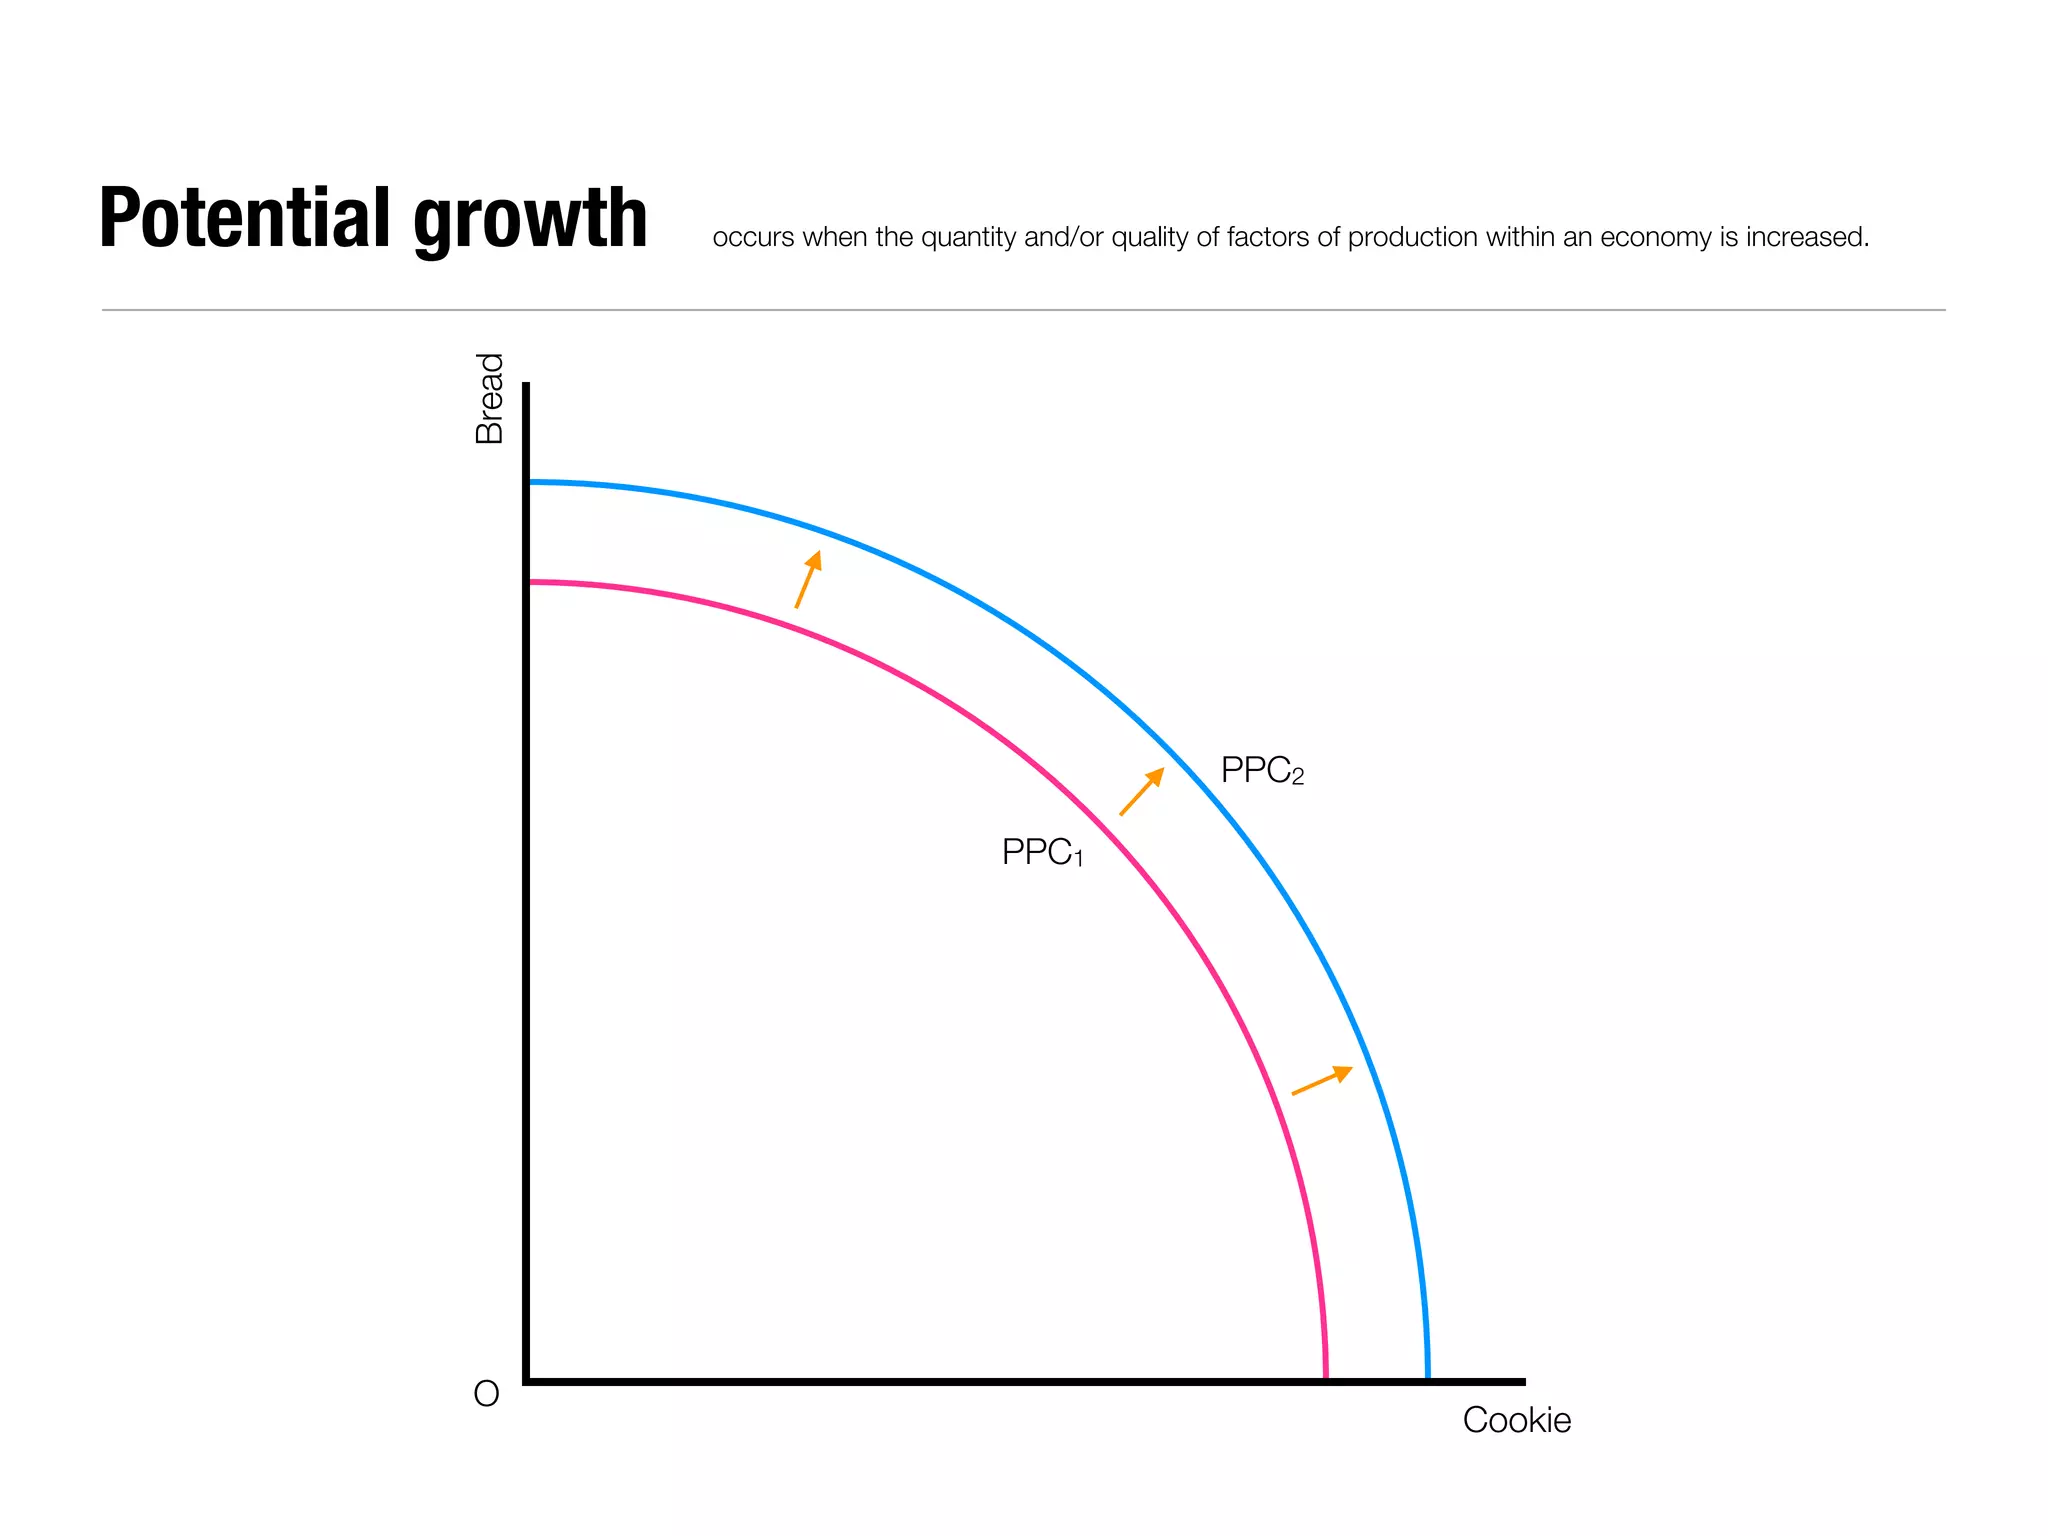
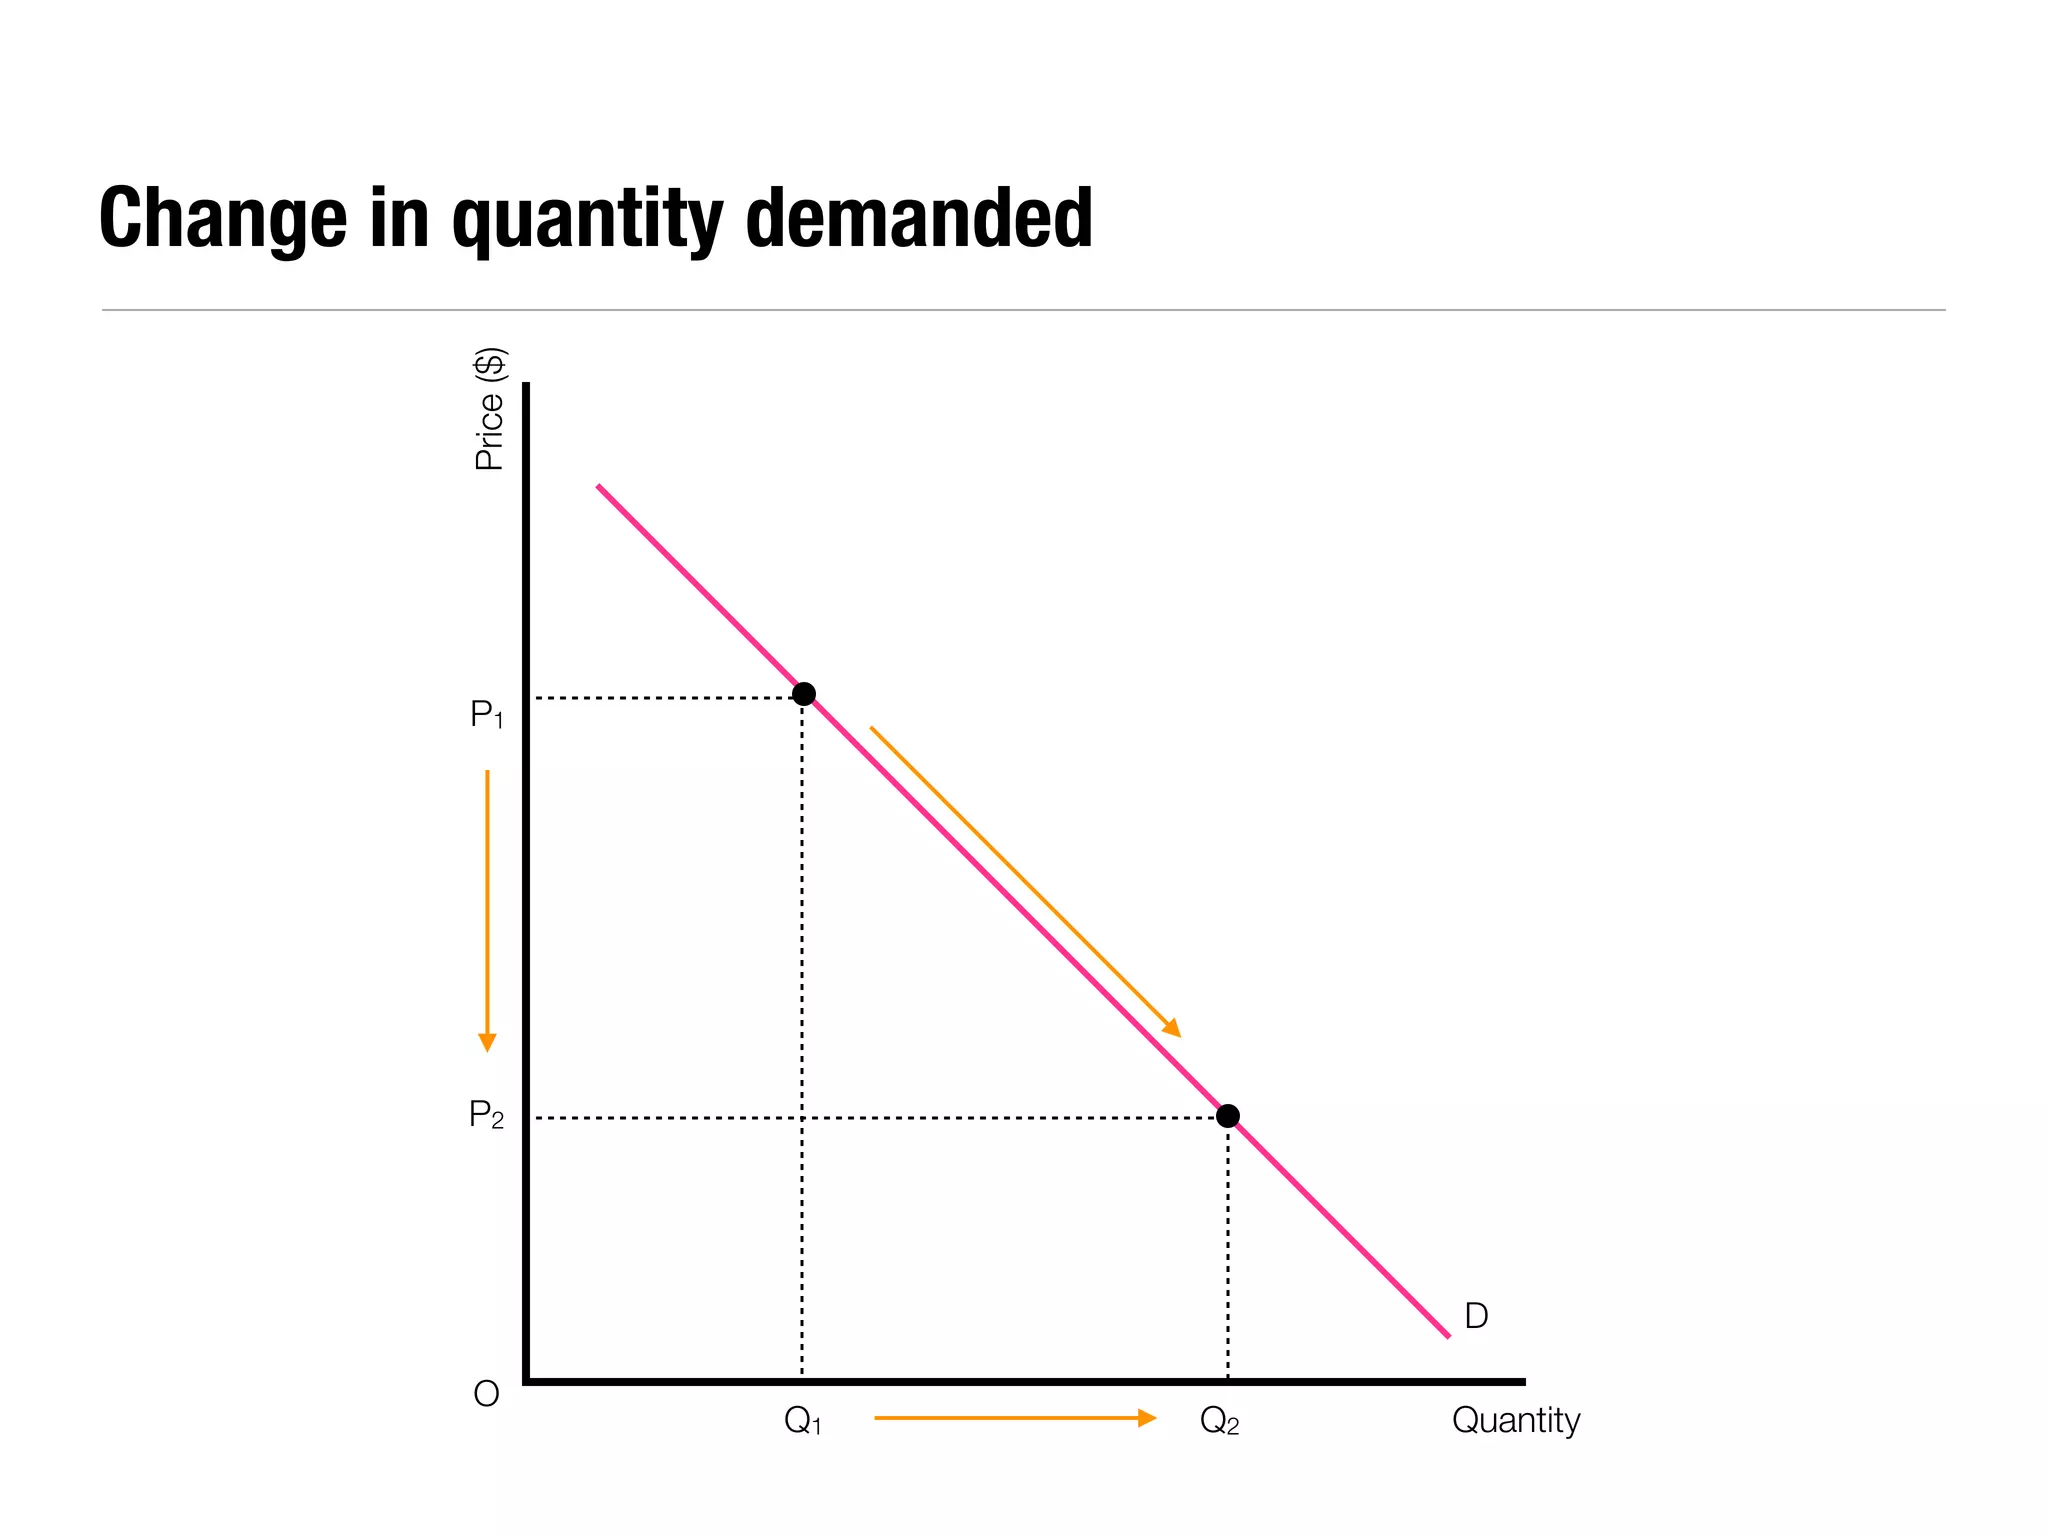
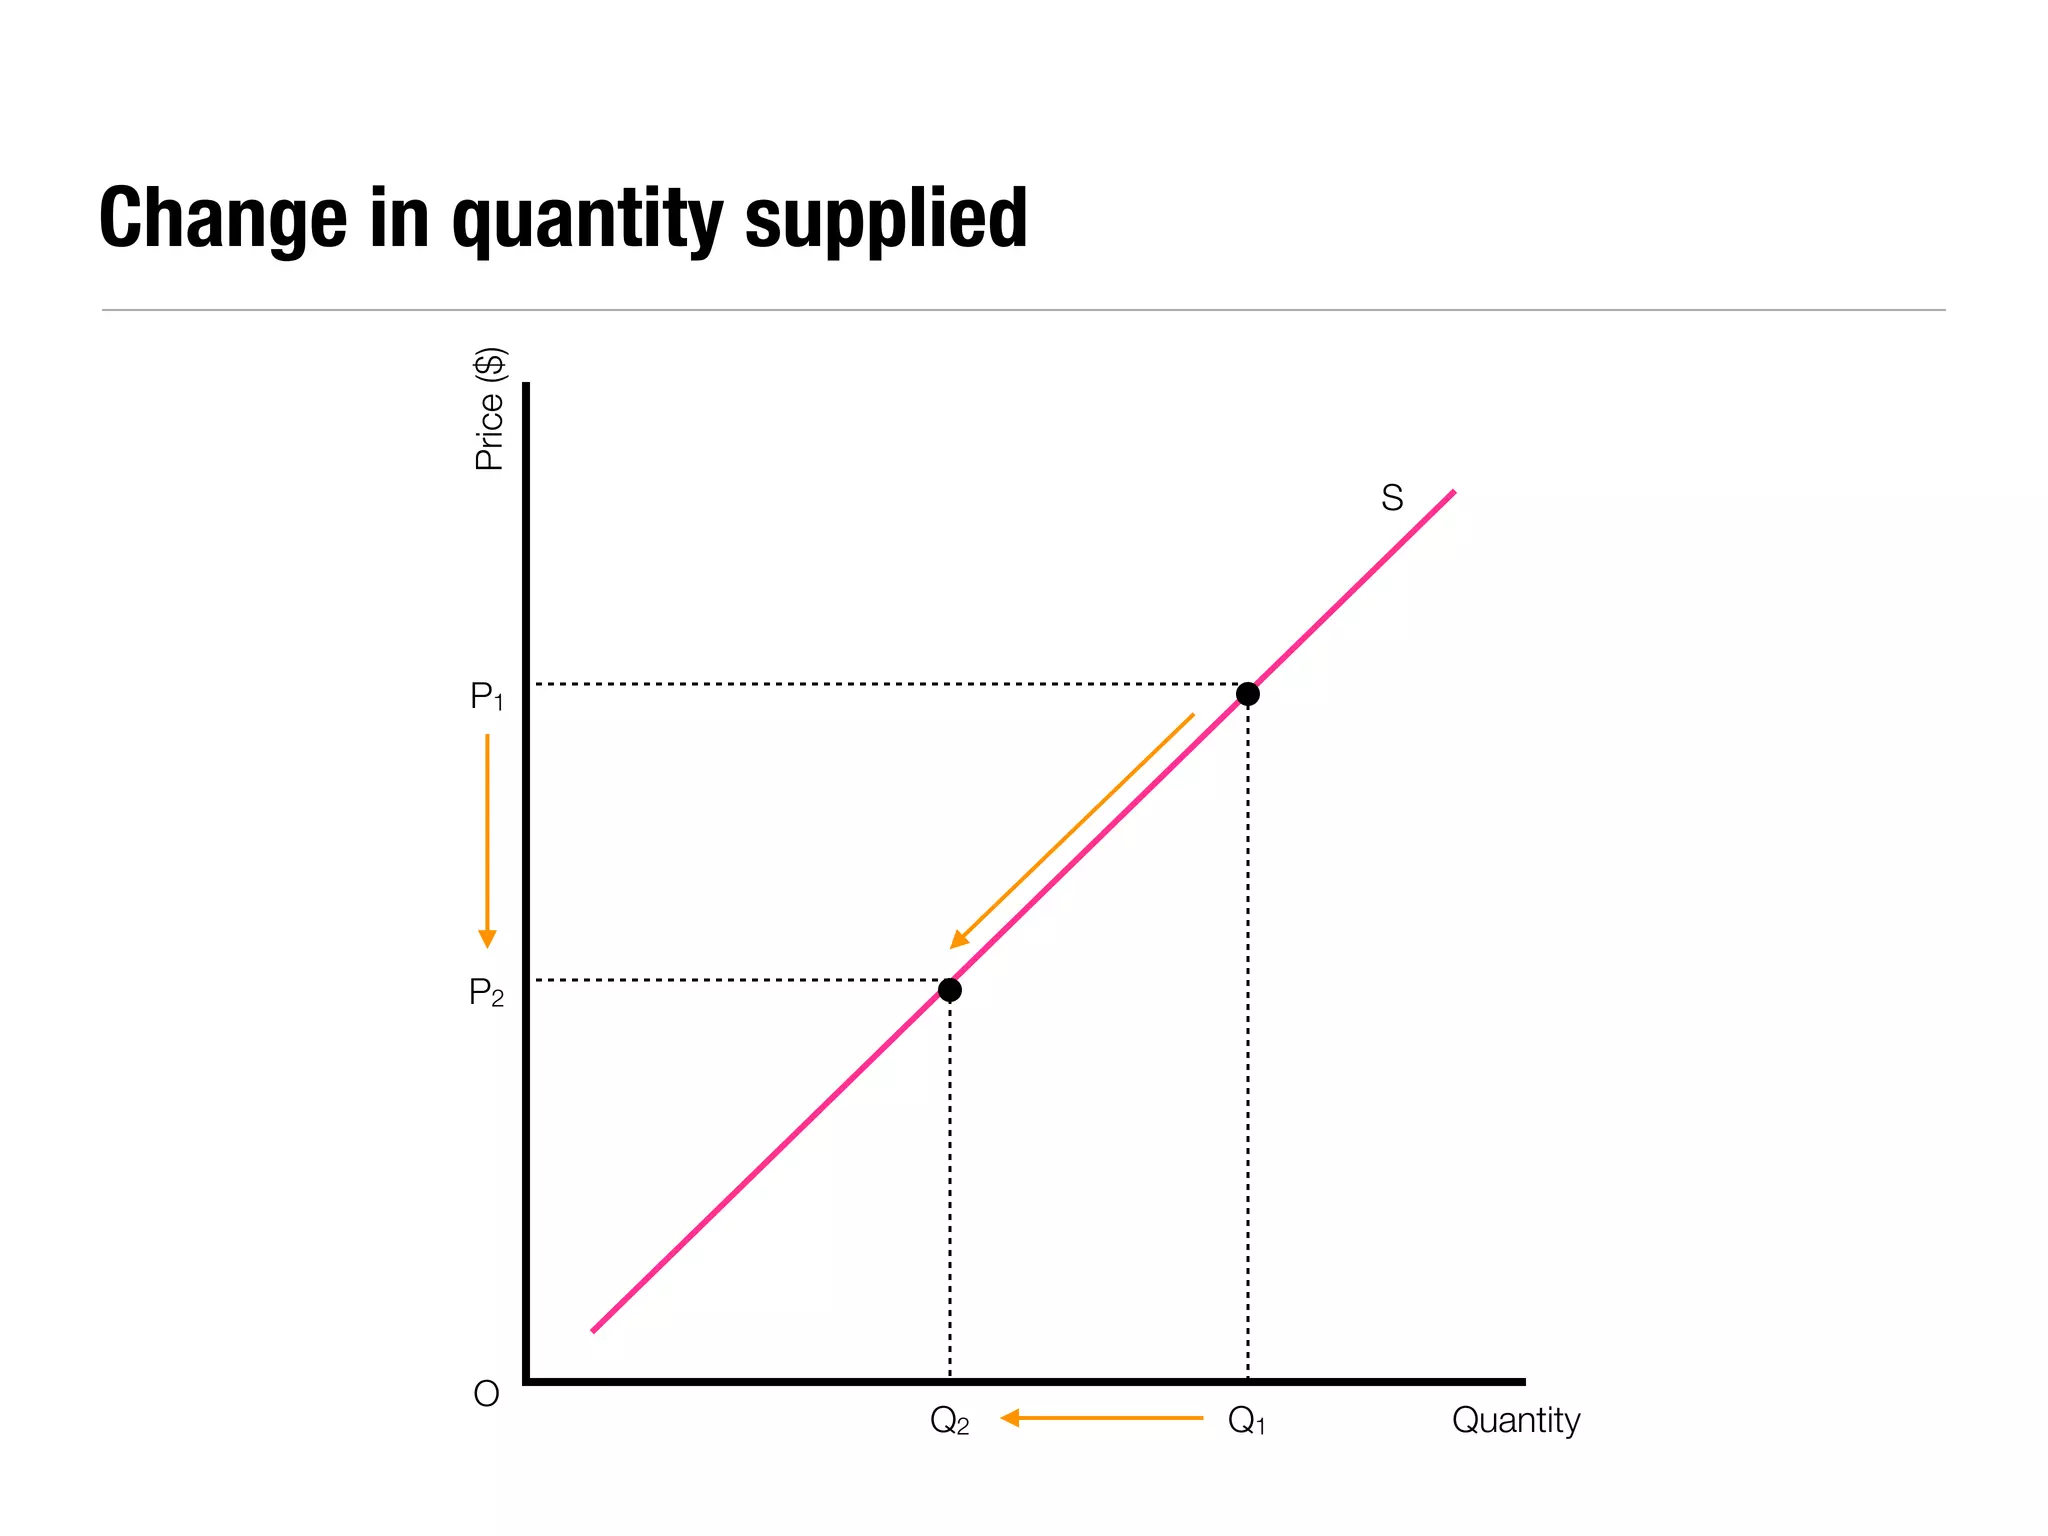
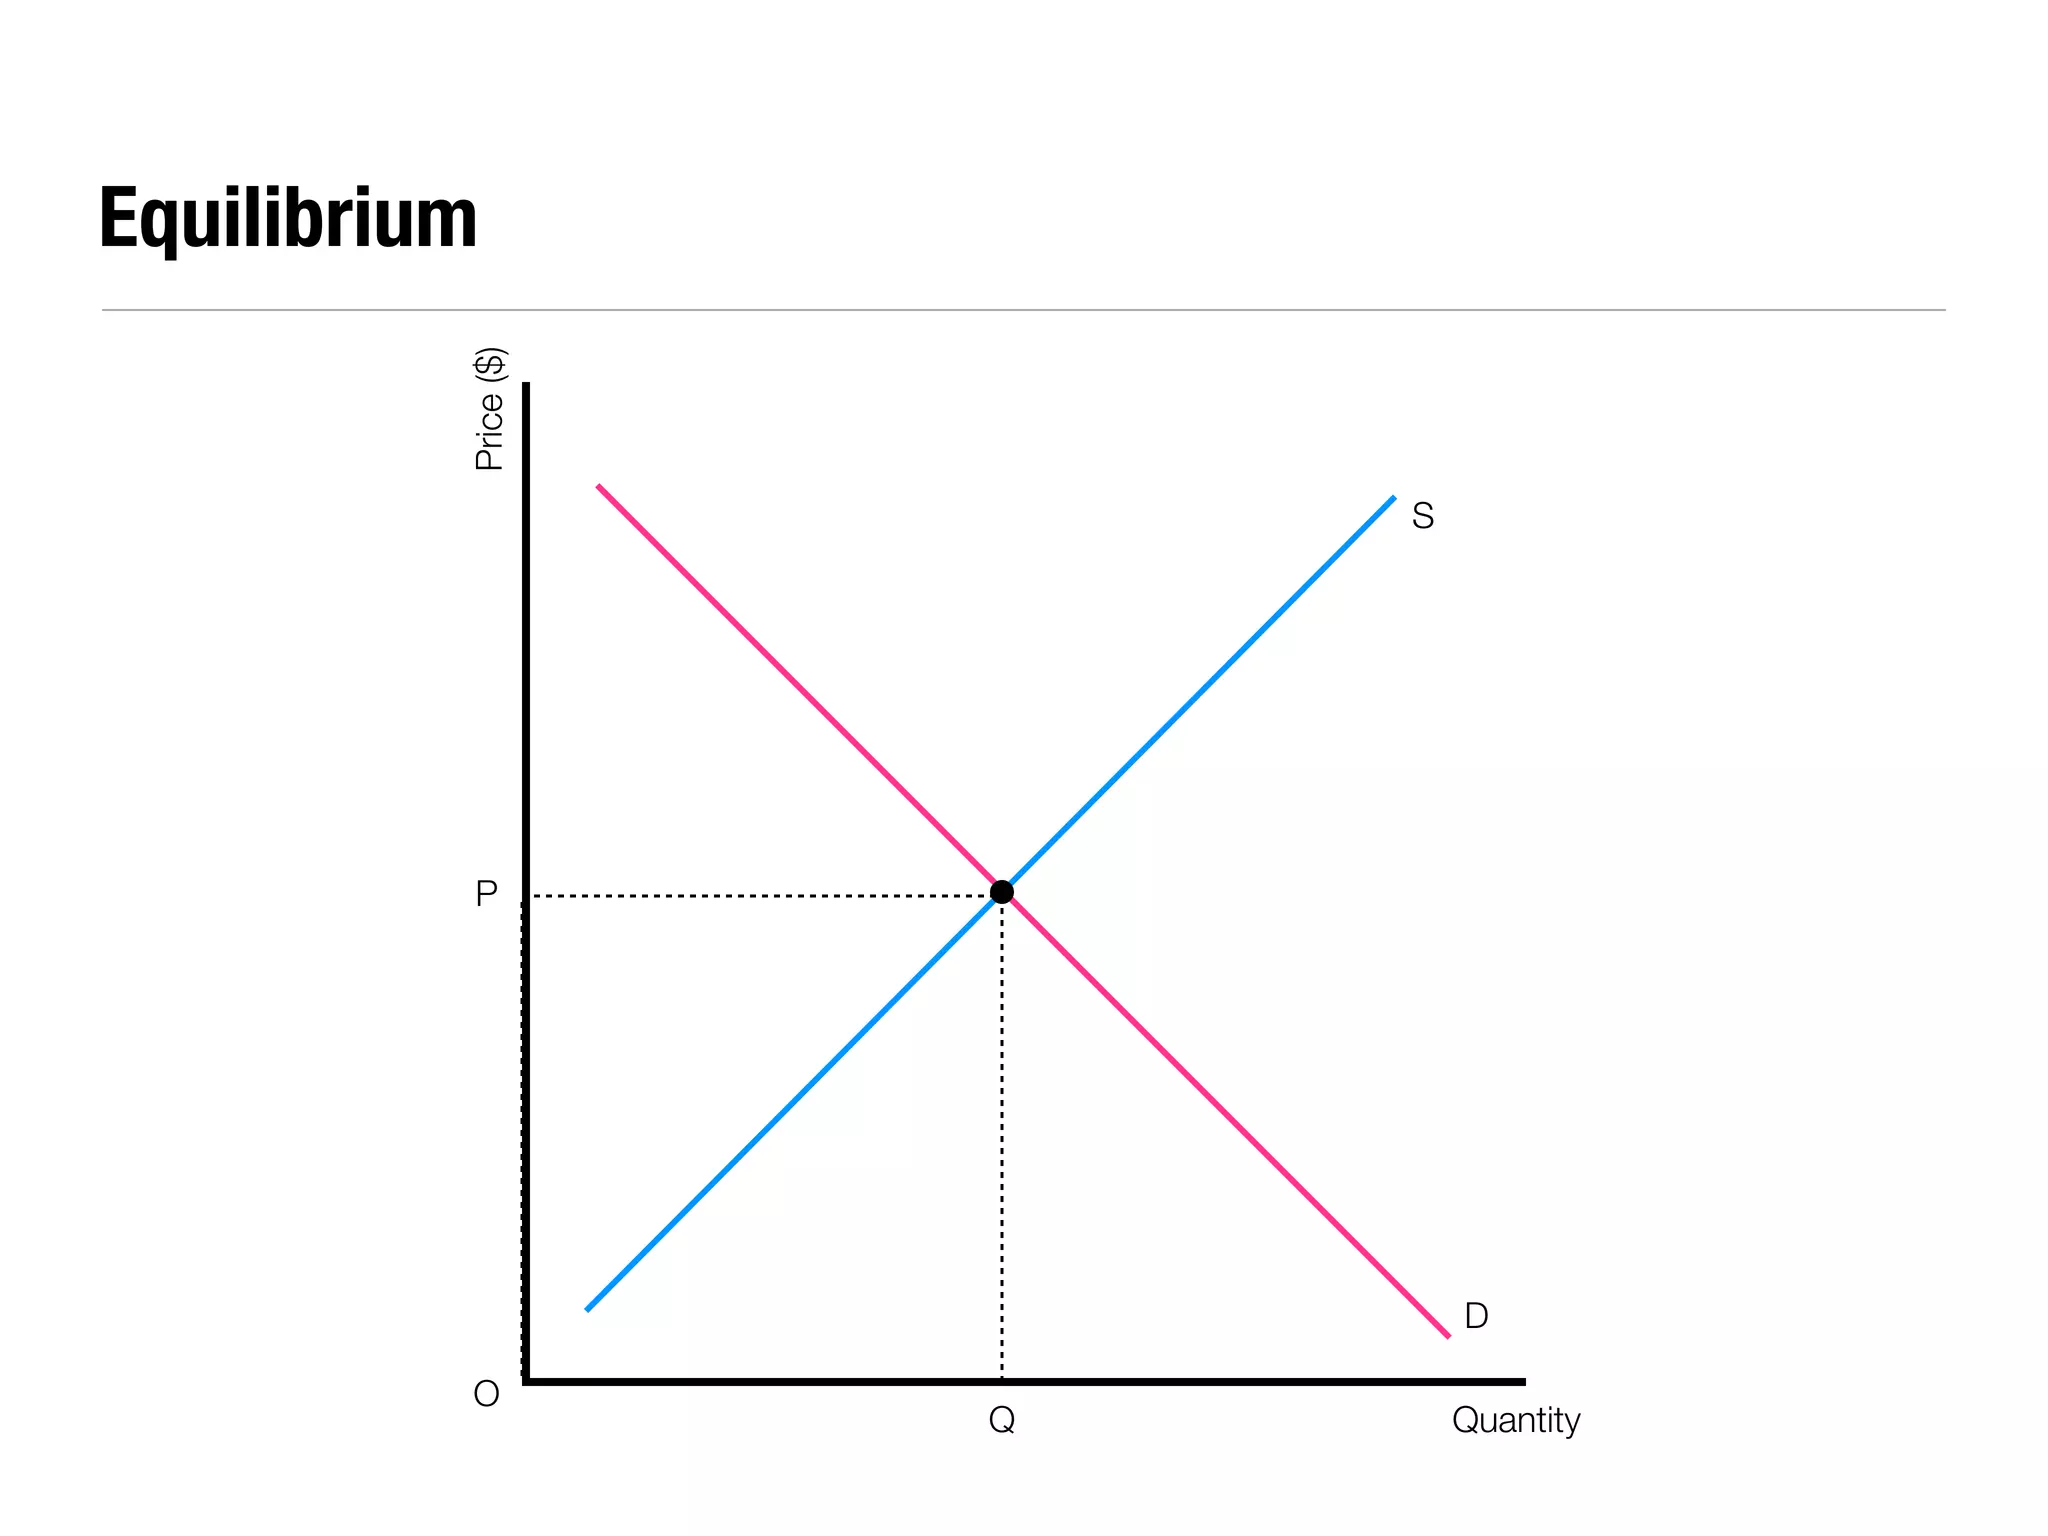
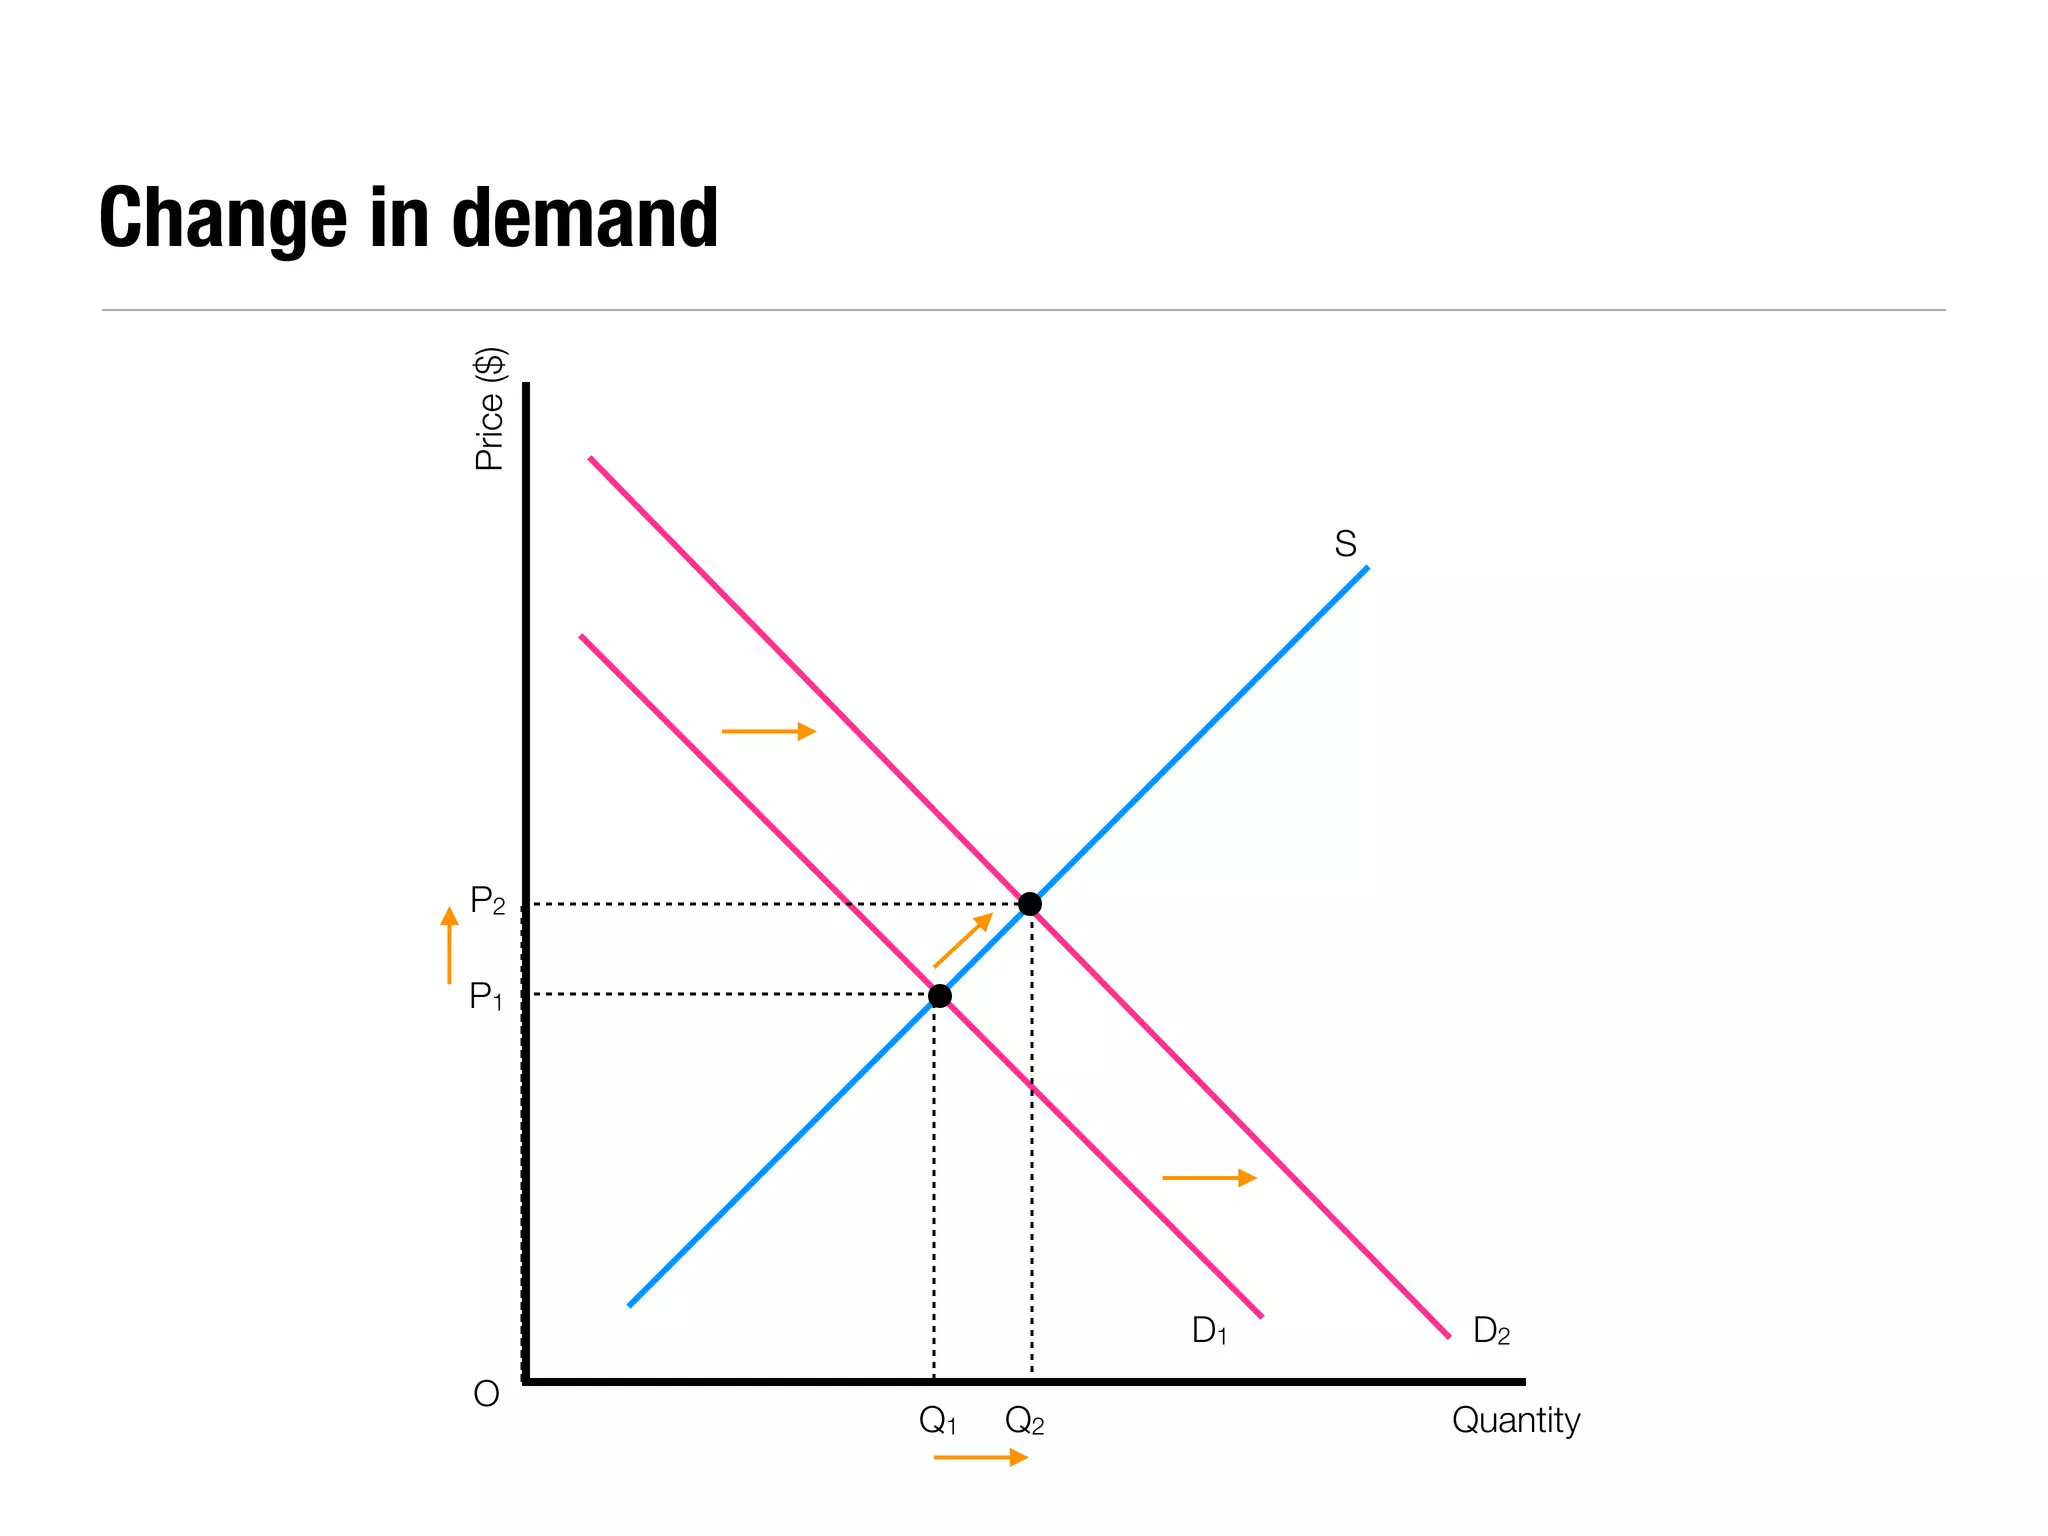
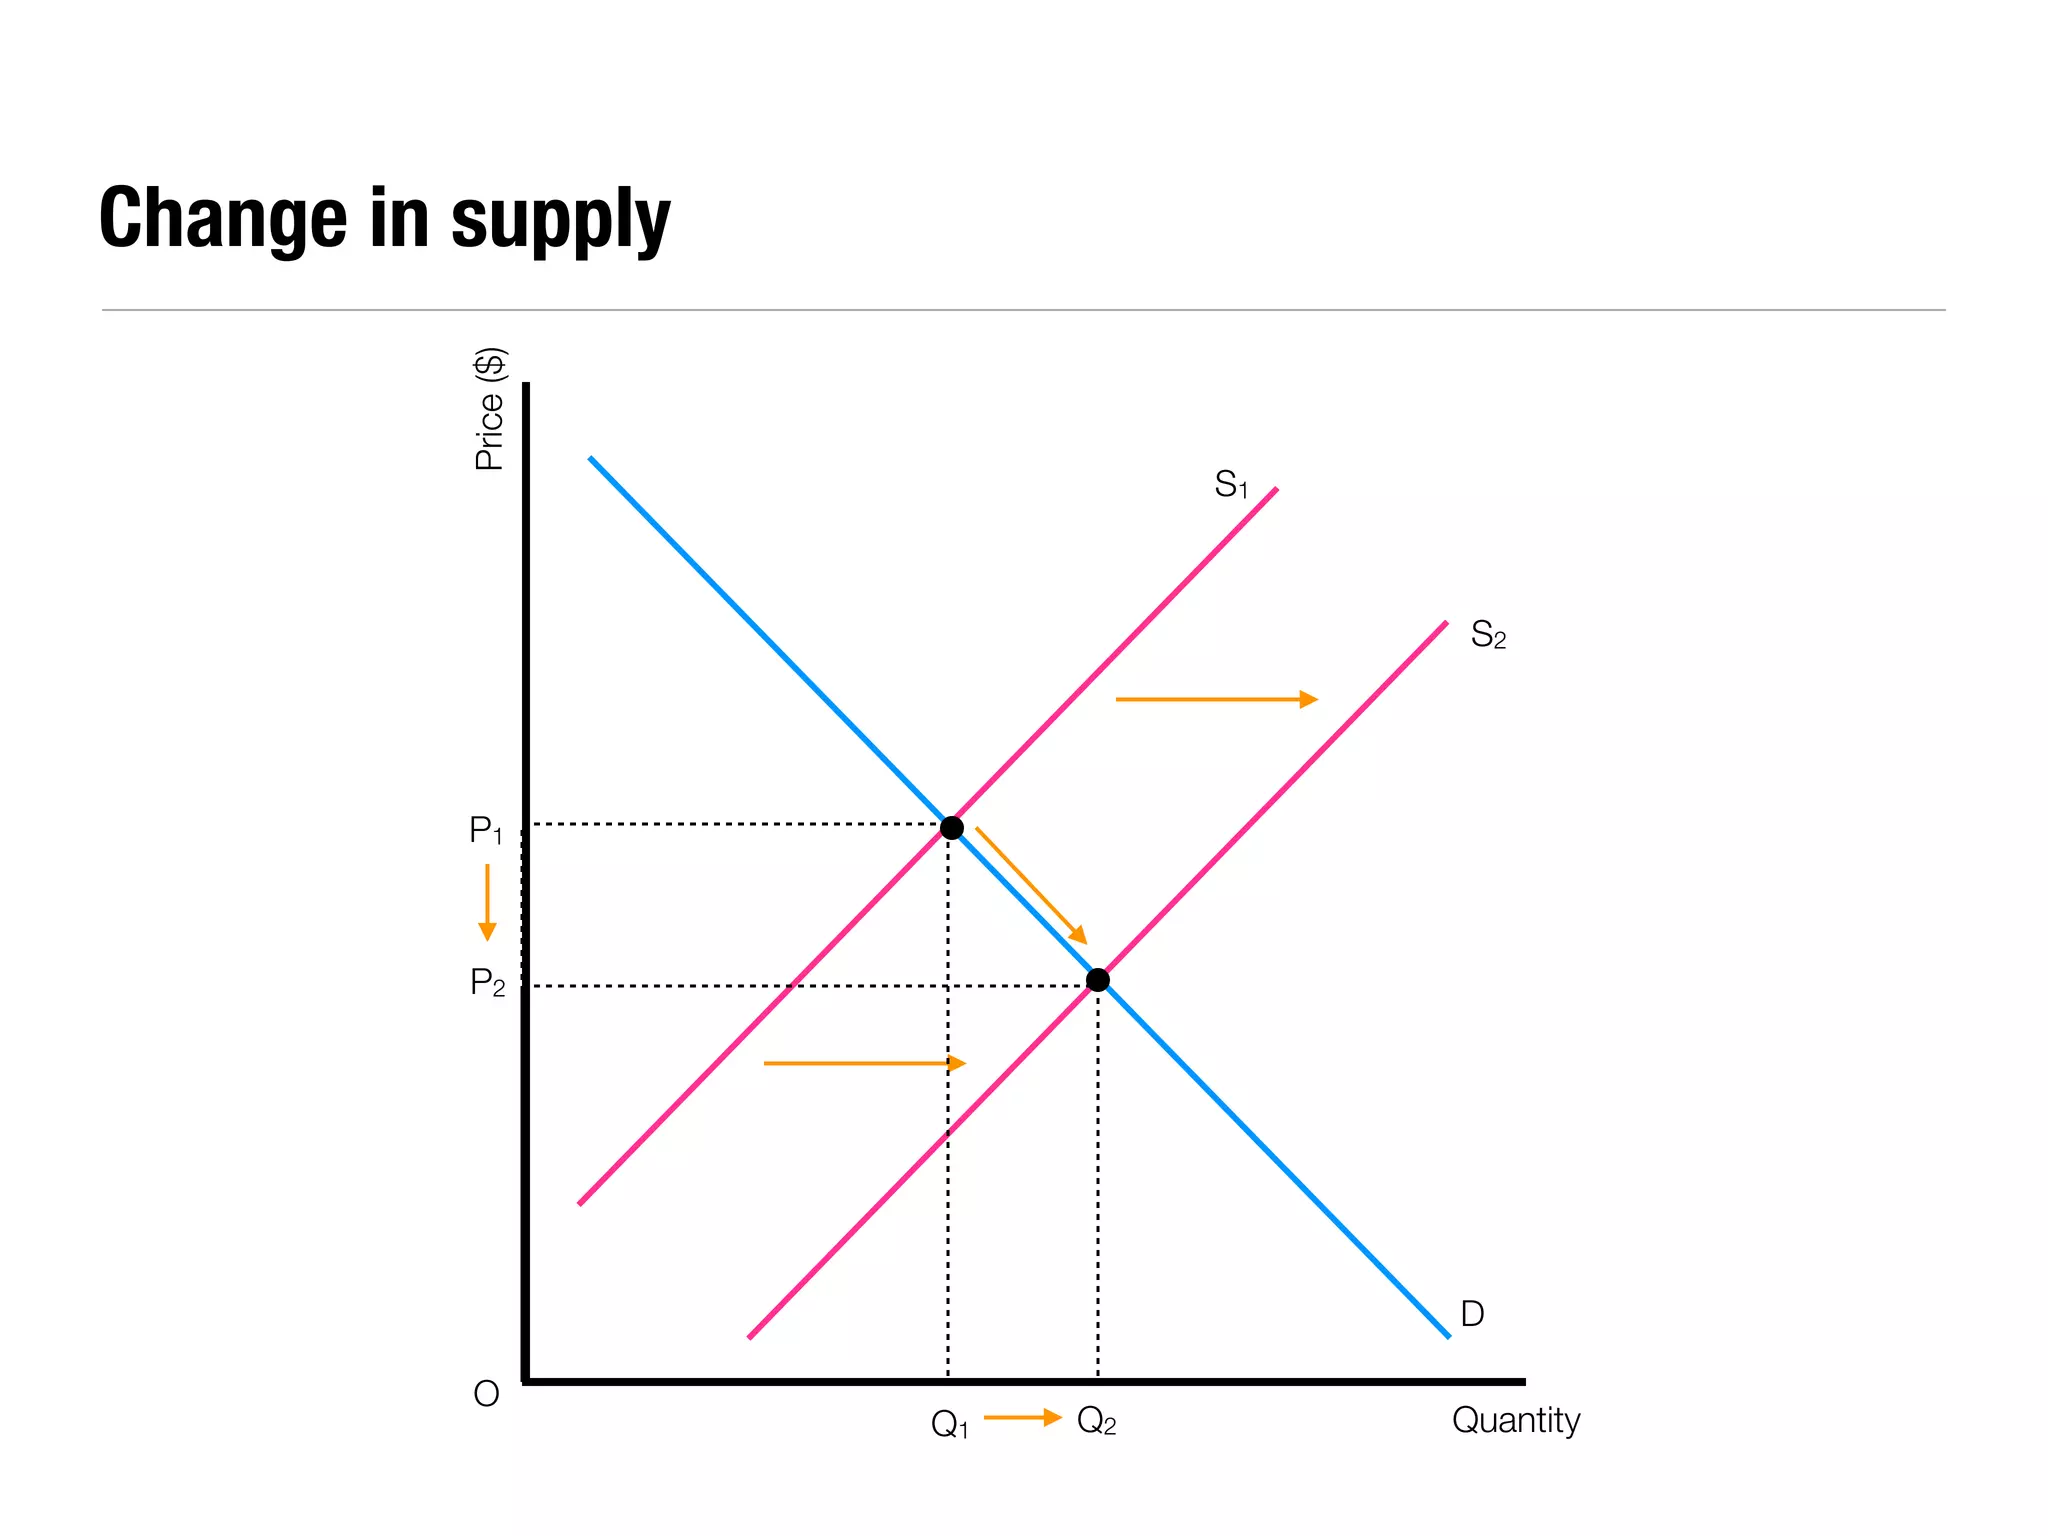
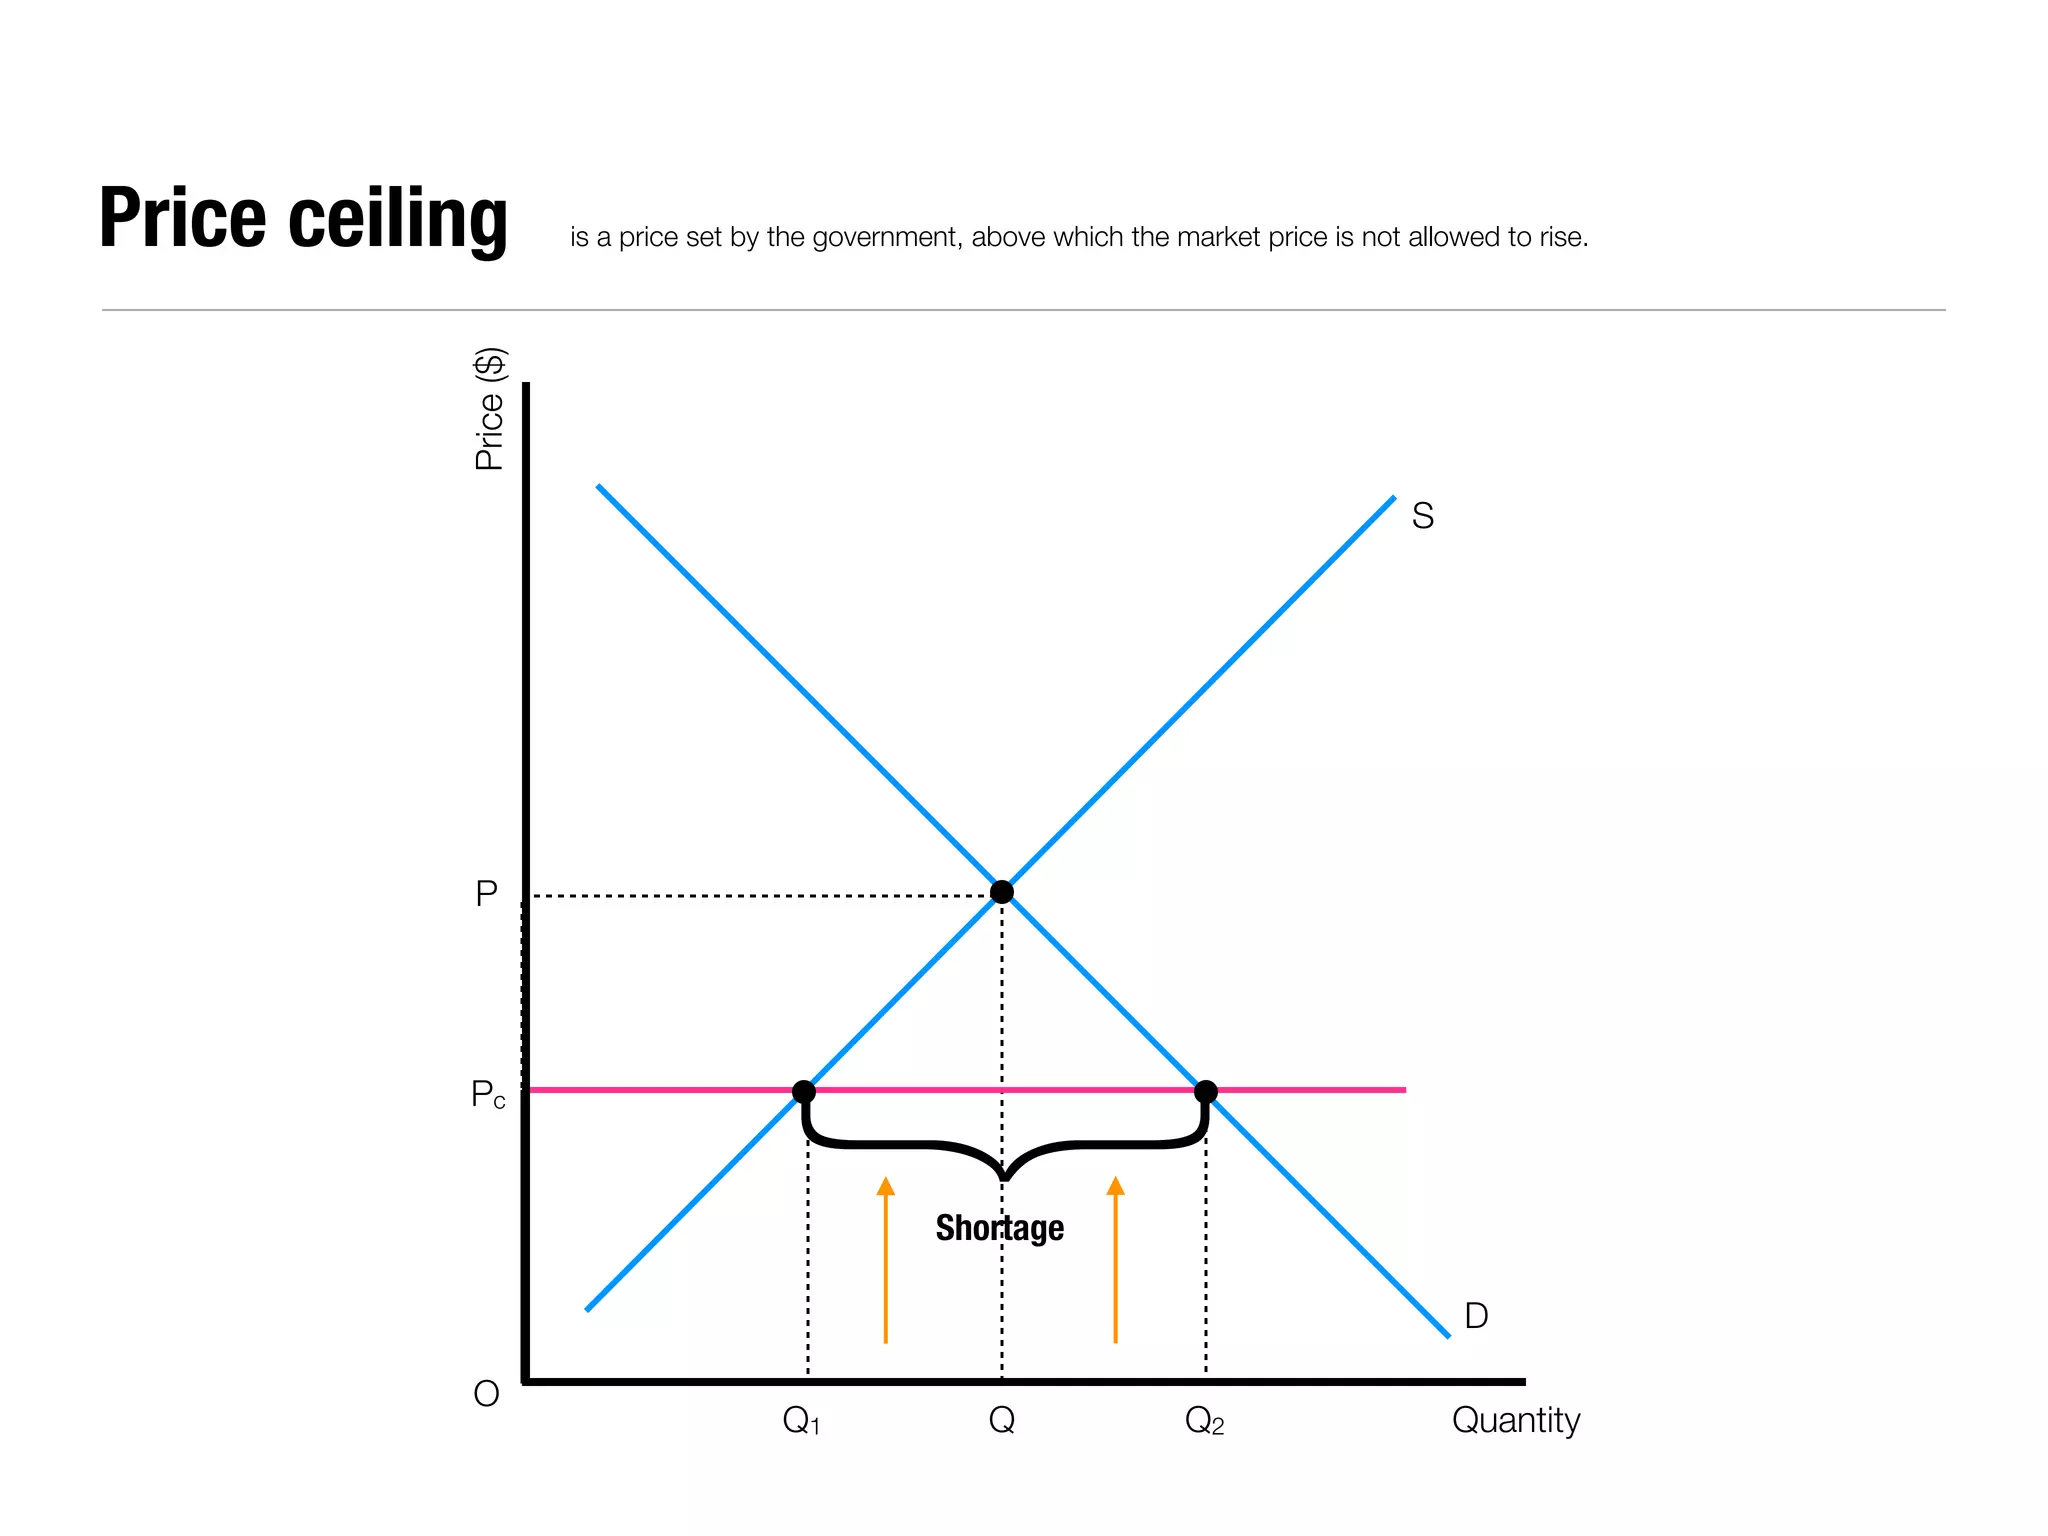
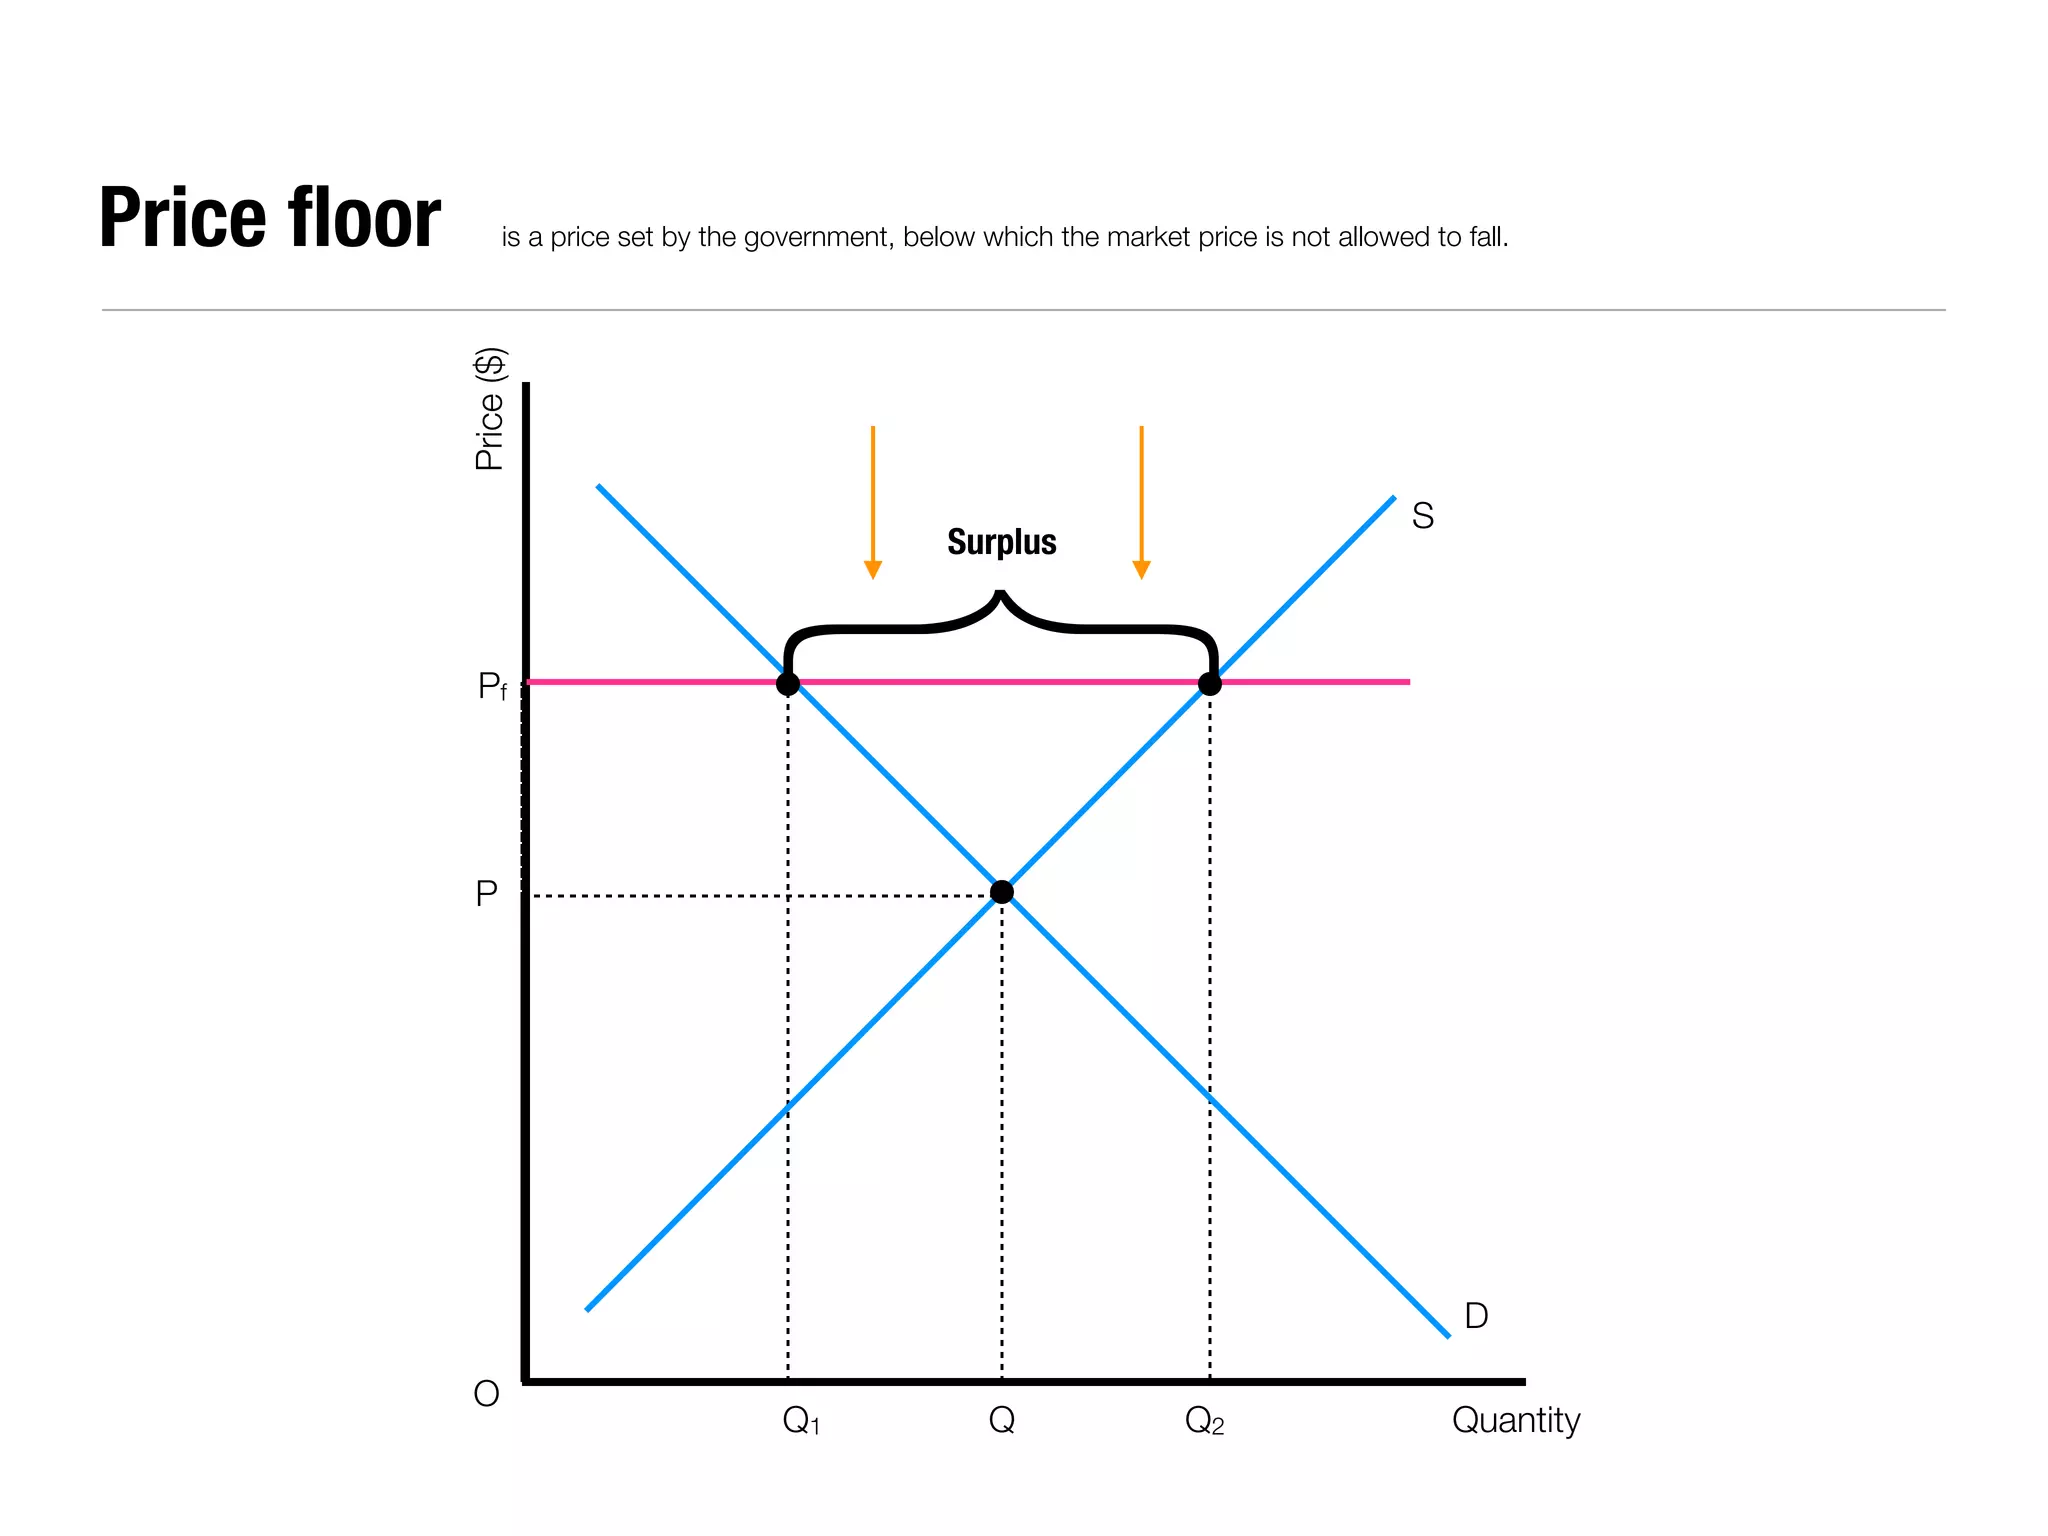
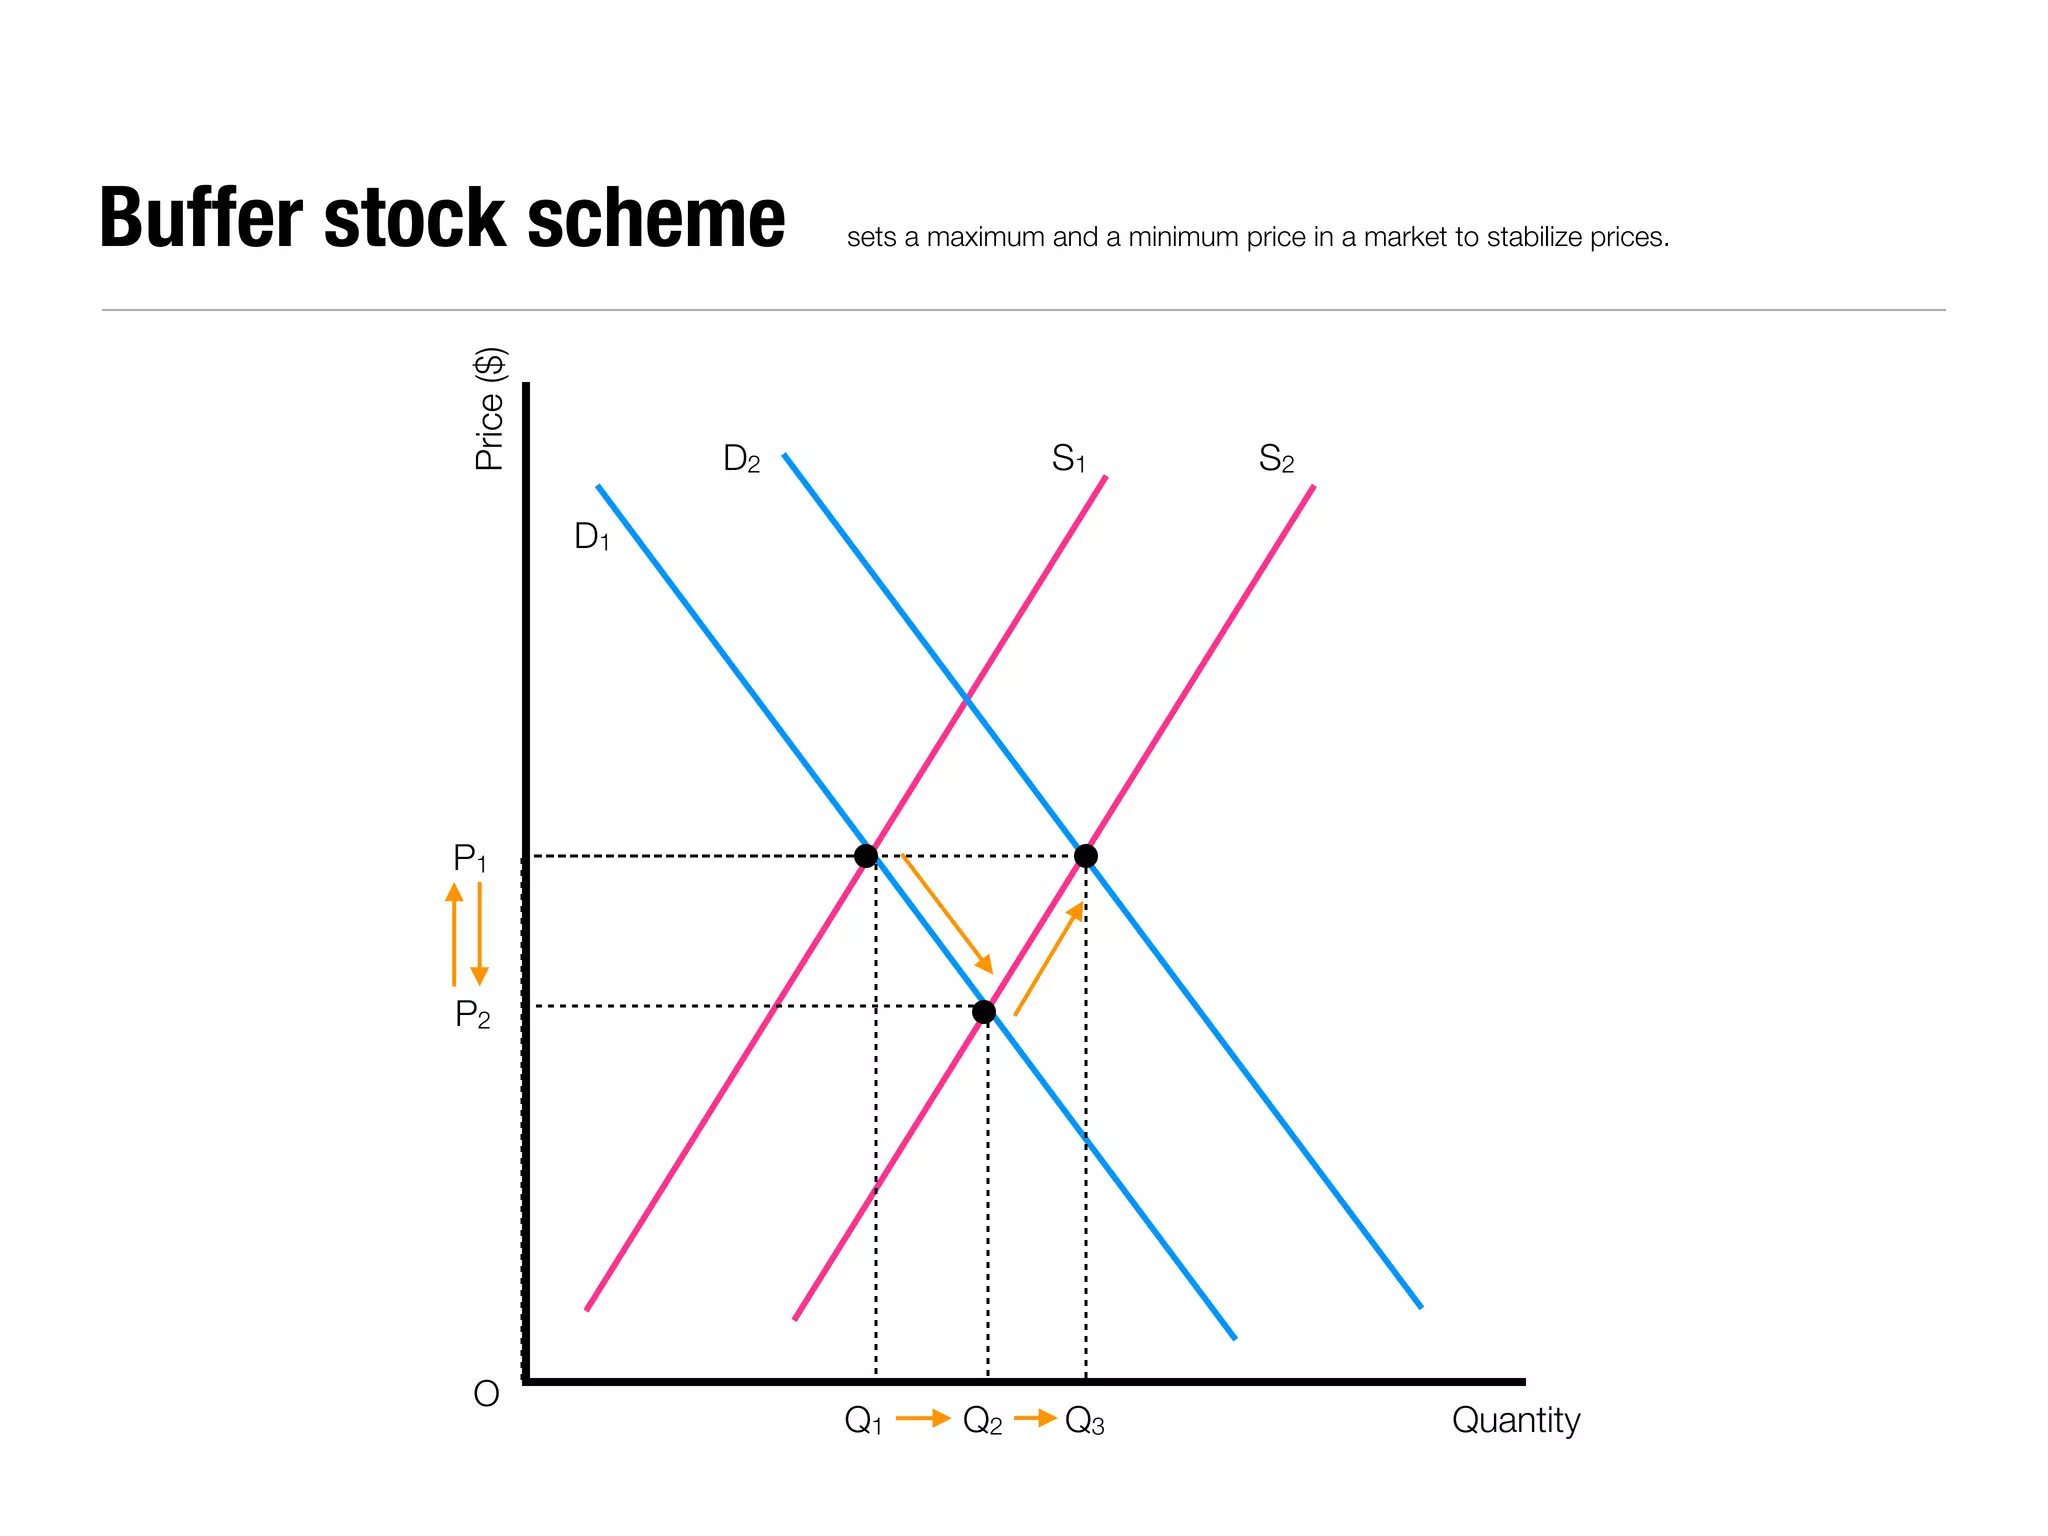
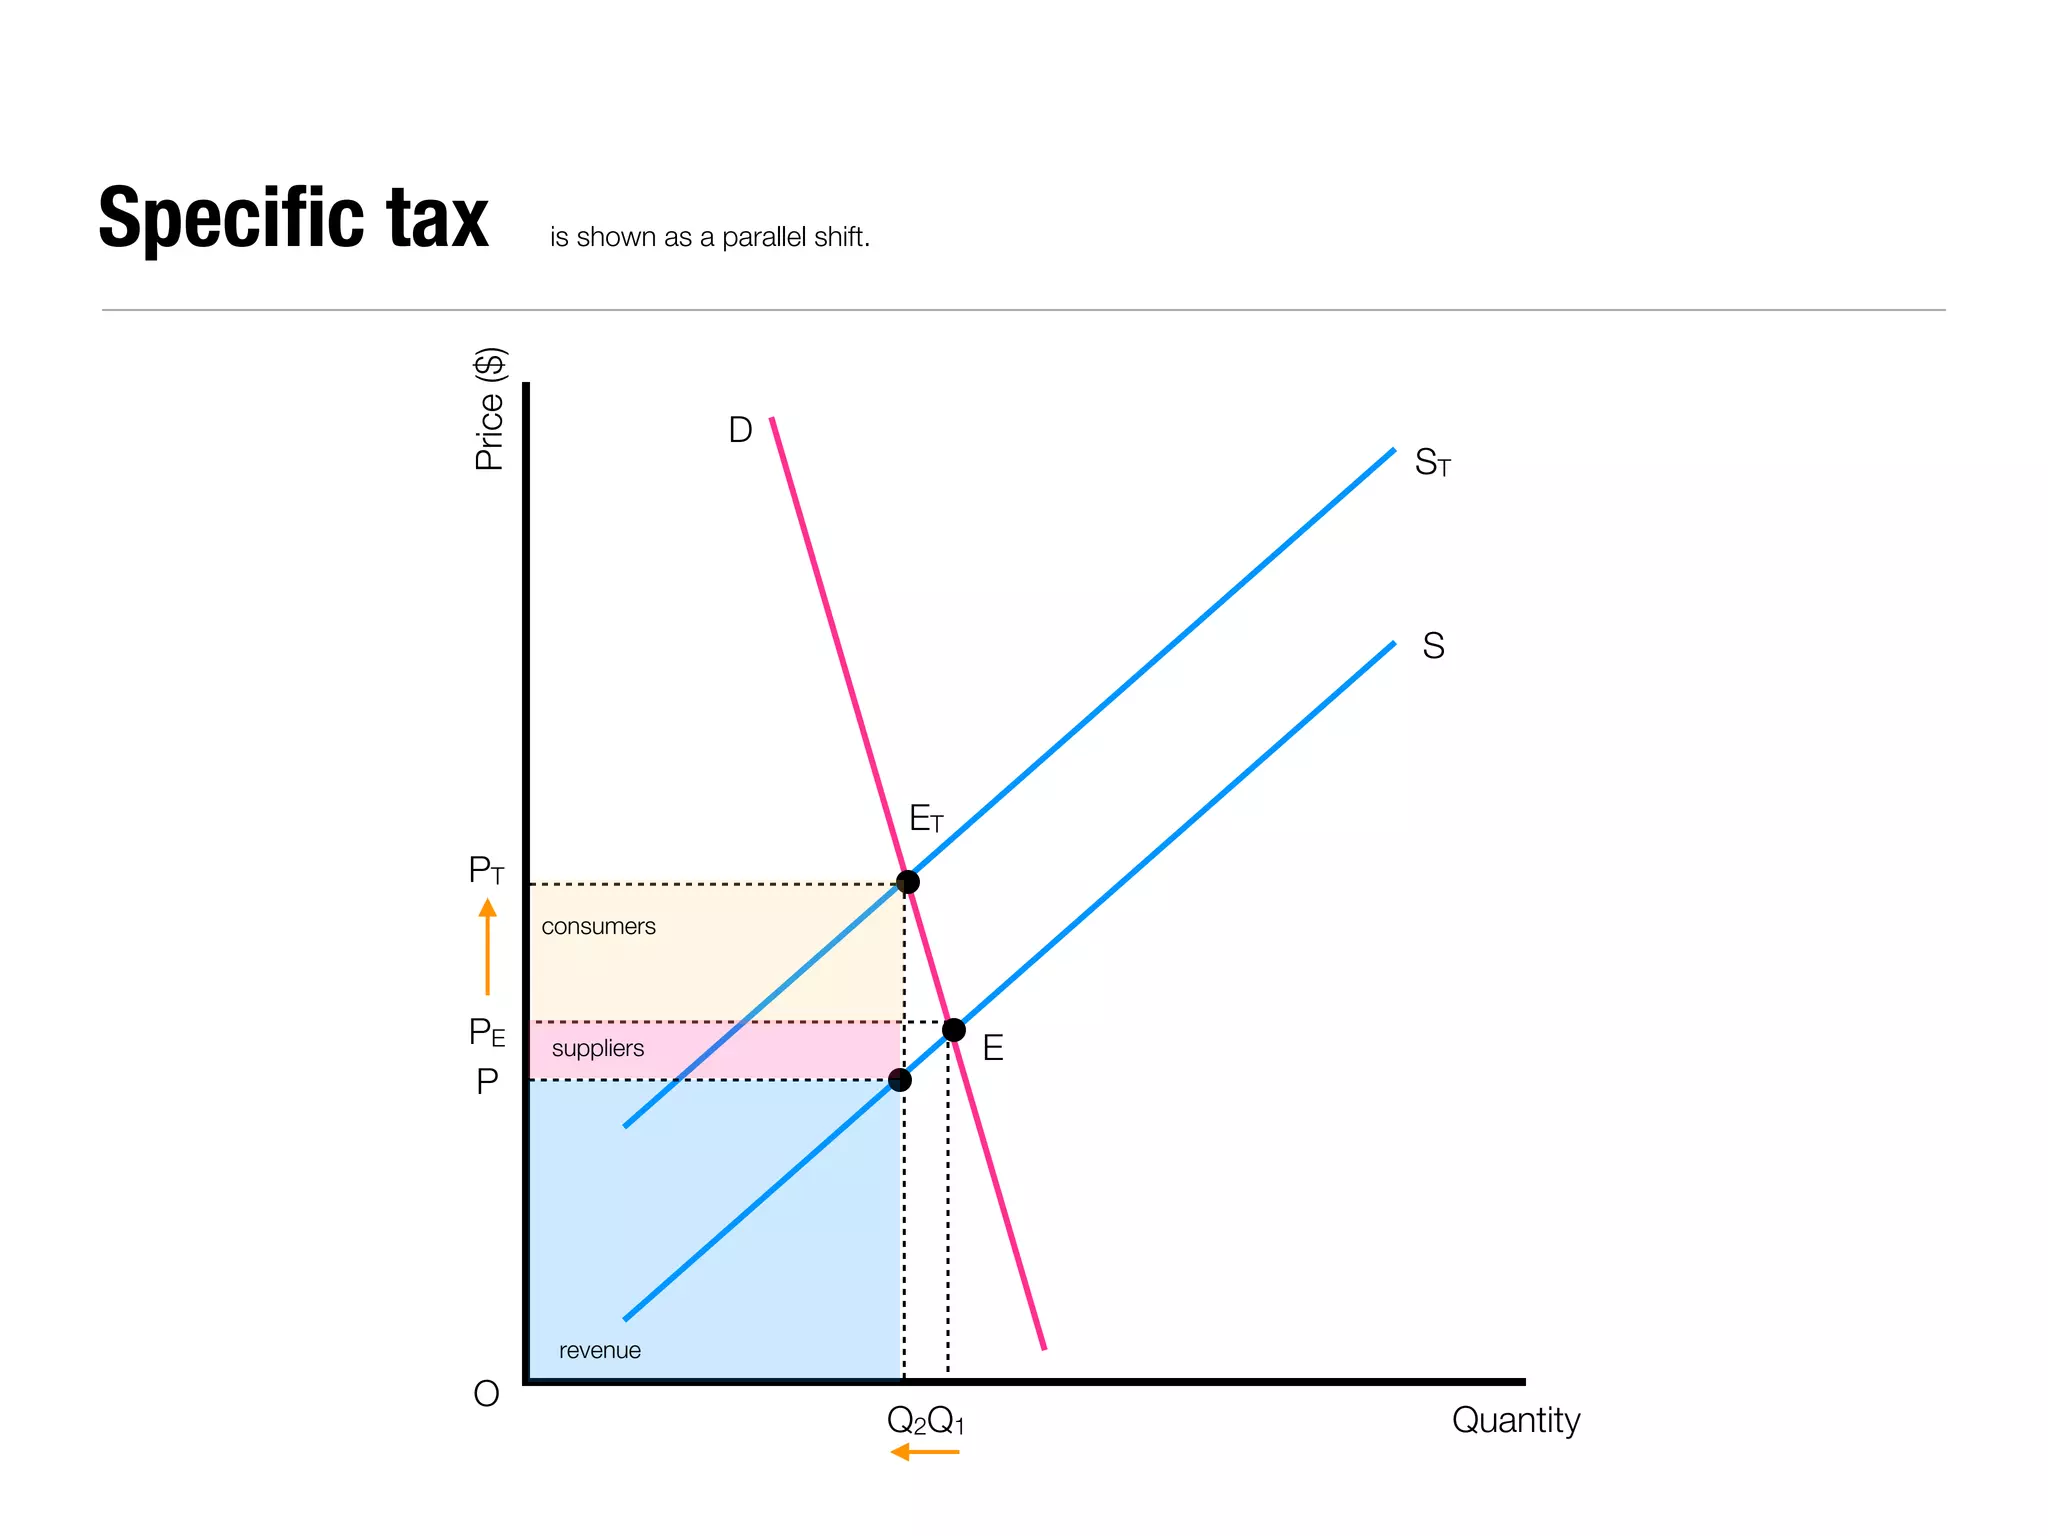
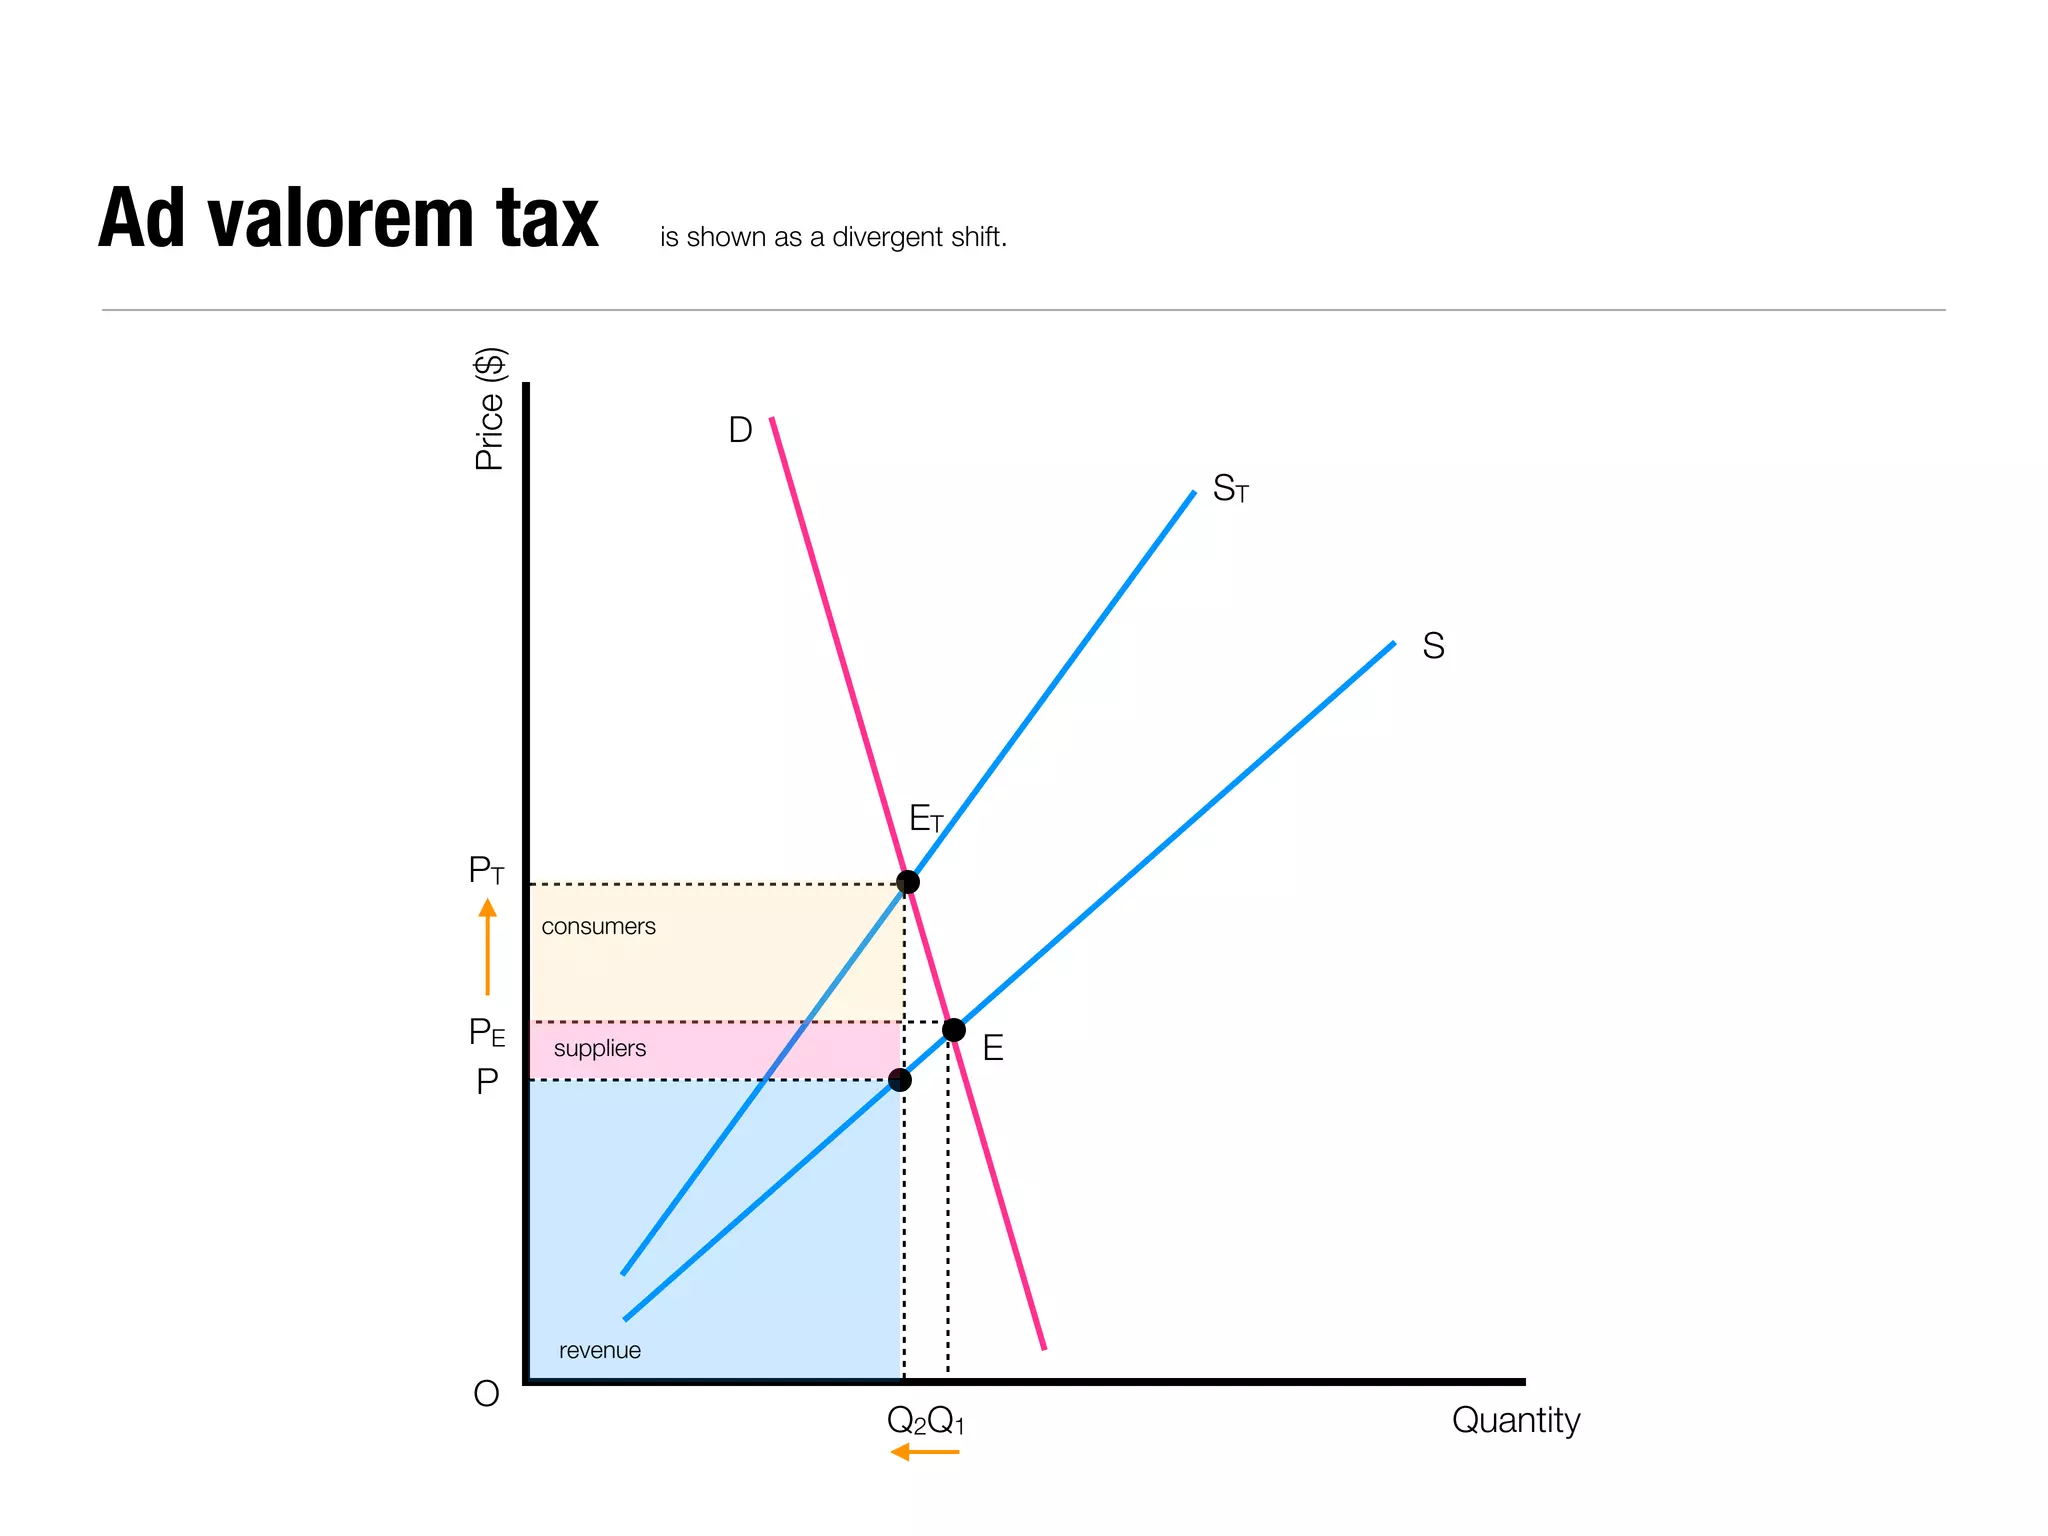
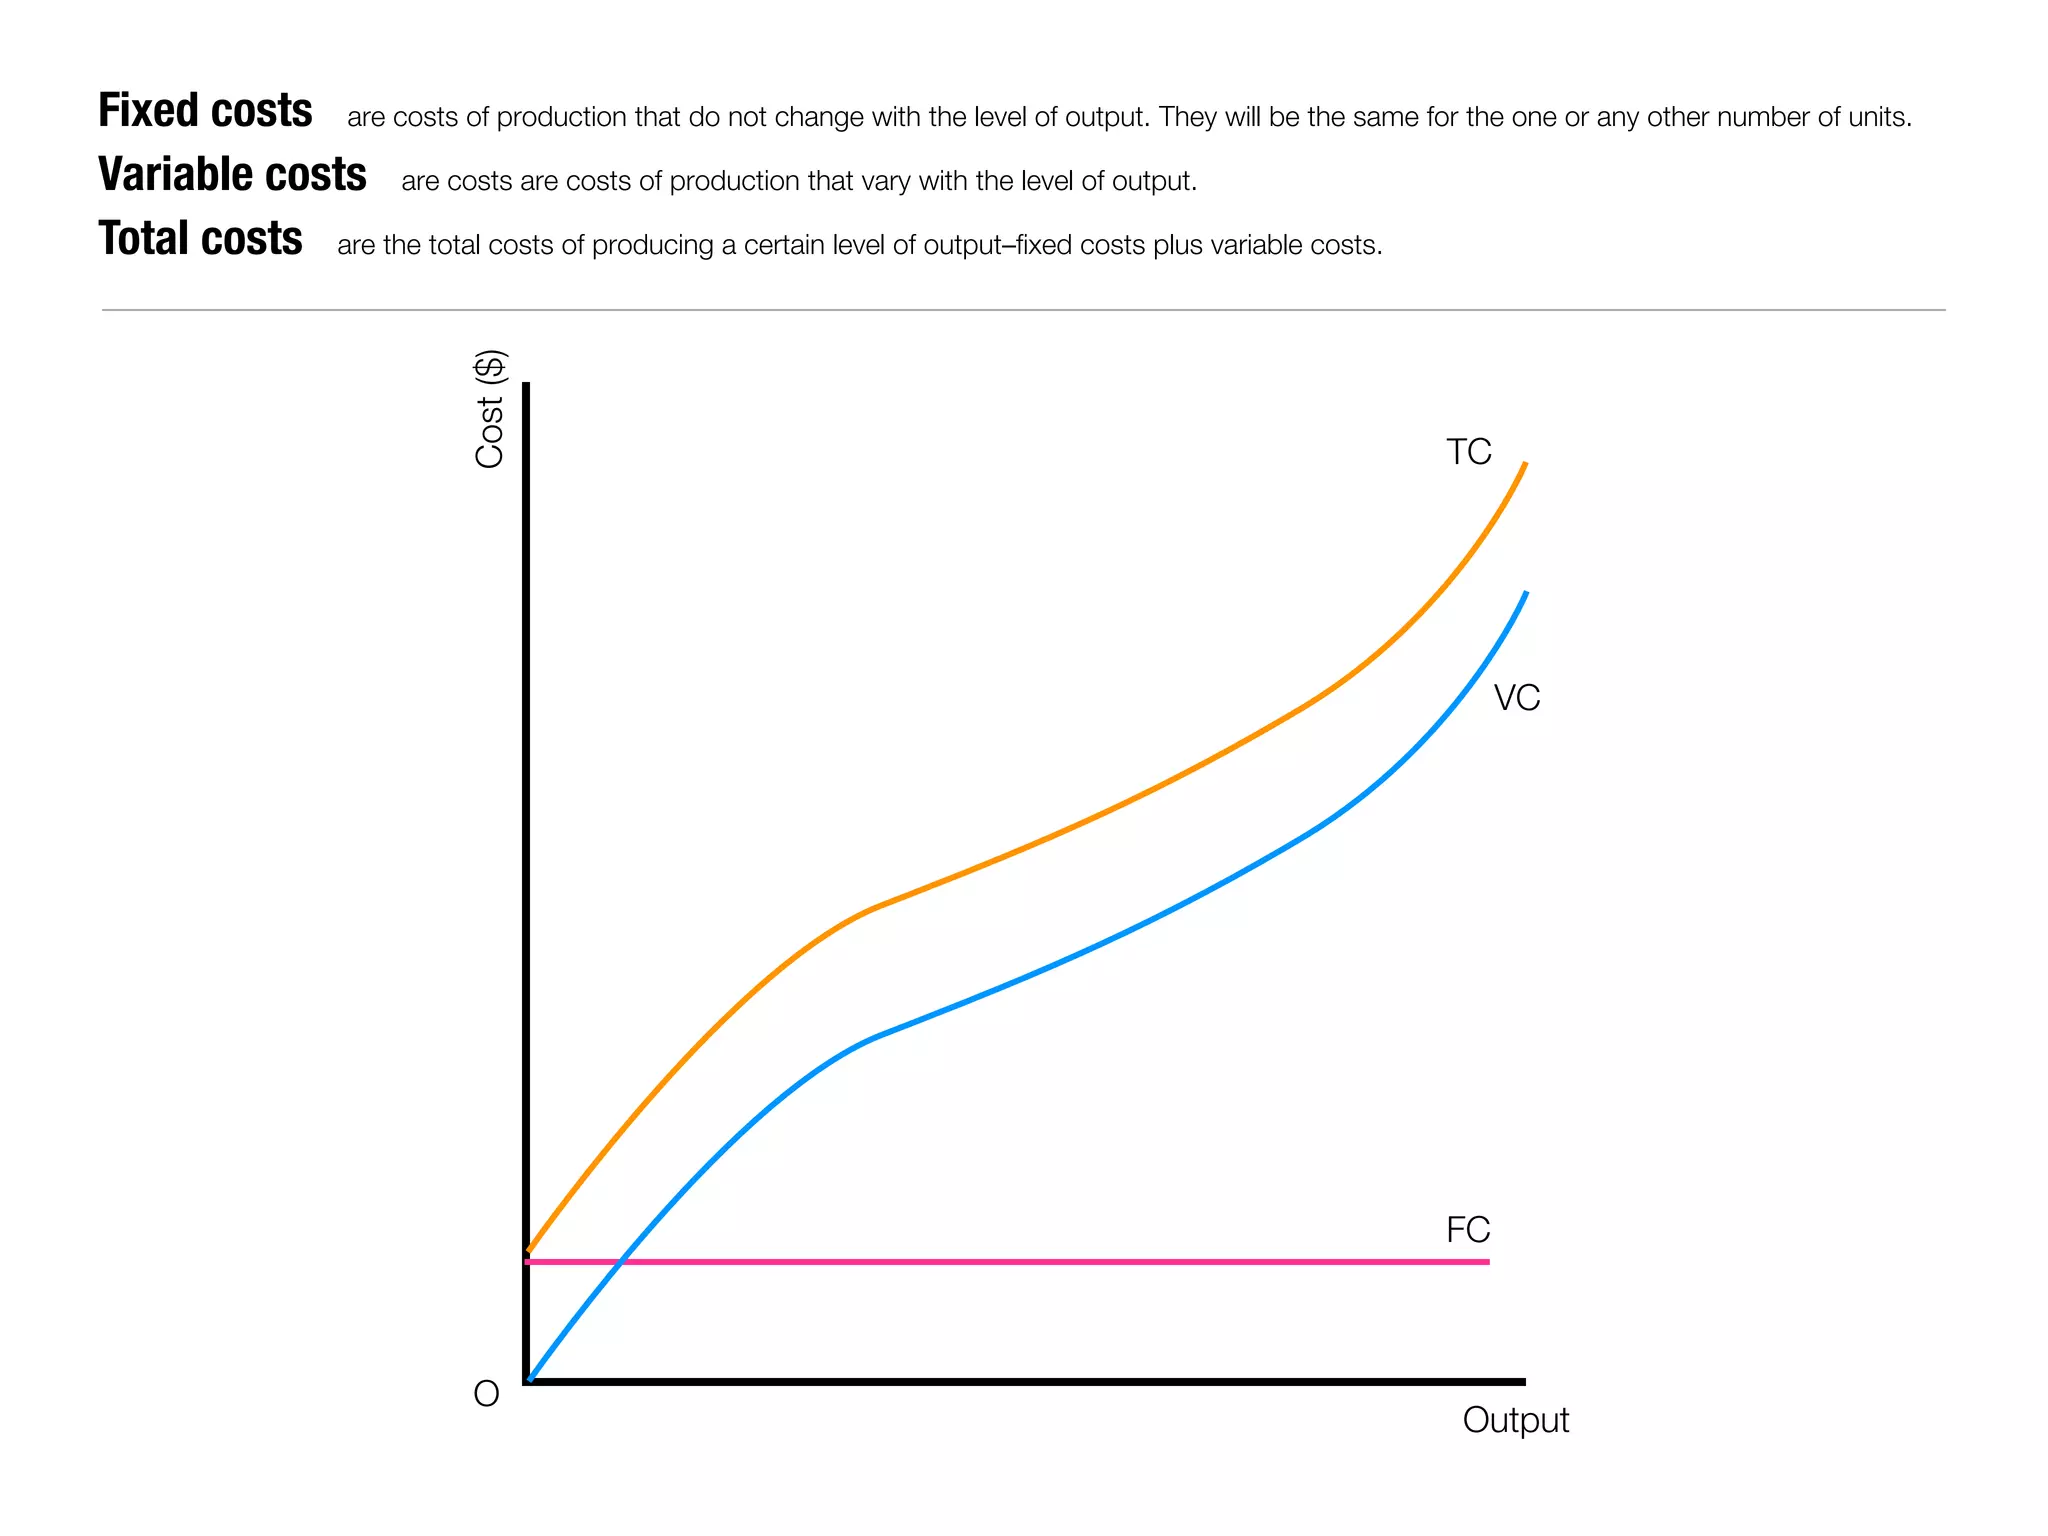
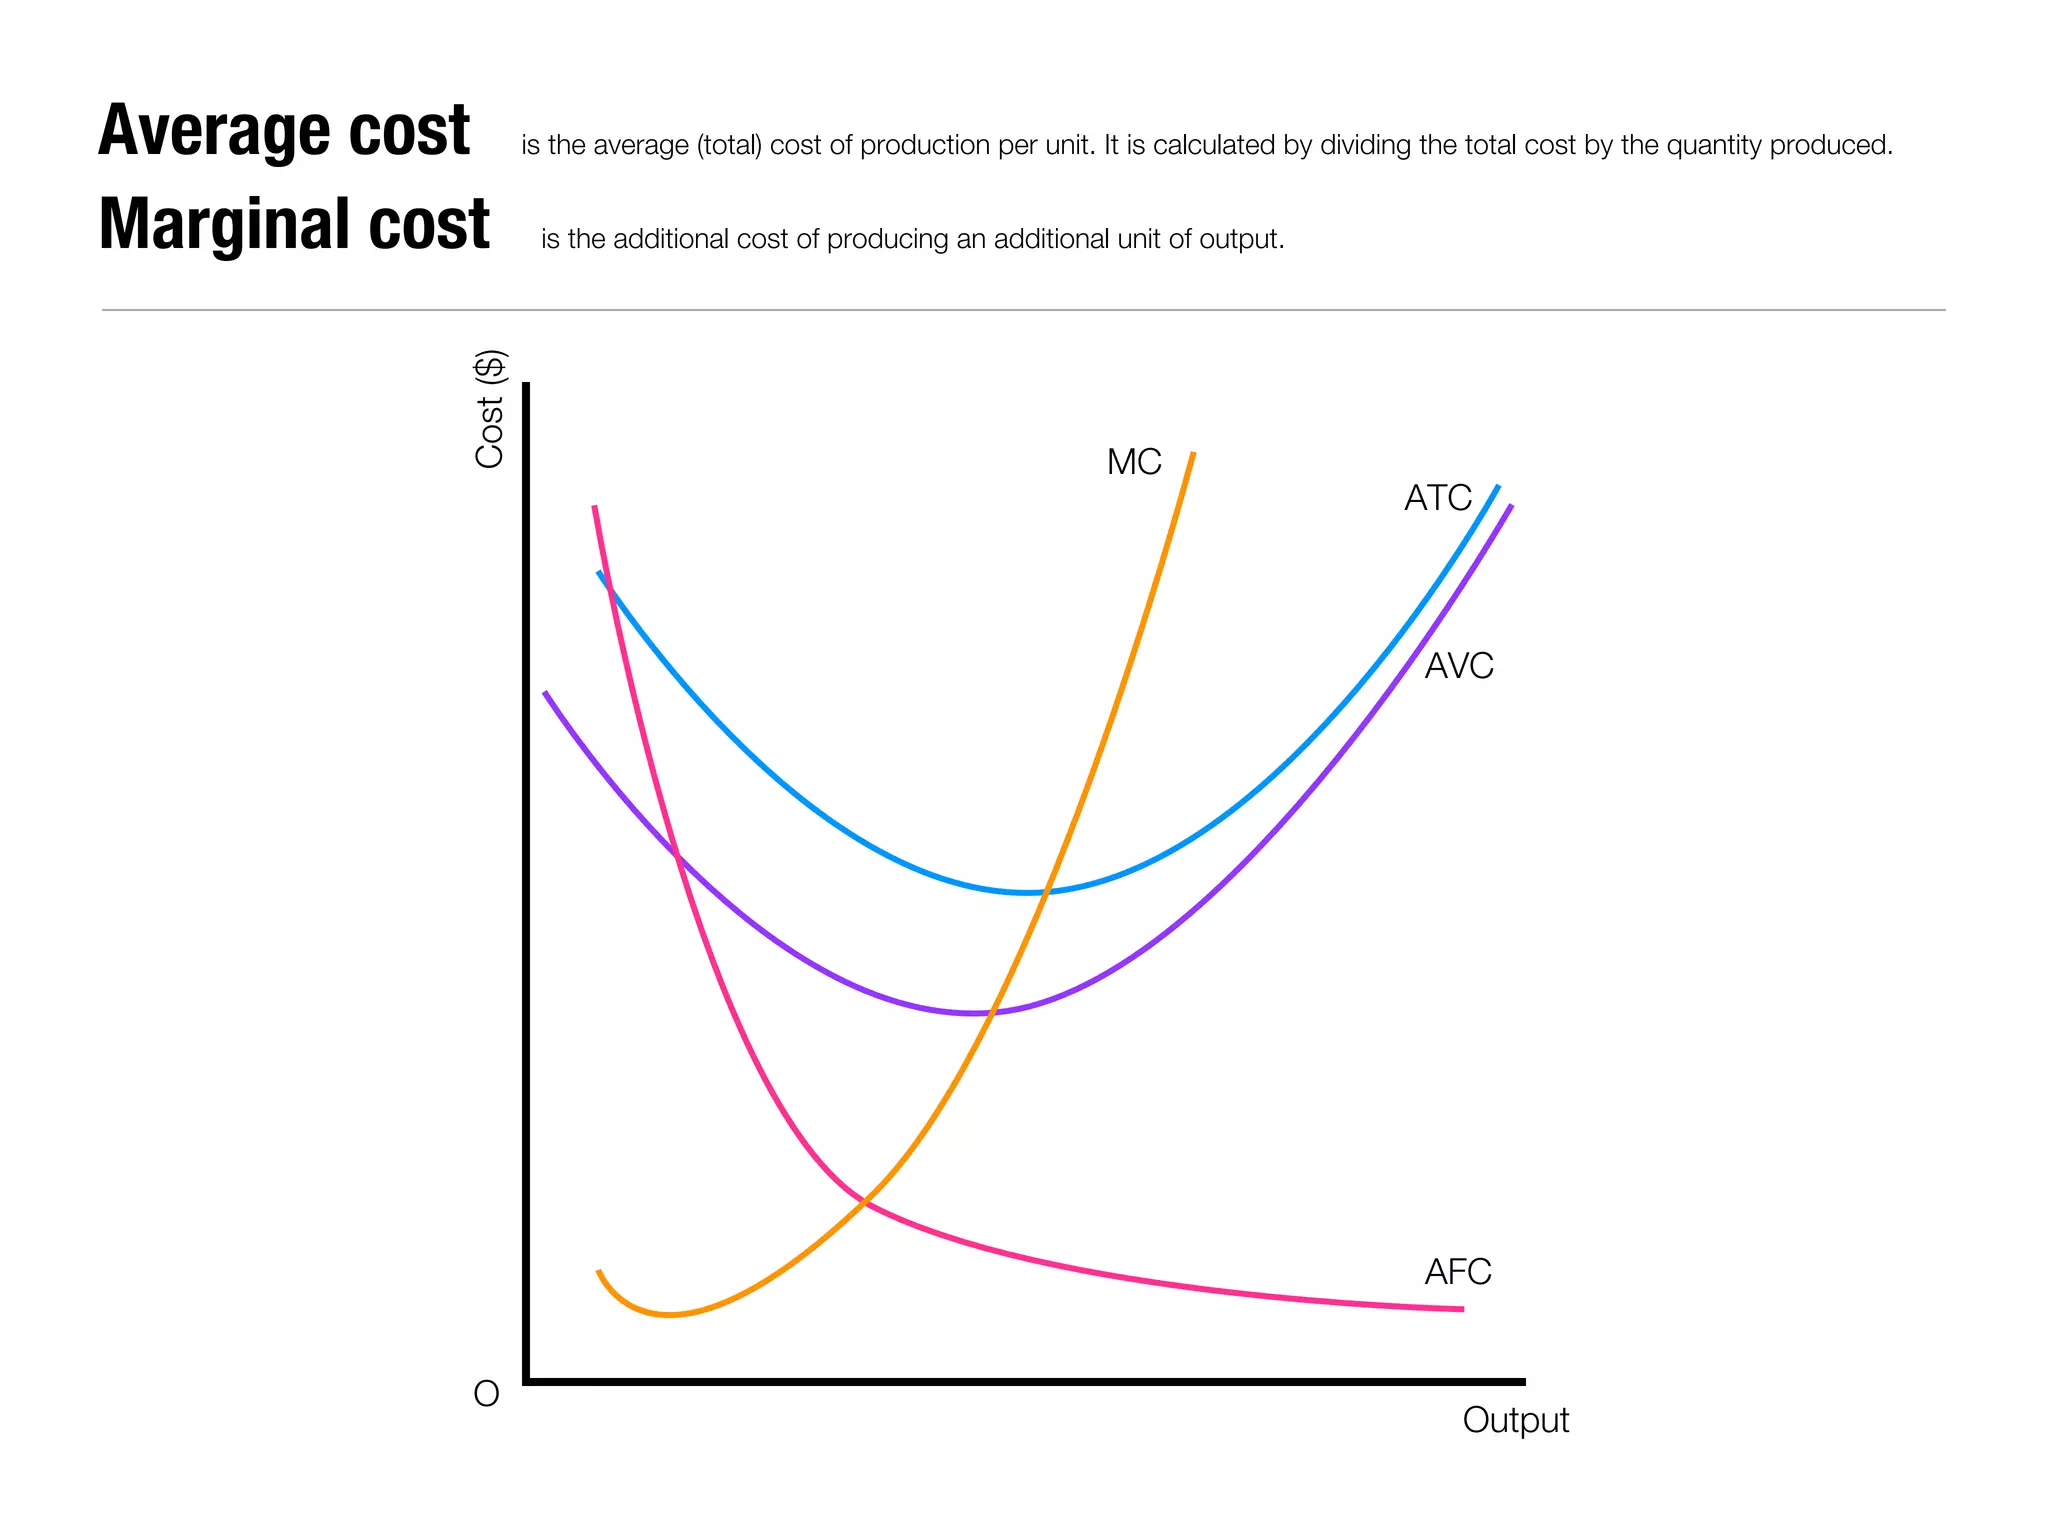
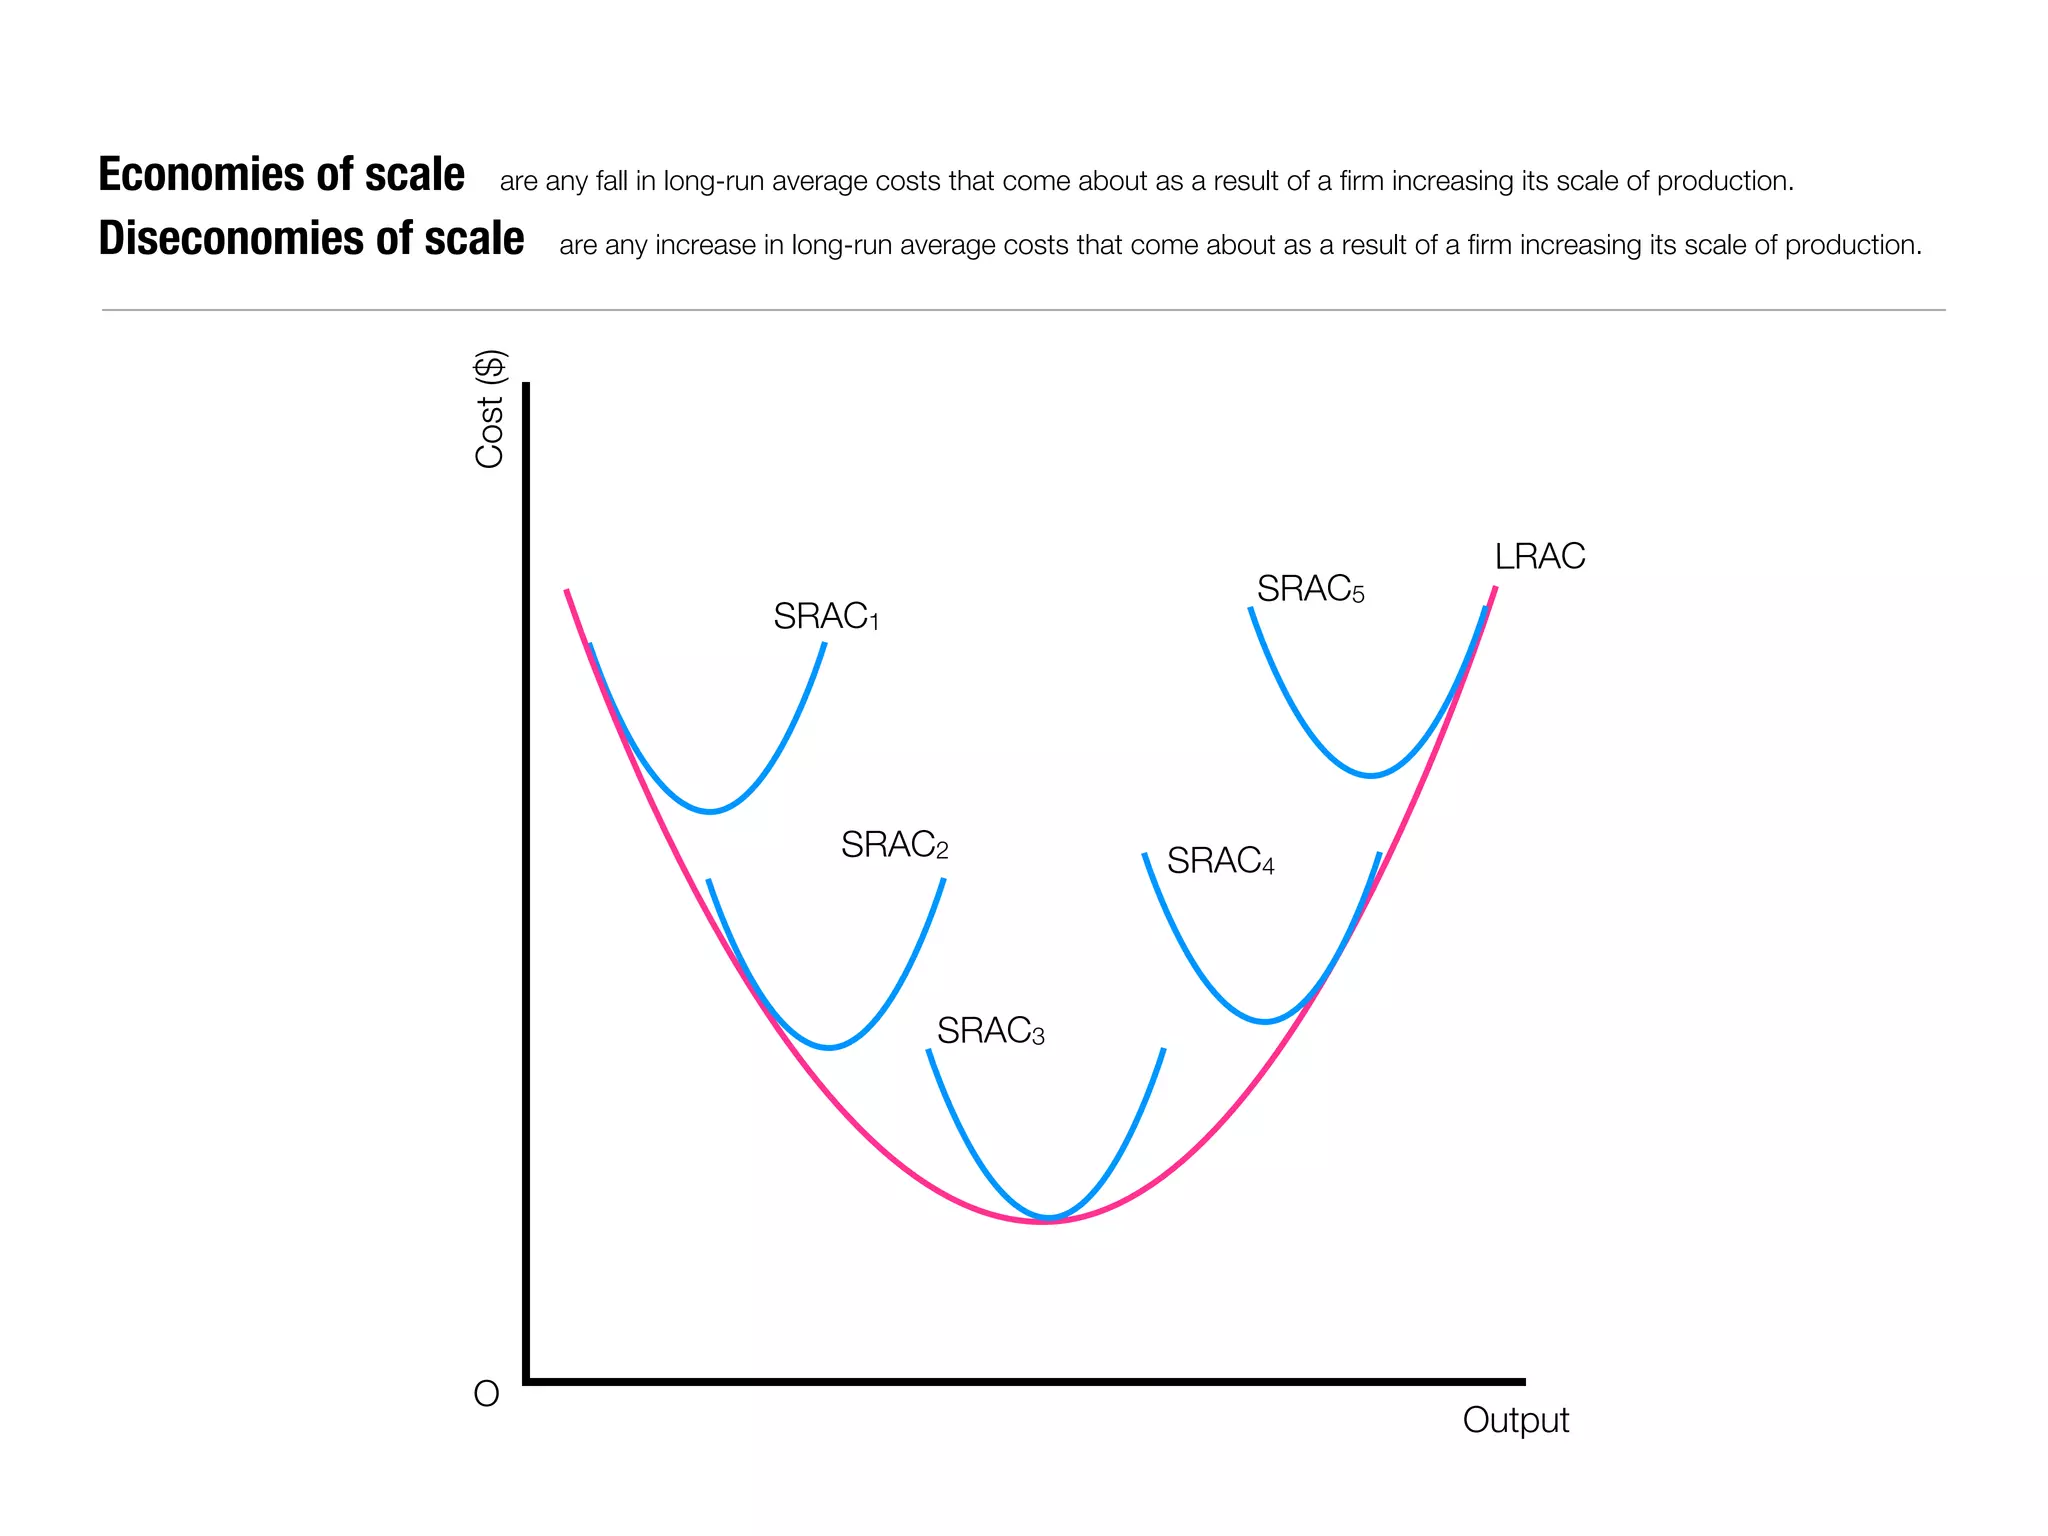
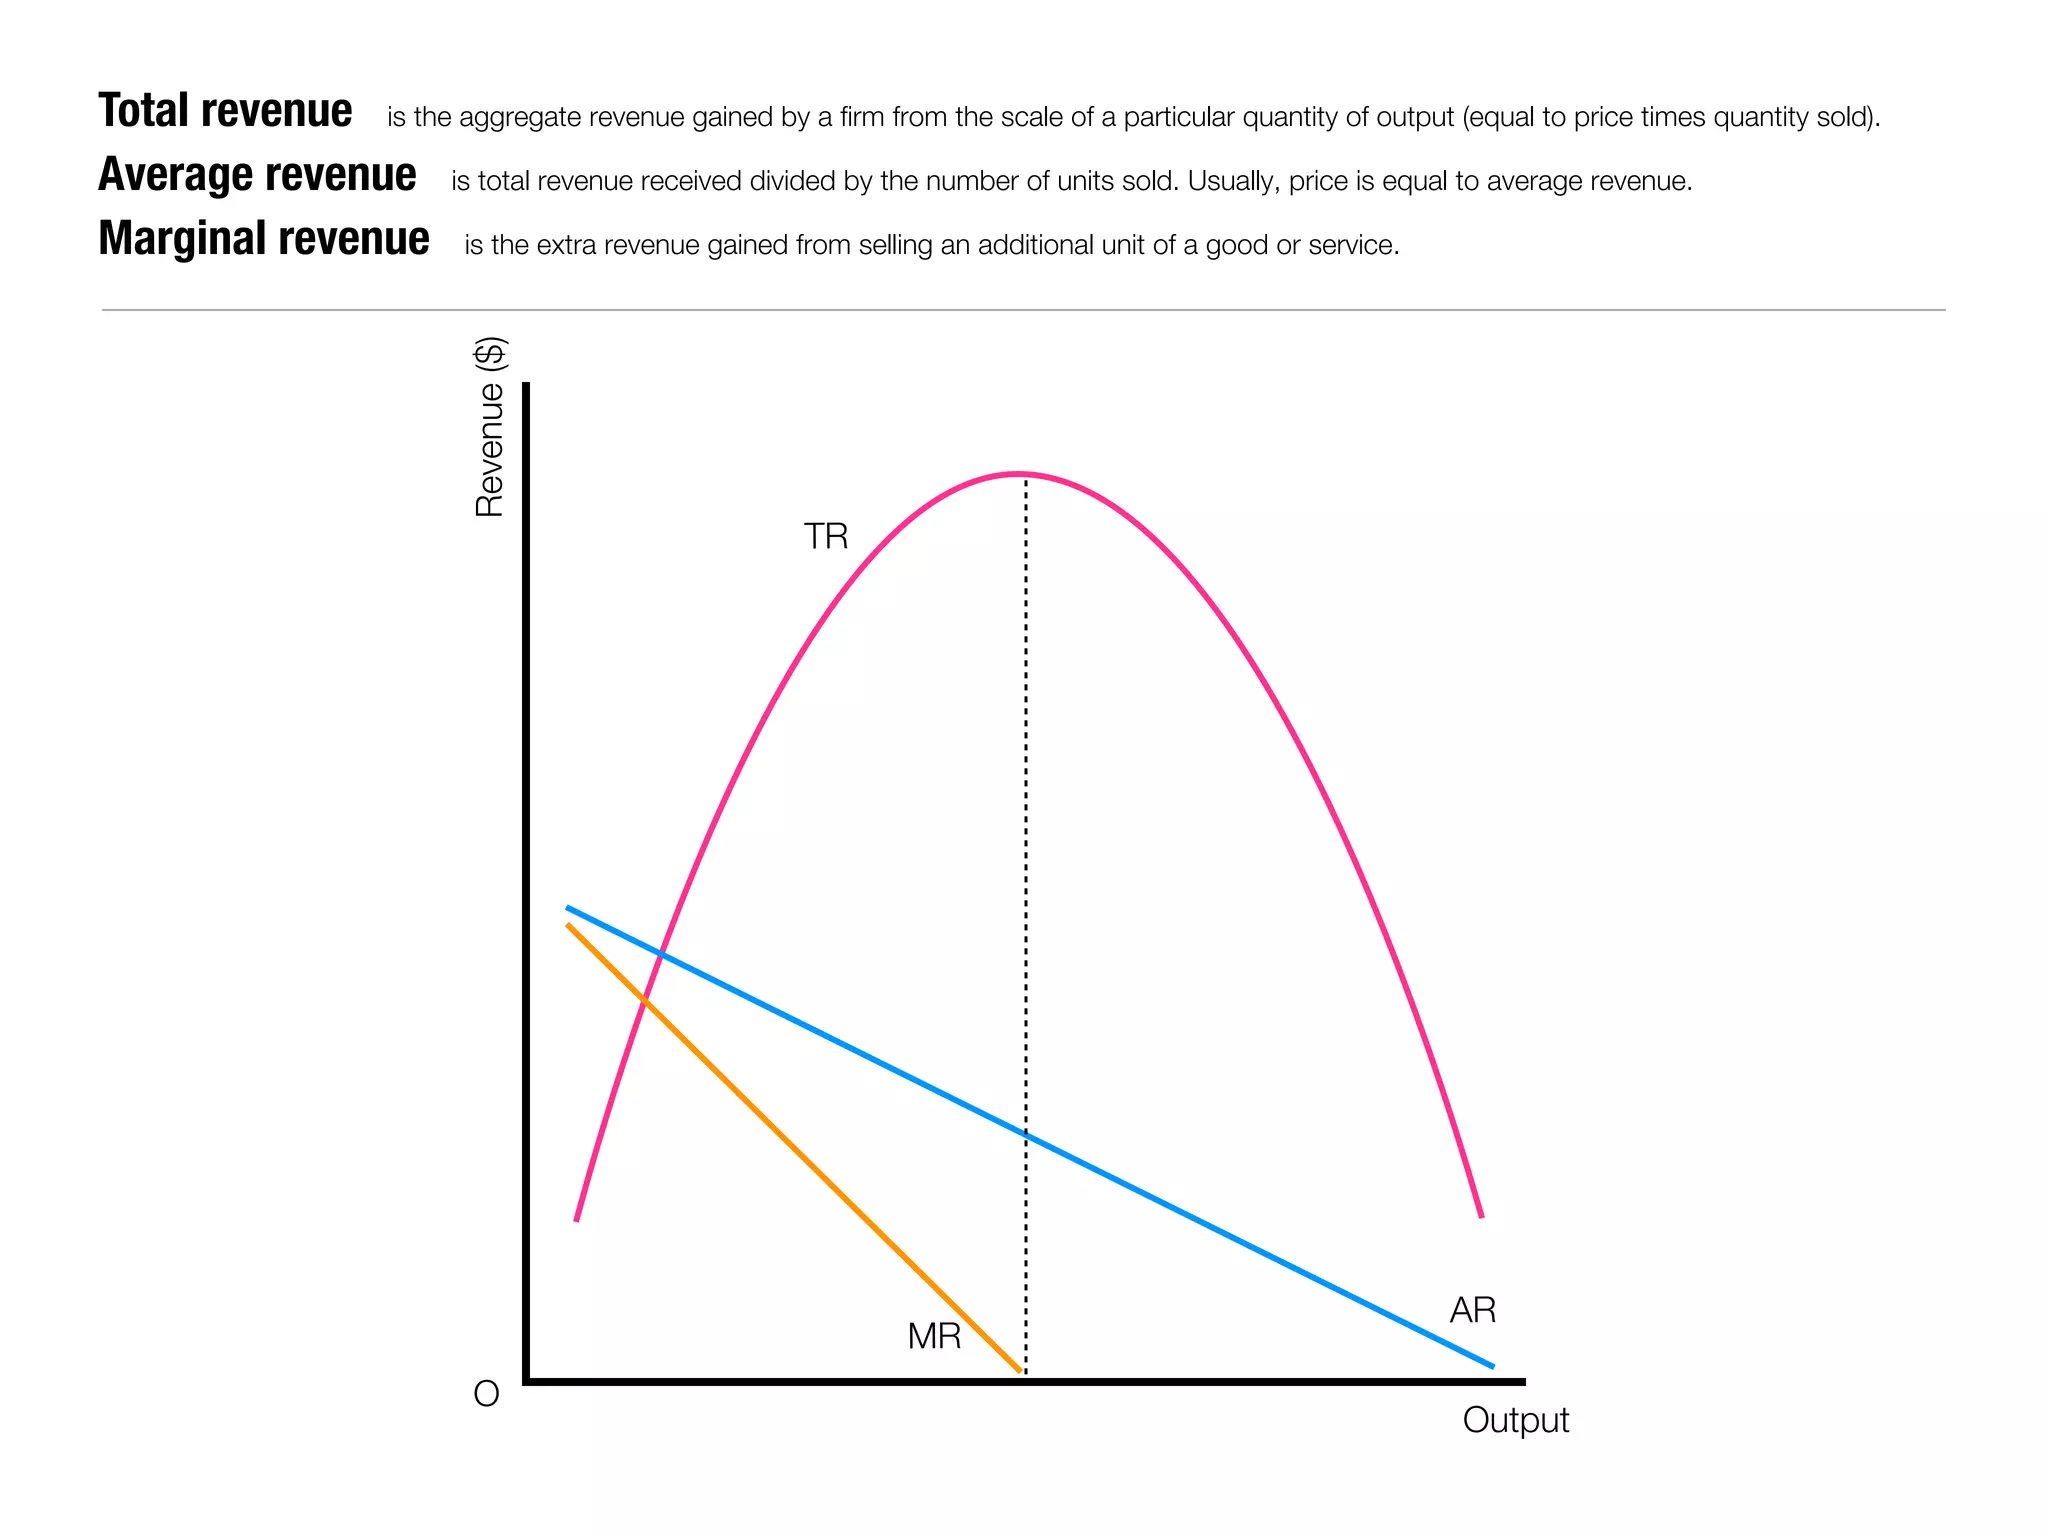
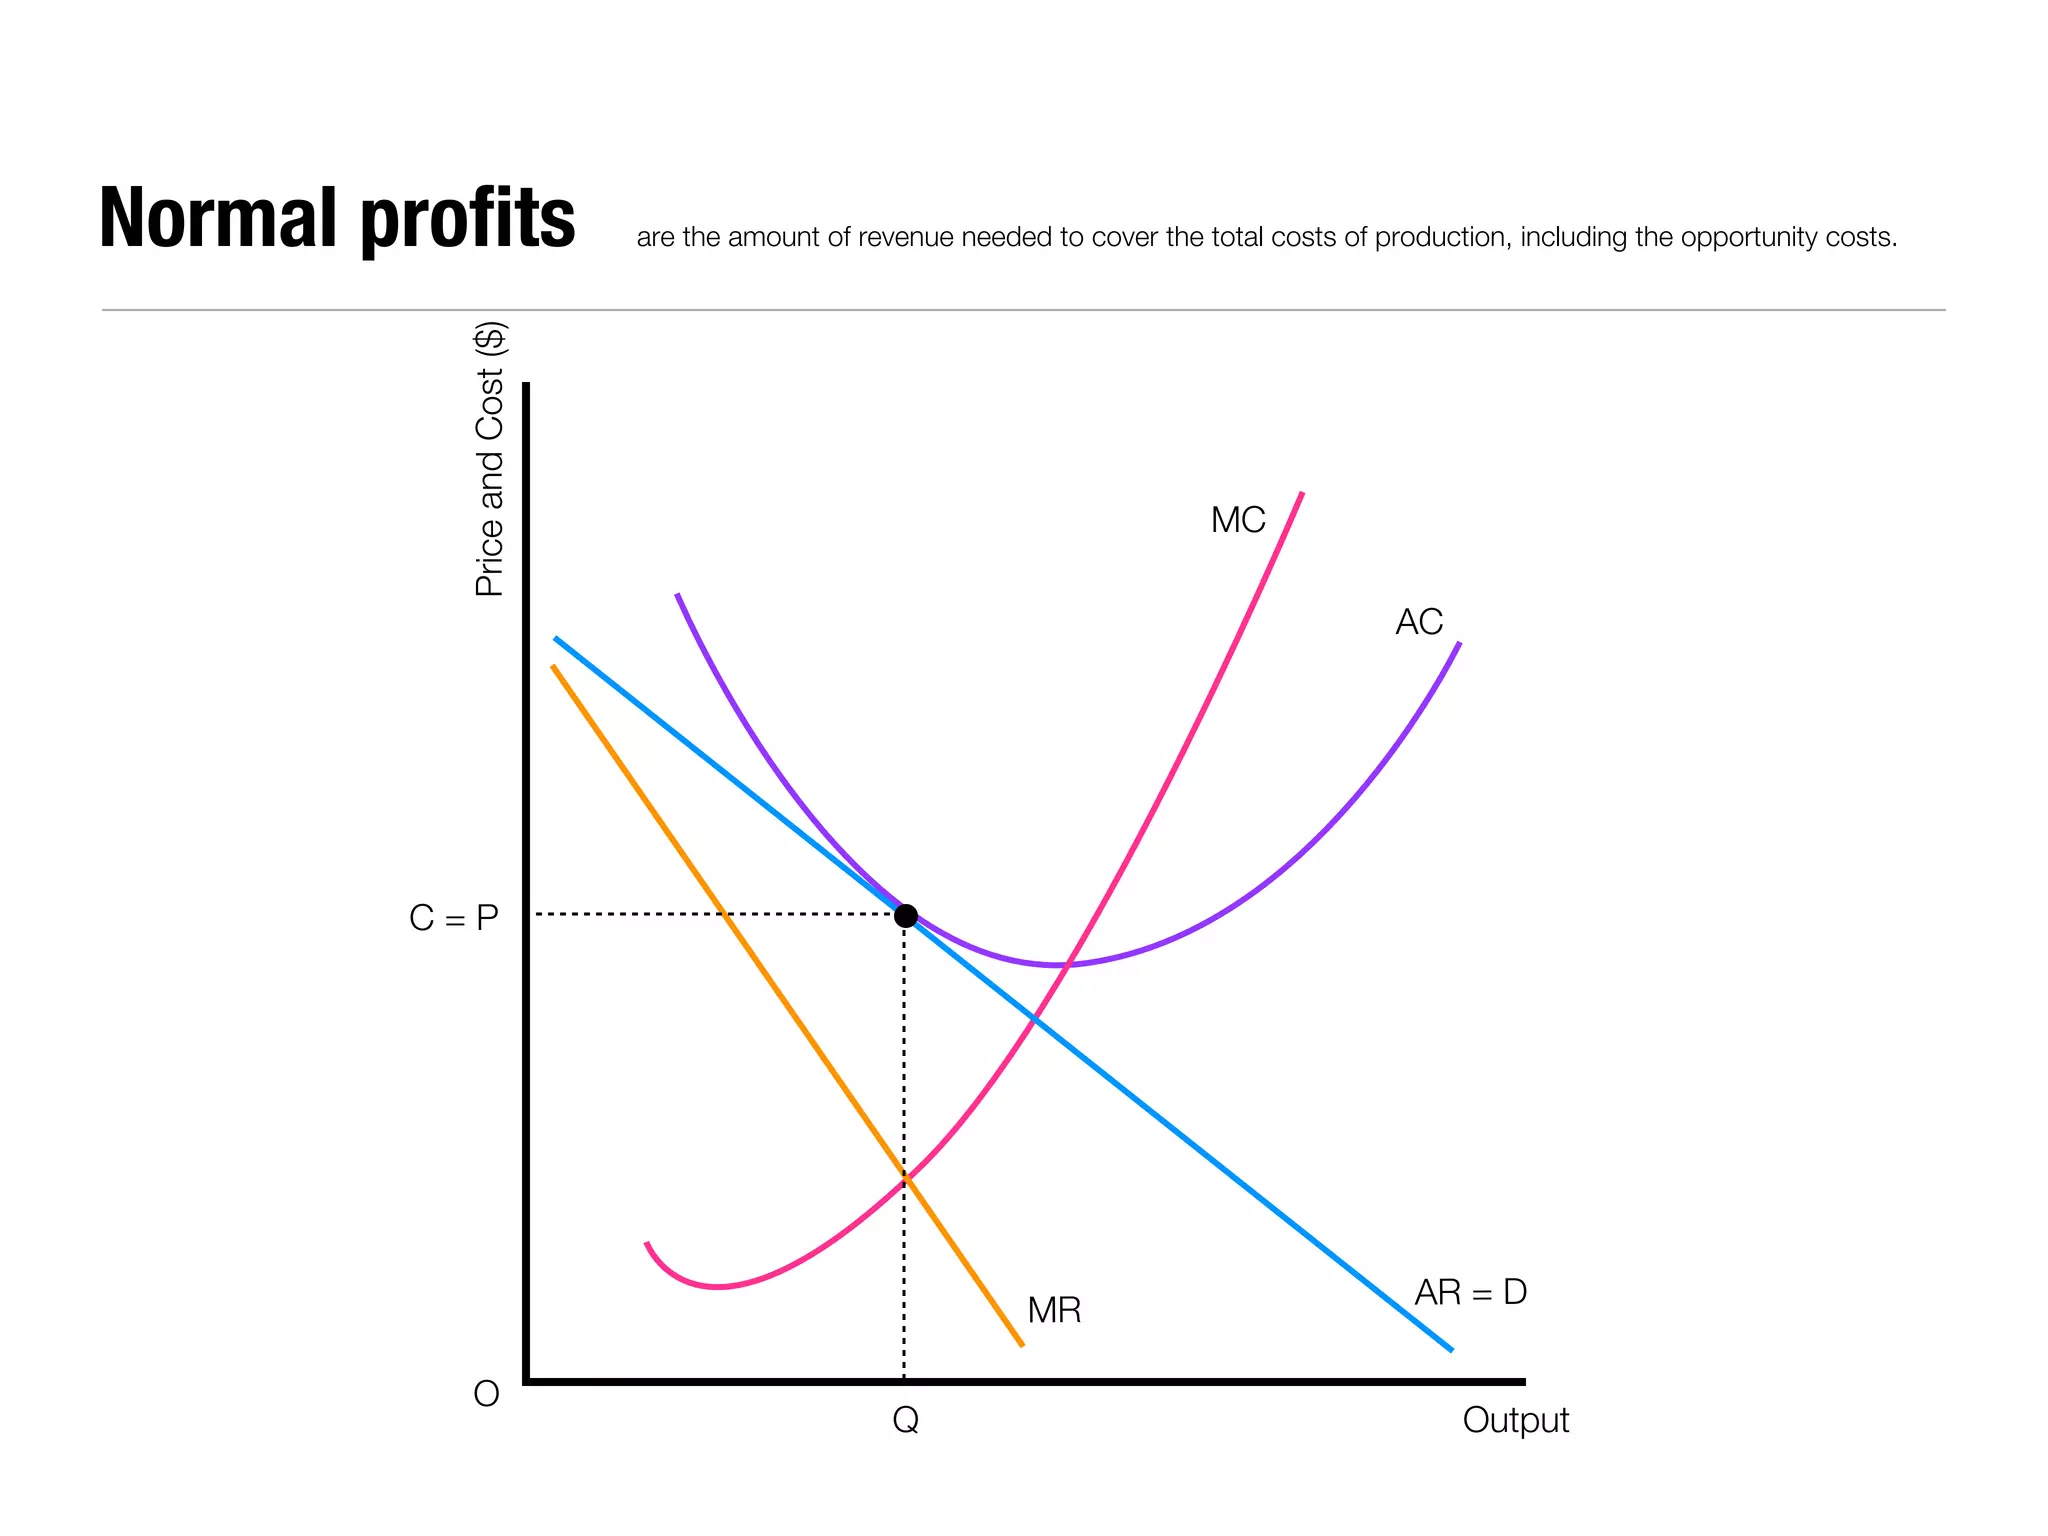
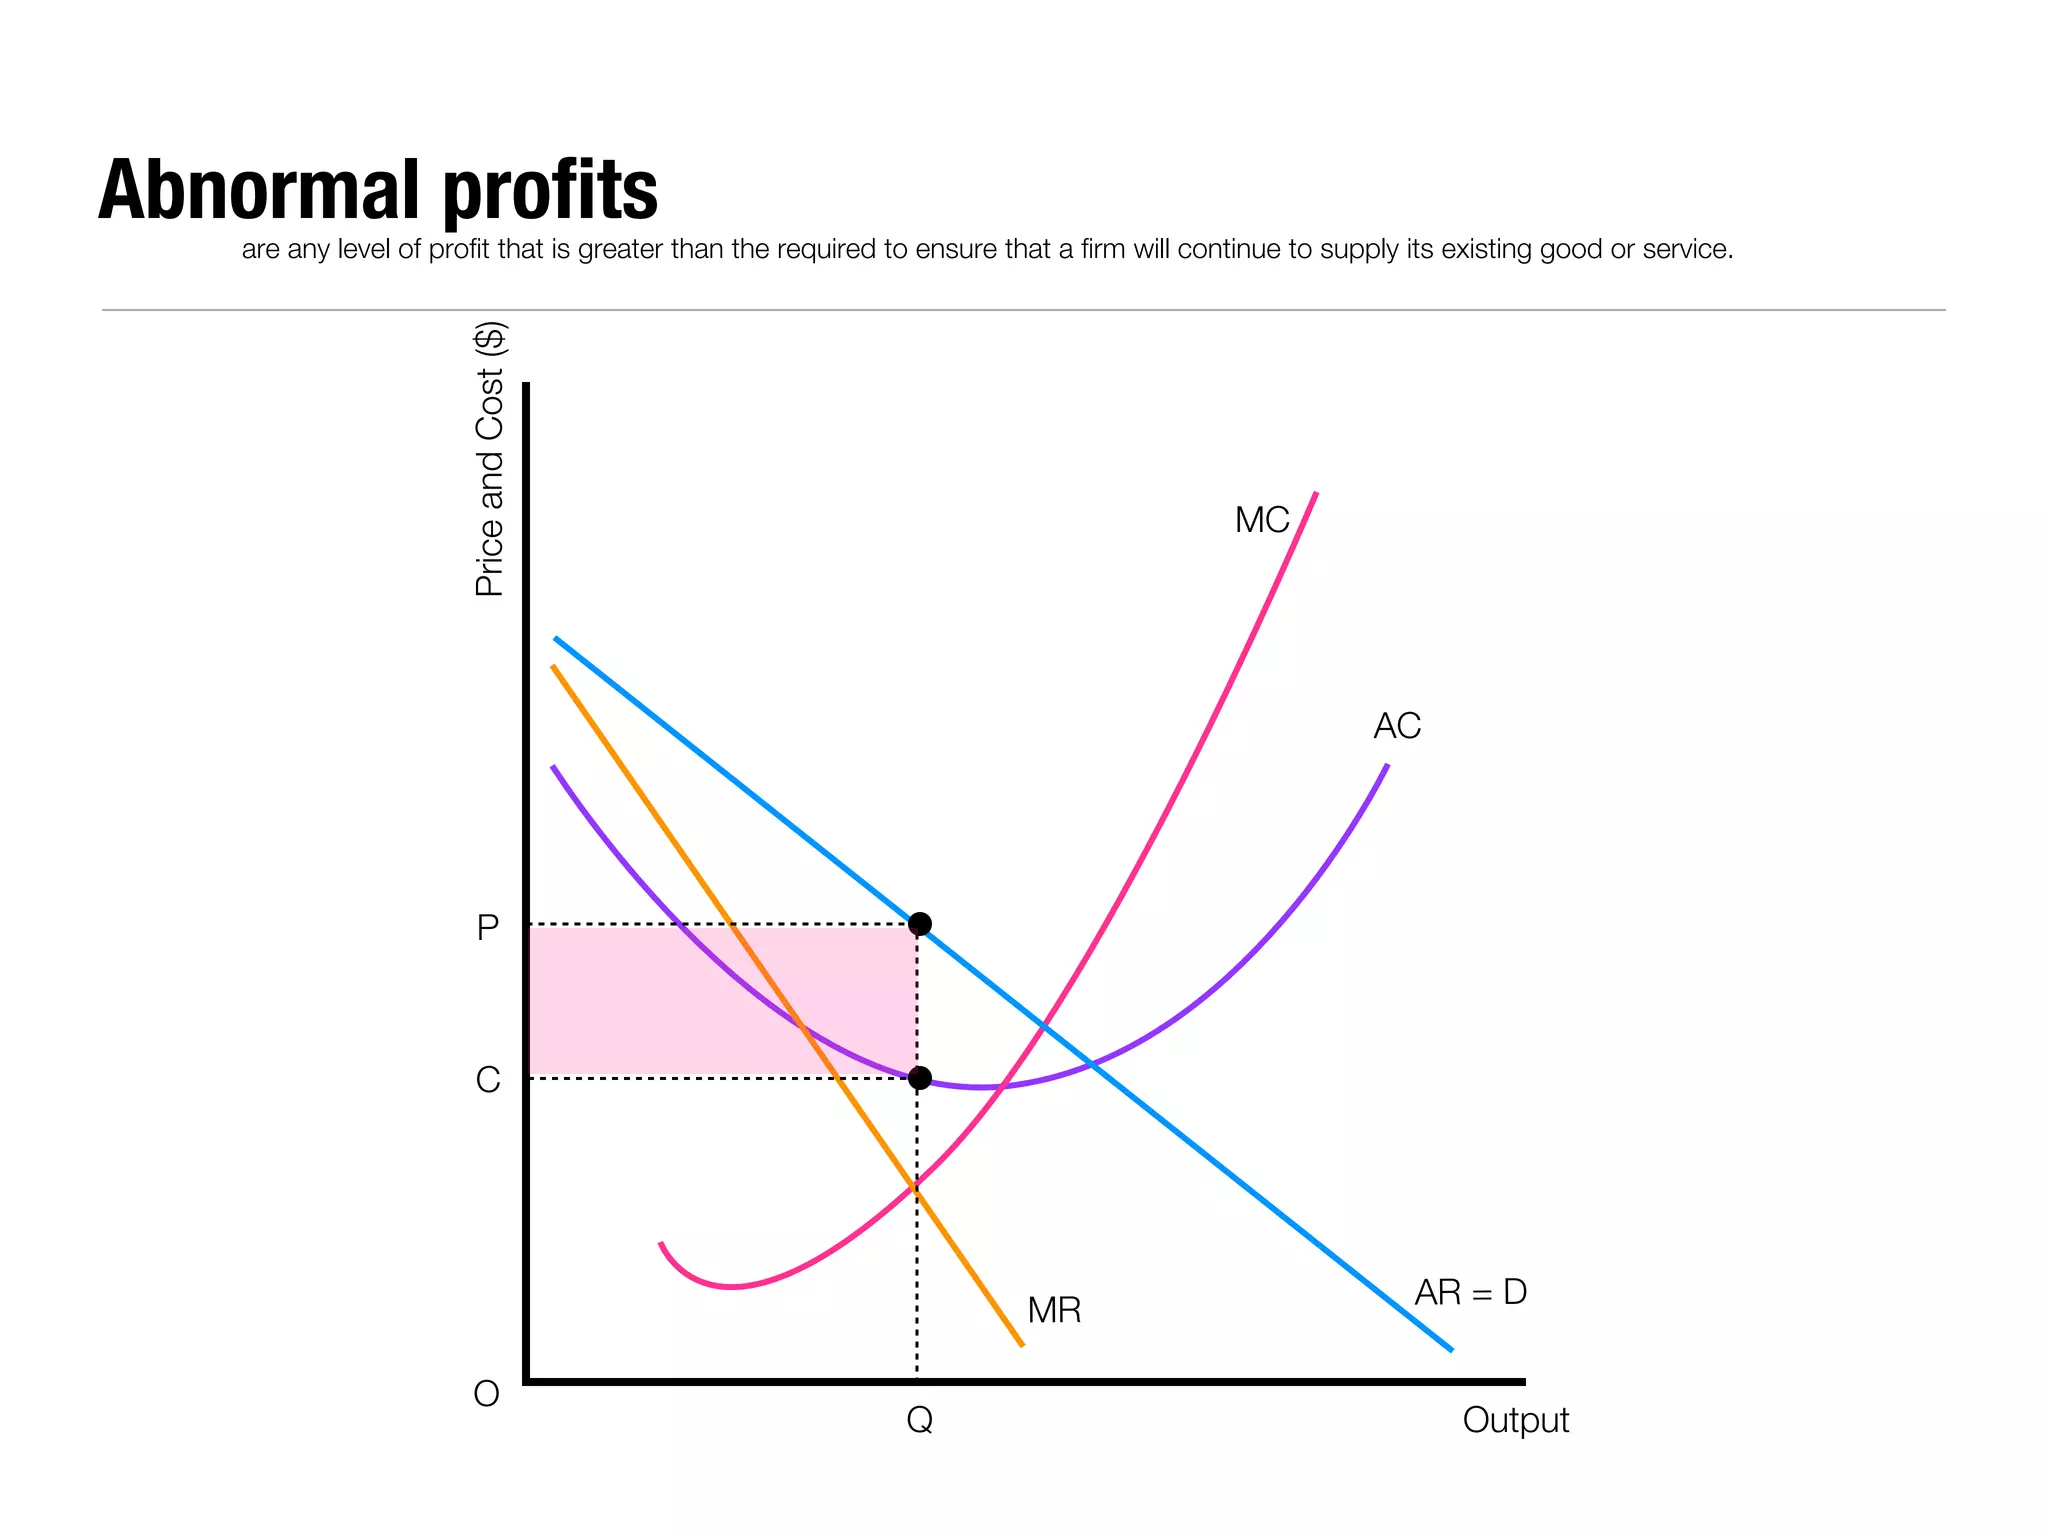
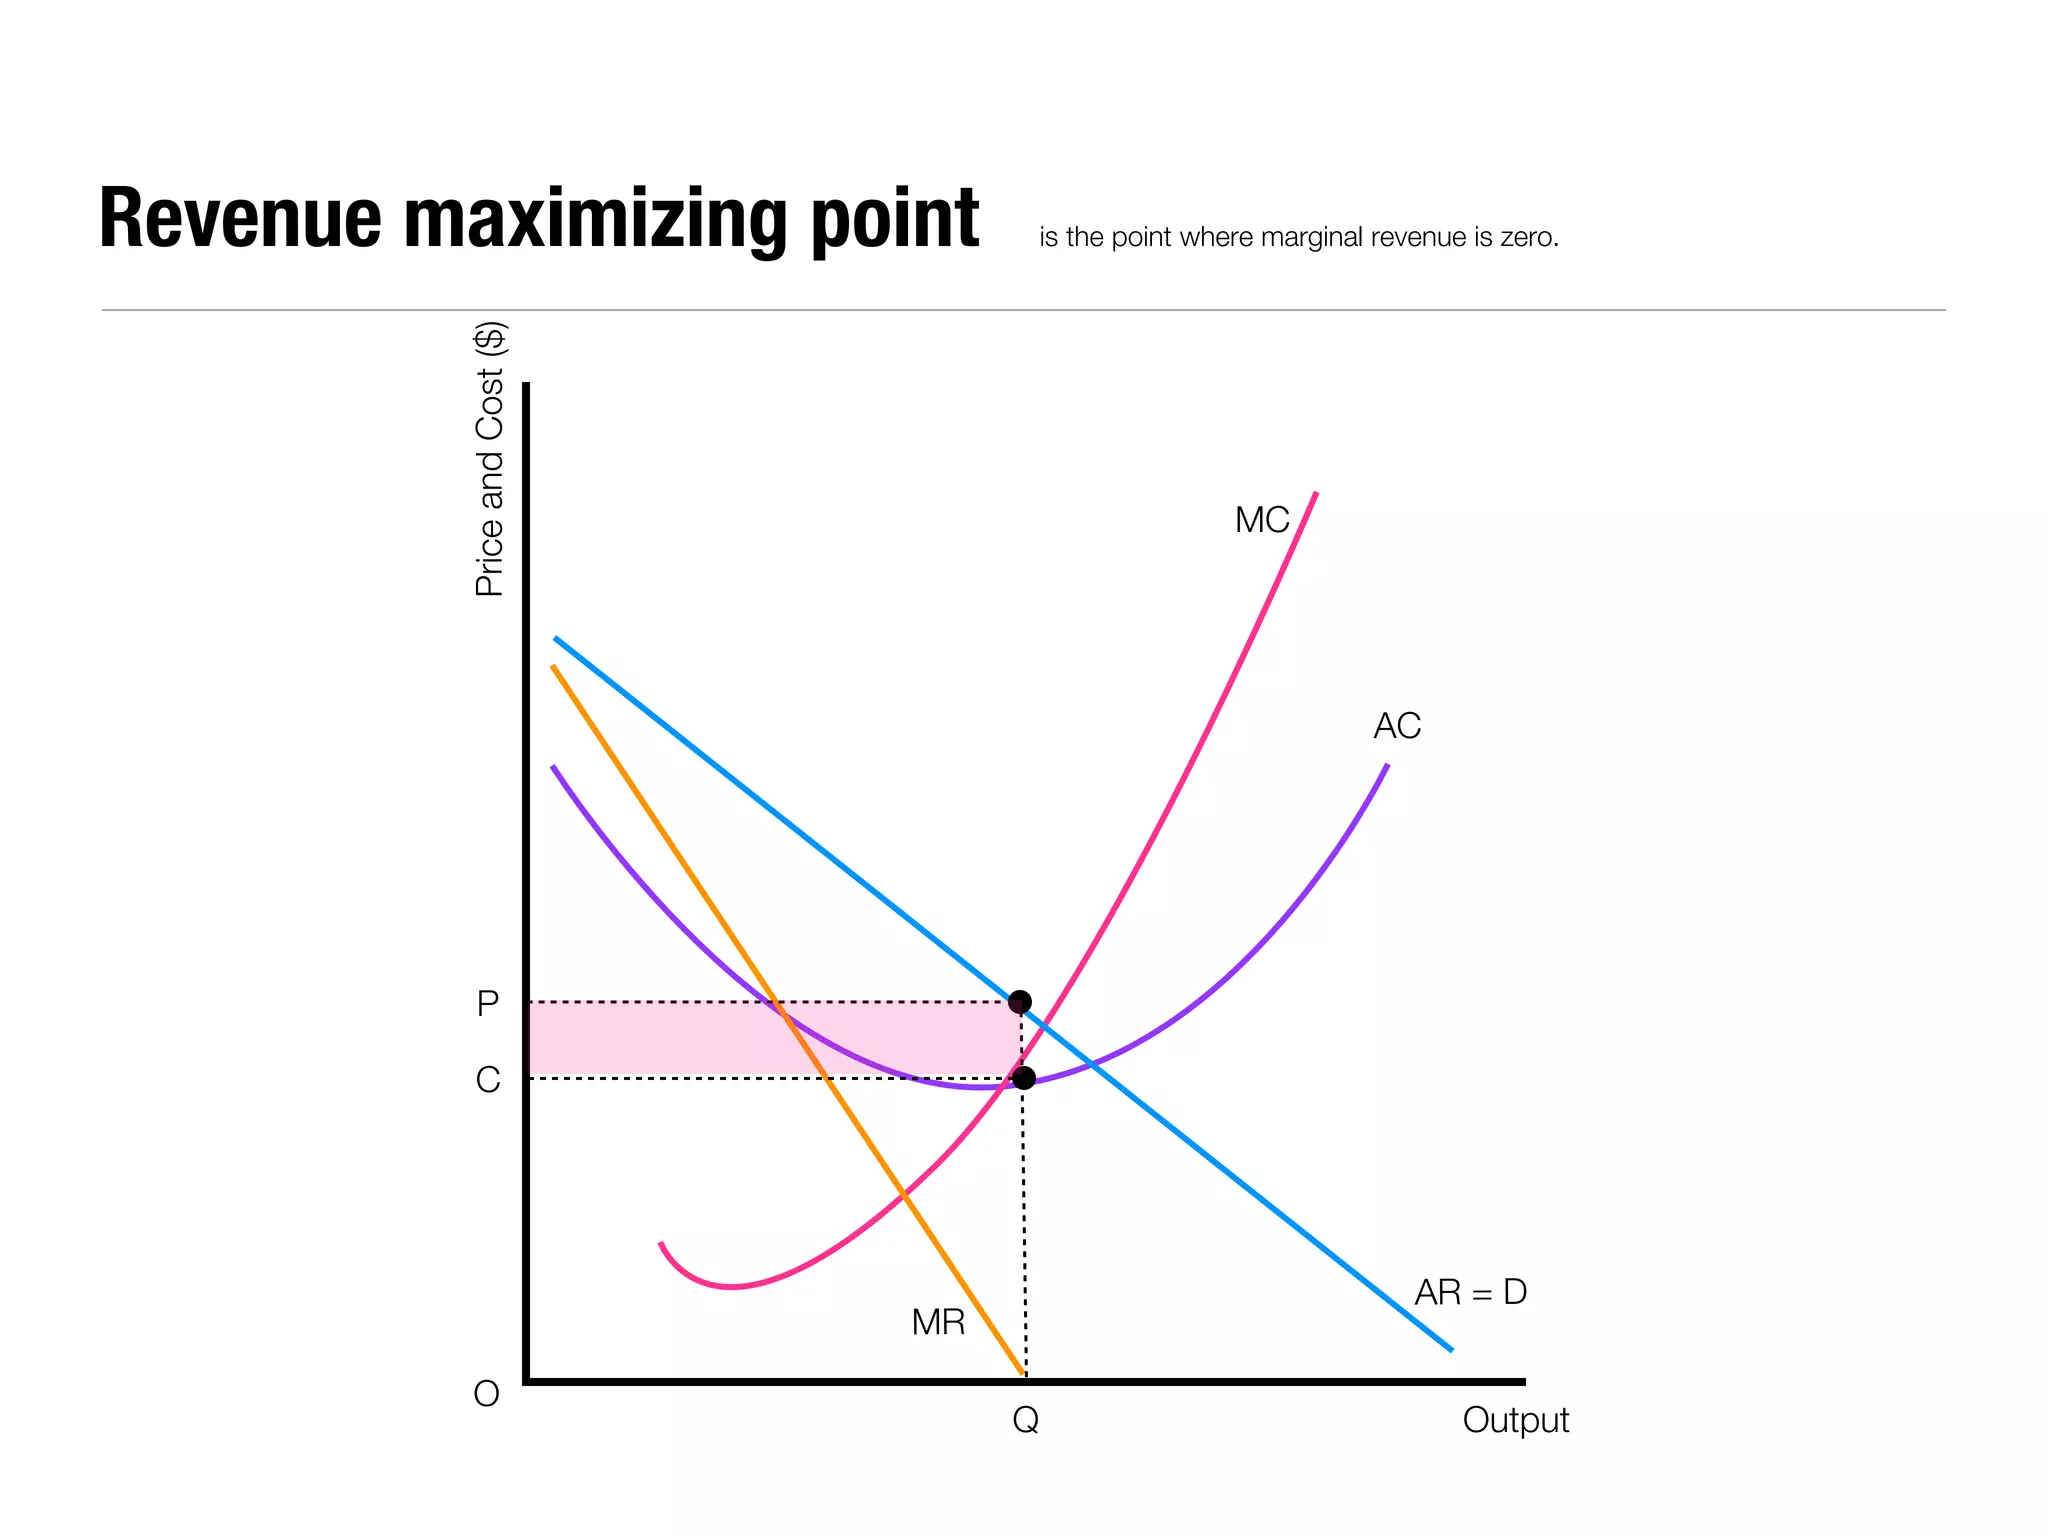
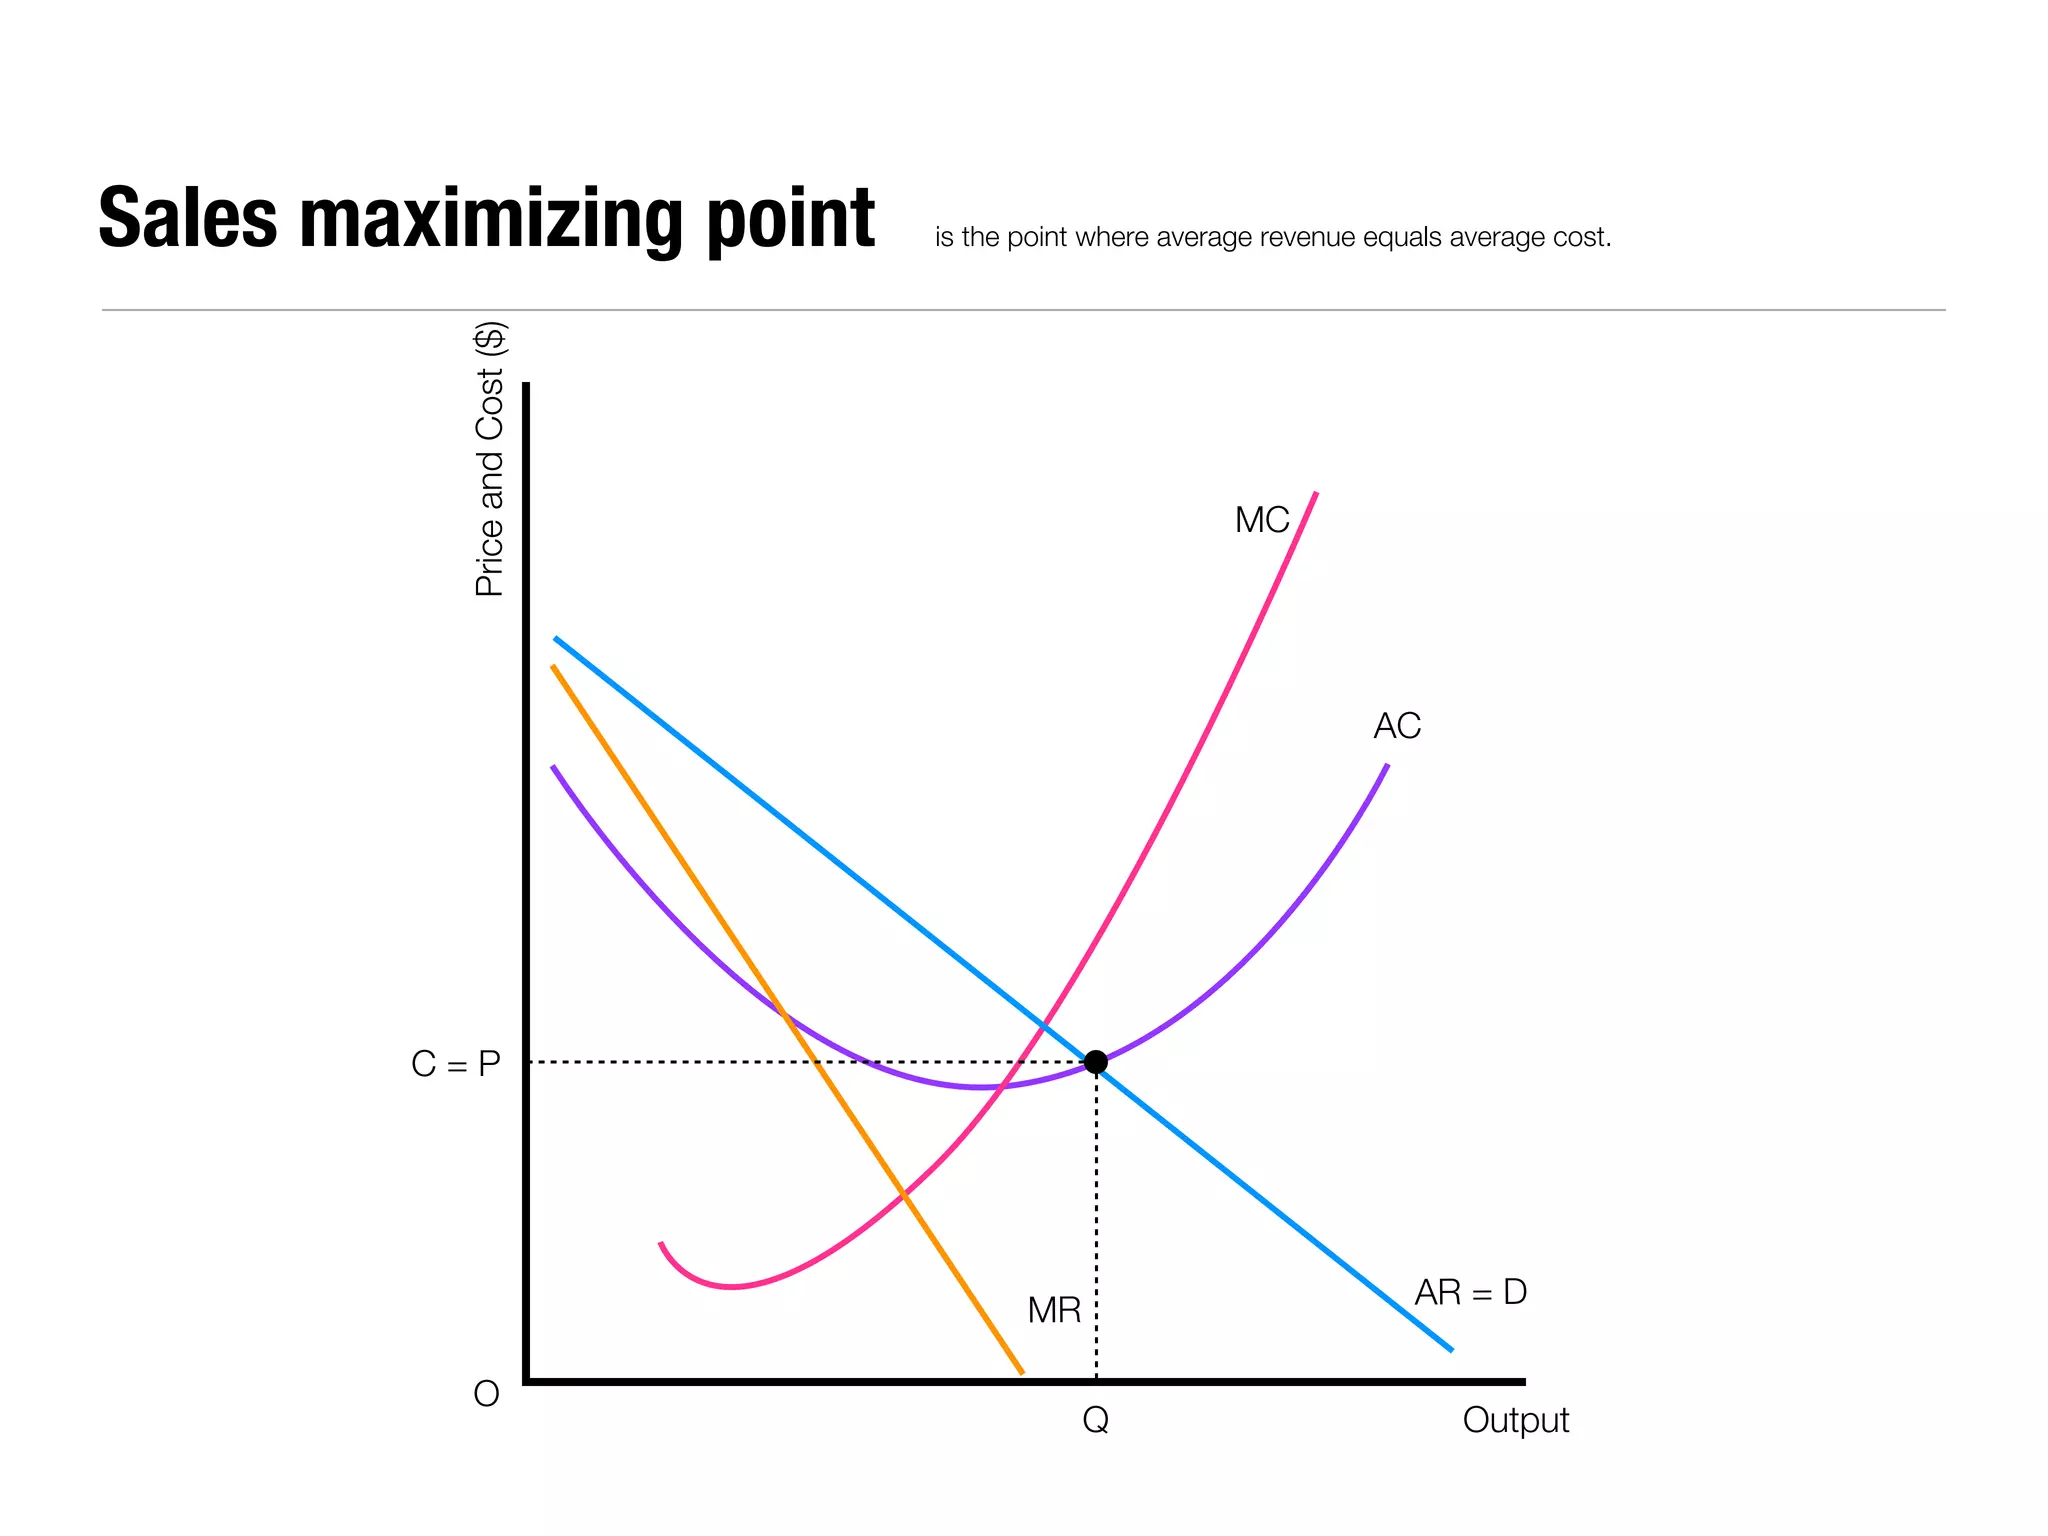
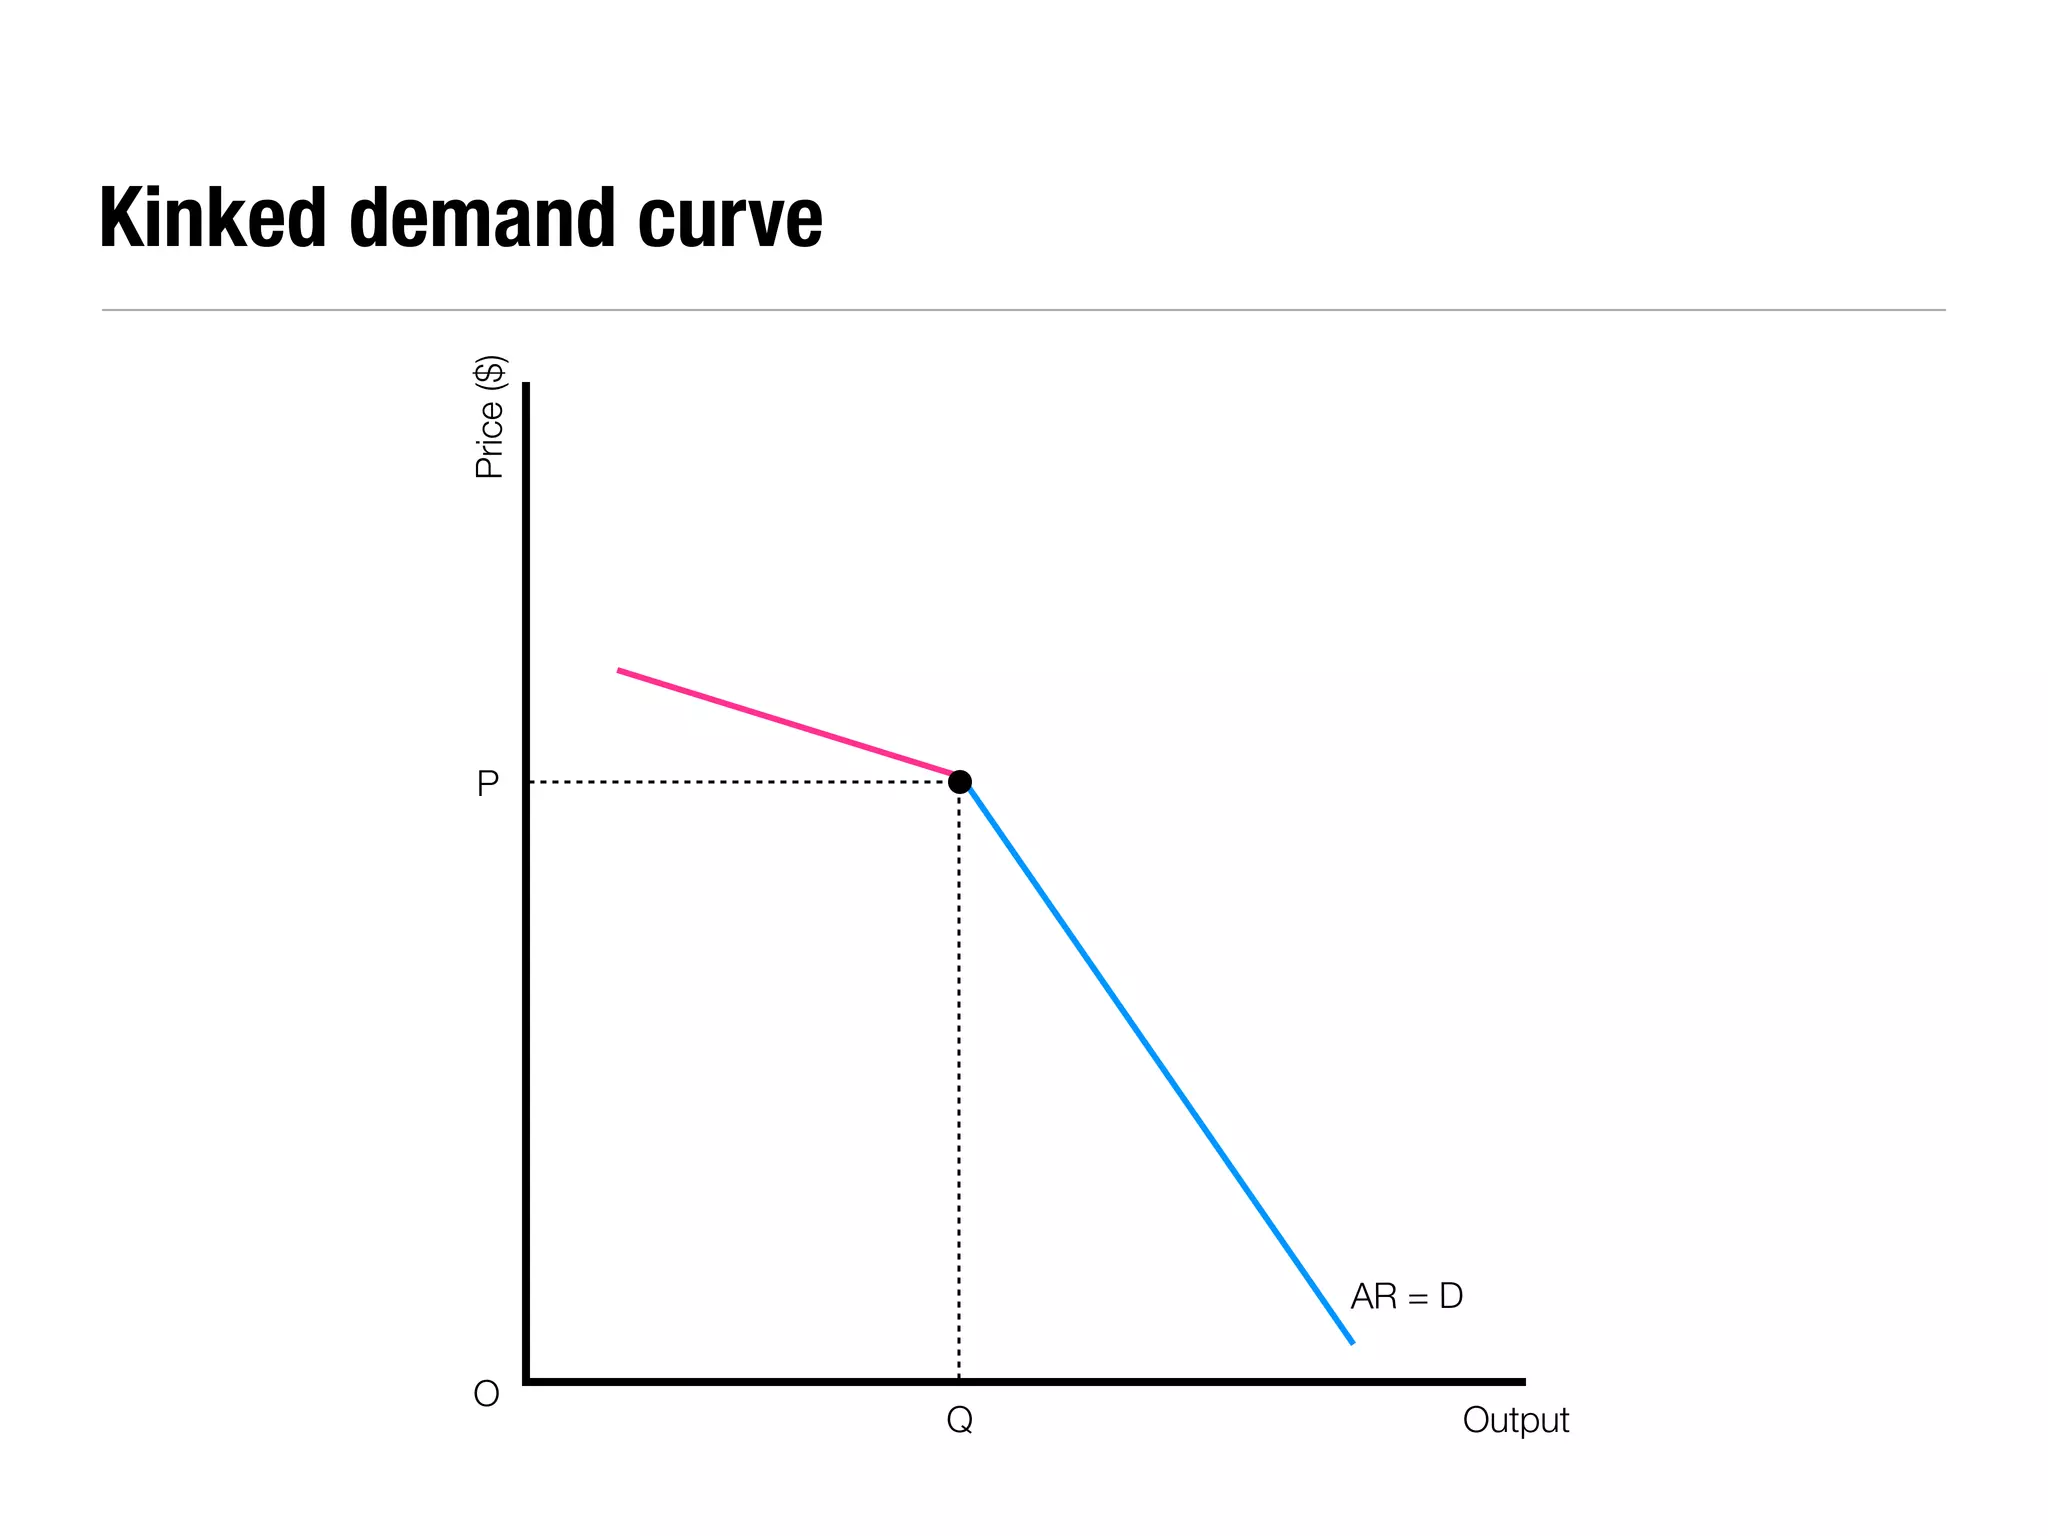
Portfolio   Semester One
Production Possibilities Curve (PPC)
shows the maximum combination of goods or services that can be produced by an economy in a give time period,
                   if all the resources in the economy are being used fully and effectively.
Opportunity cost   is the next best alternative foregone when an economic decision is made.


          Bread


          Y1


          Y2


          O
                              X1                              X2                Cookie
Increasing opportunity cost


           Bread


           O
                              Cookie
Actual growth     occurs when previously unemployed factors of production are brought into use.


          Bread


                                             B


                         A


          O
                                                                                    Cookie
Potential growth   occurs when the quantity and/or quality of factors of production within an economy is increased.


          Bread


                                                             PPC2

                                          PPC1


          O
                                                                                 Cookie
Demand
                         is the willingness and ability to purchase a quantity of a good or service
                                        at a certain price over a given time of period.

The law of demand states that as the price of a good or service rises, the quantity demanded decreases, ceteris paribus.
Change in quantity demanded


          Price ($)


          P1


          P2


                                   D

          O
                      Q1      Q2   Quantity
Supply
           is the willingness and ability of a producer to produce a quantity of a good or service
                                at a certain price over a given period of time.

The law of supply states that as the price of a good rises, the quantity supplied increases, ceteris paribus.
Change in quantity supplied


          Price ($)                S


          P1


          P2


          O
                        Q2    Q1       Quantity
Equilibrium Price
is the market clearing price. It occurs where demand is equal to supply.
Equilibrium


          Price ($)
                          S


          P


                              D

          O
                      Q       Quantity
Change in demand


         Price ($)
                                    S


         P2

         P1


                               D1        D2
         O
                     Q1   Q2            Quantity
Change in supply


          Price ($)             S1


                                      S2


          P1


          P2


                                     D

          O
                      Q1   Q2        Quantity
Price Control
Price ceiling, Price floor, and Buffer stock scheme
Price ceiling          is a price set by the government, above which the market price is not allowed to rise.


           Price ($)
                                                                                              S


           P


           Pc
                                  {                  Shortage

                                                                                                  D

           O
                                        Q1                Q               Q2                      Quantity
Price floor          is a price set by the government, below which the market price is not allowed to fall.


             Price ($)
                                                                                                 S
                                                          Surplus


                                   {
             Pf


             P


                                                                                                      D

             O
                                           Q1                Q                Q2                     Quantity
Buffer stock scheme             sets a maximum and a minimum price in a market to stabilize prices.


          Price ($)
                           D2                   S1               S2

                      D1


         P1


         P2


          O
                                Q1       Q2      Q3                              Quantity
Price Elasticity of Demand (PED)
is a measure of the responsiveness of the quantity demanded of a good or service to a change in its price.
Inelastic demand       means that a change in the price of a good or service will cause a smaller change in quantity demanded.


          Price ($)


          P1


          P2


                                          D

          O
                      Q1 Q2                                                          Quantity
Elastic demand        means that a change in the price of a good or service will cause a larger change in quantity demanded.


          Price ($)


          P1


          P2


                                                                                      D


          O
                      Q1                              Q2                                Quantity
Indirect Tax
                            is an expenditure tax on a good or service.
An indirect tax is shown on a supply and demand diagram as an upward shift in the supply curve,
  where the vertical distance between the two supply curves represents the amount of the tax.
Specific tax           is shown as a parallel shift.


          Price ($)
                                      D
                                                                 ST


                                                                 S


                                                       ET
          PT
                      consumers


          PE          suppliers                              E
          P


                       revenue

          O
                                                      Q2Q1            Quantity
Ad valorem tax                    is shown as a divergent shift.


          Price ($)
                                       D
                                                                   ST


                                                                        S


                                                       ET
          PT
                      consumers


          PE          suppliers                              E
          P


                       revenue

          O
                                                     Q2Q1                   Quantity
Cost theory
Fixed costs are costs of production that do not change with the level of output. They will be the same for the one or any other number of units.
Variable costs are costs are costs of production that vary with the level of output.
Total costs are the total costs of producing a certain level of output–fixed costs plus variable costs.


                             Cost ($)
                                                                                                           TC


                                                                                                                VC


                                                                                                          FC


                             O
                                                                                                            Output
Average cost           is the average (total) cost of production per unit. It is calculated by dividing the total cost by the quantity produced.


Marginal cost           is the additional cost of producing an additional unit of output.


            Cost ($)
                                                                          MC
                                                                                                    ATC


                                                                                                      AVC


                                                                                                      AFC


            O
                                                                                                         Output
Long run
is the period of time in which all factors of production are variable.
Economies of scale are any fall in long-run average costs that come about as a result of a firm increasing its scale of production.
Diseconomies of scale are any increase in long-run average costs that come about as a result of a firm increasing its scale of production.


                            Cost ($)
                                                                                                         LRAC
                                                                                       SRAC5
                                                   SRAC1


                                                        SRAC2                   SRAC4


                                                               SRAC3


                            O
                                                                                                       Output
Revenue Theory
Total revenue is the aggregate revenue gained by a firm from the scale of a particular quantity of output (equal to price times quantity sold).
Average revenue is total revenue received divided by the number of units sold. Usually, price is equal to average revenue.
Marginal revenue is the extra revenue gained from selling an additional unit of a good or service.


                              Revenue ($)
                                                        TR


                                                                                                            AR
                                                                MR
                              O
                                                                                                             Output
Profit Theory
Normal profits                  are the amount of revenue needed to cover the total costs of production, including the opportunity costs.


          Price and Cost ($)
                                                                              MC

                                                                                              AC


        C=P


                                                               MR                              AR = D

          O
                                                    Q                                              Output
Abnormal profits
   are any level of profit that is greater than the required to ensure that a firm will continue to supply its existing good or service.


                       Price and Cost ($)
                                                                                           MC


                                                                                                       AC


                       P


                       C


                                                                         MR                                AR = D

                       O
                                                              Q                                                Output
Revenue maximizing point                is the point where marginal revenue is zero.


          Price and Cost ($)
                                                        MC


                                                                    AC


          P

          C


                                                                       AR = D
                               MR
          O
                                    Q                                      Output
Sales maximizing point         is the point where average revenue equals average cost.


          Price and Cost ($)
                                                       MC


                                                                  AC


        C=P


                                      MR                             AR = D

          O
                                           Q                             Output
Price Discrimination
occurs when a producer charges a different price to different customers for an identical good or service.
Kinked demand curve


         Price ($)


         P


                          AR = D

         O
                      Q        Output

Economics Essential Diagrams

  • 1.
    Portfolio Semester One
  • 2.
    Production Possibilities Curve(PPC) shows the maximum combination of goods or services that can be produced by an economy in a give time period, if all the resources in the economy are being used fully and effectively.
  • 3.
    Opportunity cost is the next best alternative foregone when an economic decision is made. Bread Y1 Y2 O X1 X2 Cookie
  • 4.
  • 5.
    Actual growth occurs when previously unemployed factors of production are brought into use. Bread B A O Cookie
  • 6.
    Potential growth occurs when the quantity and/or quality of factors of production within an economy is increased. Bread PPC2 PPC1 O Cookie
  • 7.
    Demand is the willingness and ability to purchase a quantity of a good or service at a certain price over a given time of period. The law of demand states that as the price of a good or service rises, the quantity demanded decreases, ceteris paribus.
  • 8.
    Change in quantitydemanded Price ($) P1 P2 D O Q1 Q2 Quantity
  • 9.
    Supply is the willingness and ability of a producer to produce a quantity of a good or service at a certain price over a given period of time. The law of supply states that as the price of a good rises, the quantity supplied increases, ceteris paribus.
  • 10.
    Change in quantitysupplied Price ($) S P1 P2 O Q2 Q1 Quantity
  • 11.
    Equilibrium Price is themarket clearing price. It occurs where demand is equal to supply.
  • 12.
    Equilibrium Price ($) S P D O Q Quantity
  • 13.
    Change in demand Price ($) S P2 P1 D1 D2 O Q1 Q2 Quantity
  • 14.
    Change in supply Price ($) S1 S2 P1 P2 D O Q1 Q2 Quantity
  • 15.
    Price Control Price ceiling,Price floor, and Buffer stock scheme
  • 16.
    Price ceiling is a price set by the government, above which the market price is not allowed to rise. Price ($) S P Pc { Shortage D O Q1 Q Q2 Quantity
  • 17.
    Price floor is a price set by the government, below which the market price is not allowed to fall. Price ($) S Surplus { Pf P D O Q1 Q Q2 Quantity
  • 18.
    Buffer stock scheme sets a maximum and a minimum price in a market to stabilize prices. Price ($) D2 S1 S2 D1 P1 P2 O Q1 Q2 Q3 Quantity
  • 19.
    Price Elasticity ofDemand (PED) is a measure of the responsiveness of the quantity demanded of a good or service to a change in its price.
  • 20.
    Inelastic demand means that a change in the price of a good or service will cause a smaller change in quantity demanded. Price ($) P1 P2 D O Q1 Q2 Quantity
  • 21.
    Elastic demand means that a change in the price of a good or service will cause a larger change in quantity demanded. Price ($) P1 P2 D O Q1 Q2 Quantity
  • 22.
    Indirect Tax is an expenditure tax on a good or service. An indirect tax is shown on a supply and demand diagram as an upward shift in the supply curve, where the vertical distance between the two supply curves represents the amount of the tax.
  • 23.
    Specific tax is shown as a parallel shift. Price ($) D ST S ET PT consumers PE suppliers E P revenue O Q2Q1 Quantity
  • 24.
    Ad valorem tax is shown as a divergent shift. Price ($) D ST S ET PT consumers PE suppliers E P revenue O Q2Q1 Quantity
  • 25.
  • 26.
    Fixed costs arecosts of production that do not change with the level of output. They will be the same for the one or any other number of units. Variable costs are costs are costs of production that vary with the level of output. Total costs are the total costs of producing a certain level of output–fixed costs plus variable costs. Cost ($) TC VC FC O Output
  • 27.
    Average cost is the average (total) cost of production per unit. It is calculated by dividing the total cost by the quantity produced. Marginal cost is the additional cost of producing an additional unit of output. Cost ($) MC ATC AVC AFC O Output
  • 28.
    Long run is theperiod of time in which all factors of production are variable.
  • 29.
    Economies of scaleare any fall in long-run average costs that come about as a result of a firm increasing its scale of production. Diseconomies of scale are any increase in long-run average costs that come about as a result of a firm increasing its scale of production. Cost ($) LRAC SRAC5 SRAC1 SRAC2 SRAC4 SRAC3 O Output
  • 30.
  • 31.
    Total revenue isthe aggregate revenue gained by a firm from the scale of a particular quantity of output (equal to price times quantity sold). Average revenue is total revenue received divided by the number of units sold. Usually, price is equal to average revenue. Marginal revenue is the extra revenue gained from selling an additional unit of a good or service. Revenue ($) TR AR MR O Output
  • 32.
  • 33.
    Normal profits are the amount of revenue needed to cover the total costs of production, including the opportunity costs. Price and Cost ($) MC AC C=P MR AR = D O Q Output
  • 34.
    Abnormal profits are any level of profit that is greater than the required to ensure that a firm will continue to supply its existing good or service. Price and Cost ($) MC AC P C MR AR = D O Q Output
  • 35.
    Revenue maximizing point is the point where marginal revenue is zero. Price and Cost ($) MC AC P C AR = D MR O Q Output
  • 36.
    Sales maximizing point is the point where average revenue equals average cost. Price and Cost ($) MC AC C=P MR AR = D O Q Output
  • 37.
    Price Discrimination occurs whena producer charges a different price to different customers for an identical good or service.
  • 38.
    Kinked demand curve Price ($) P AR = D O Q Output