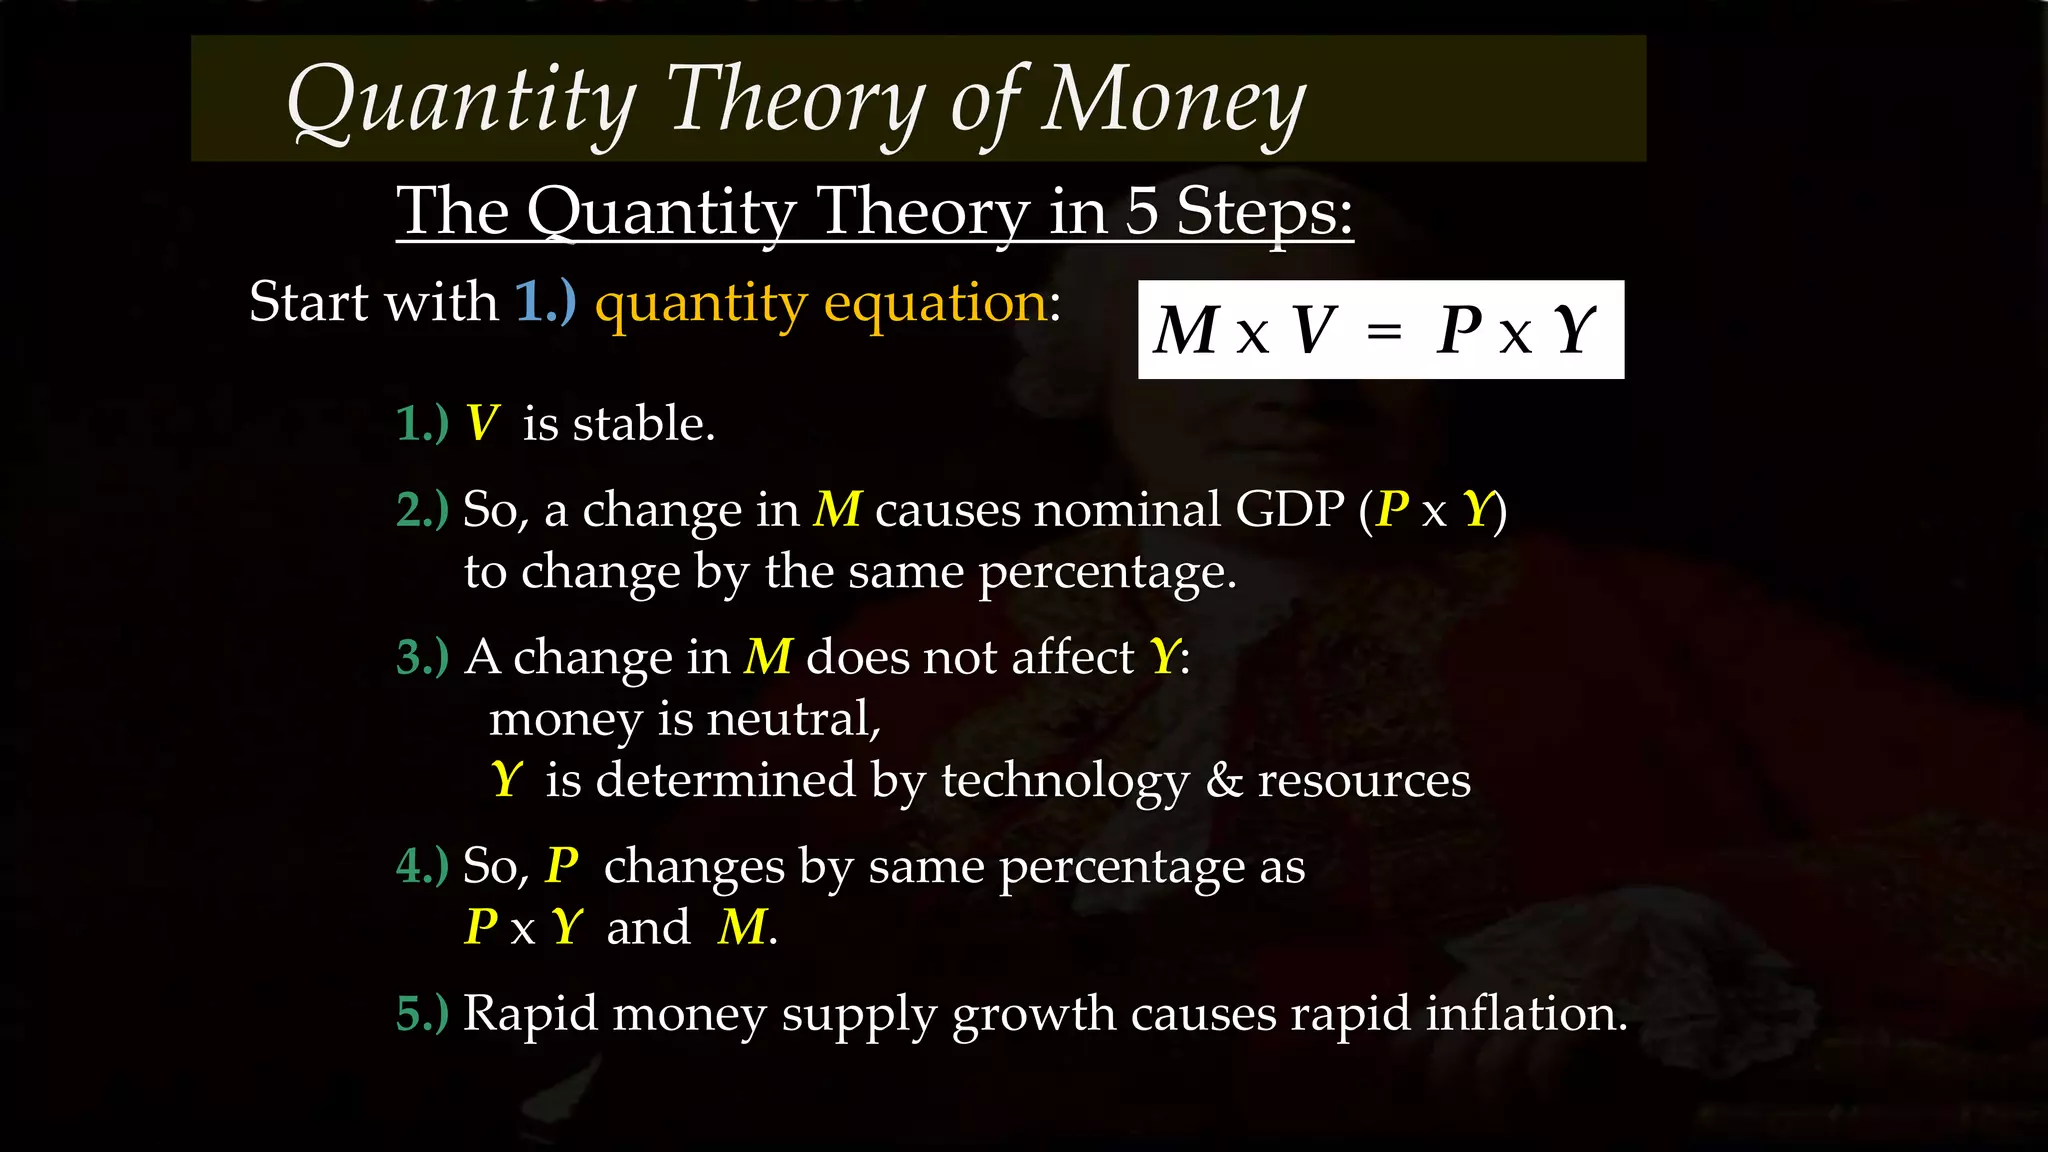
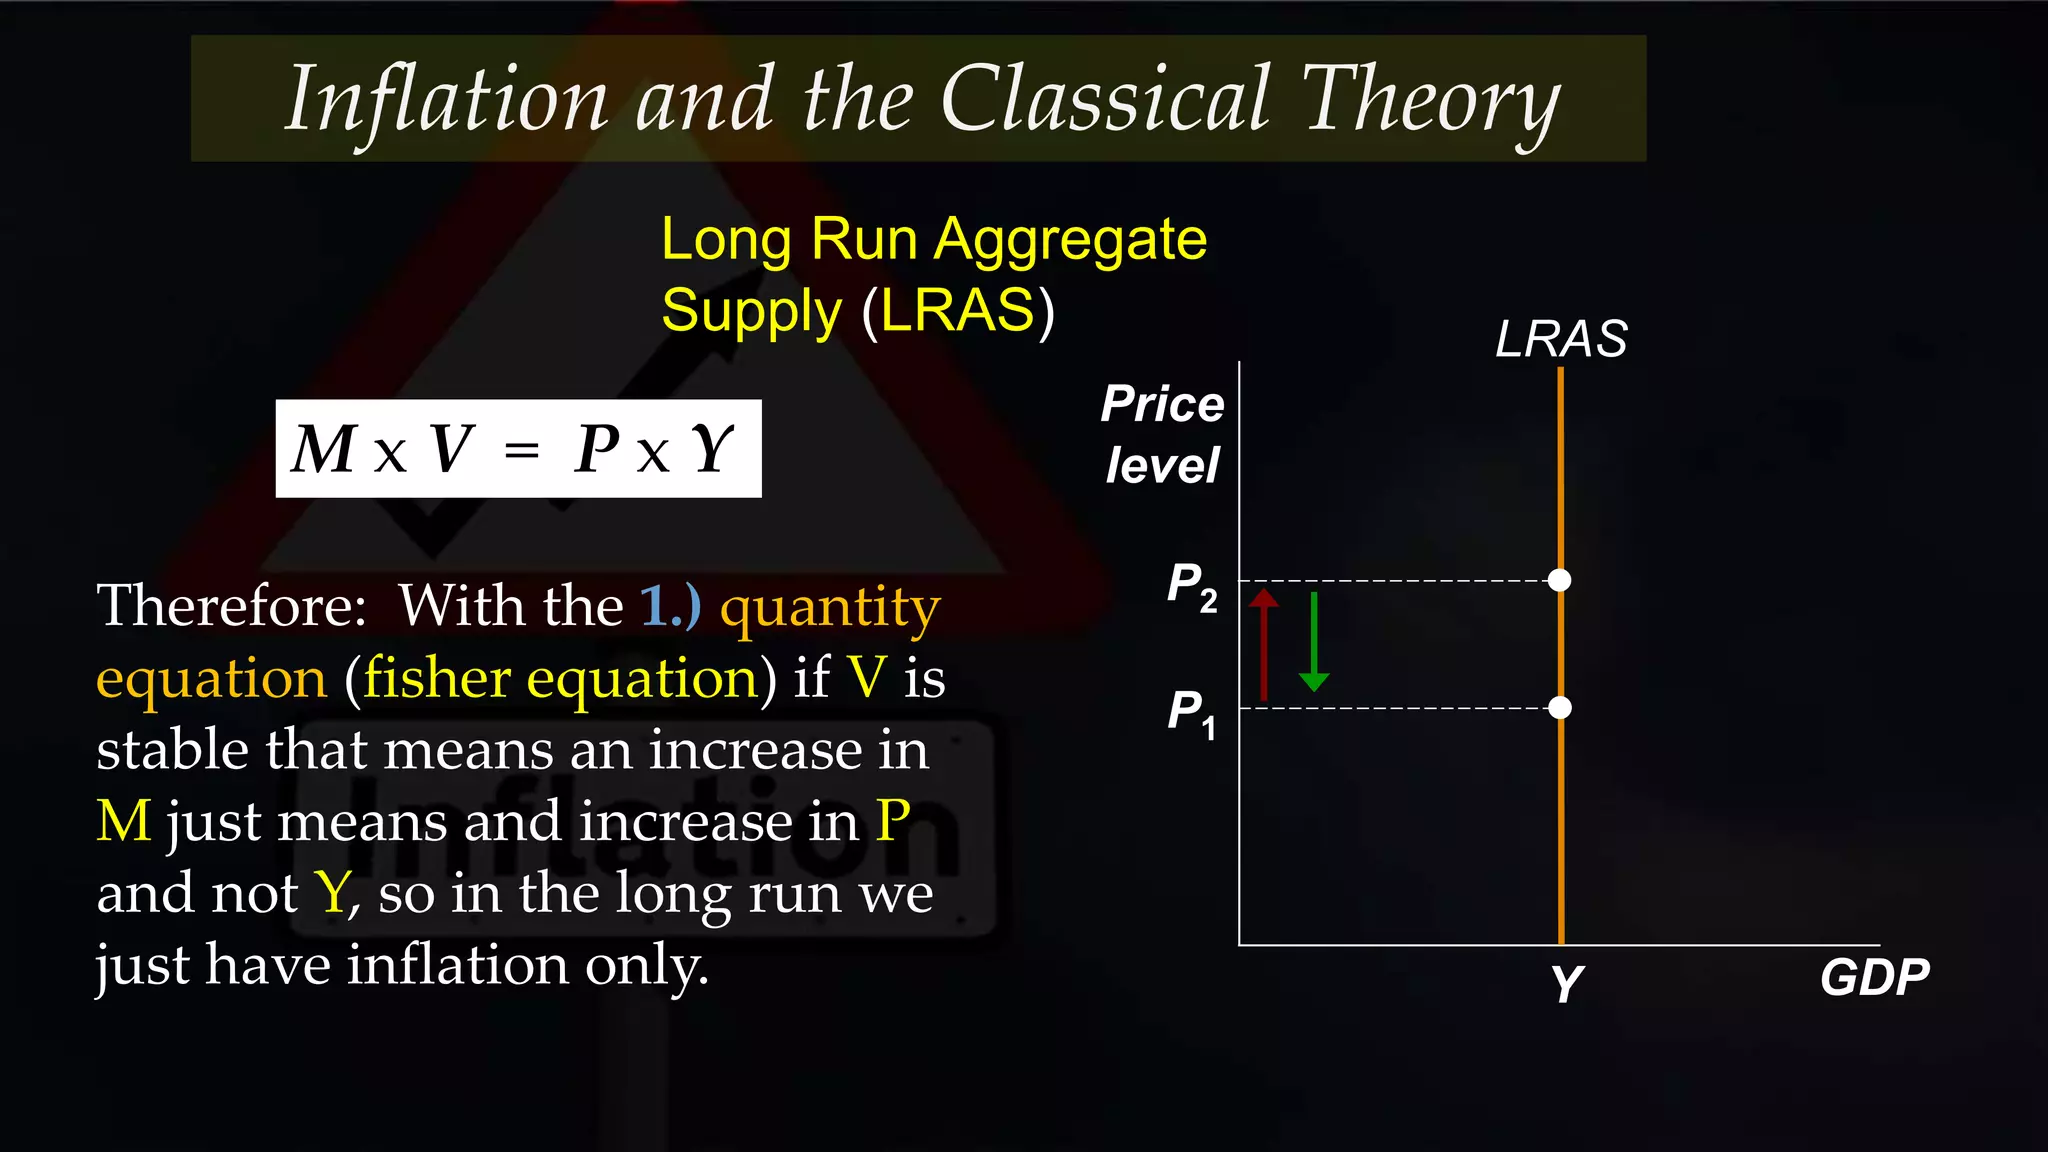
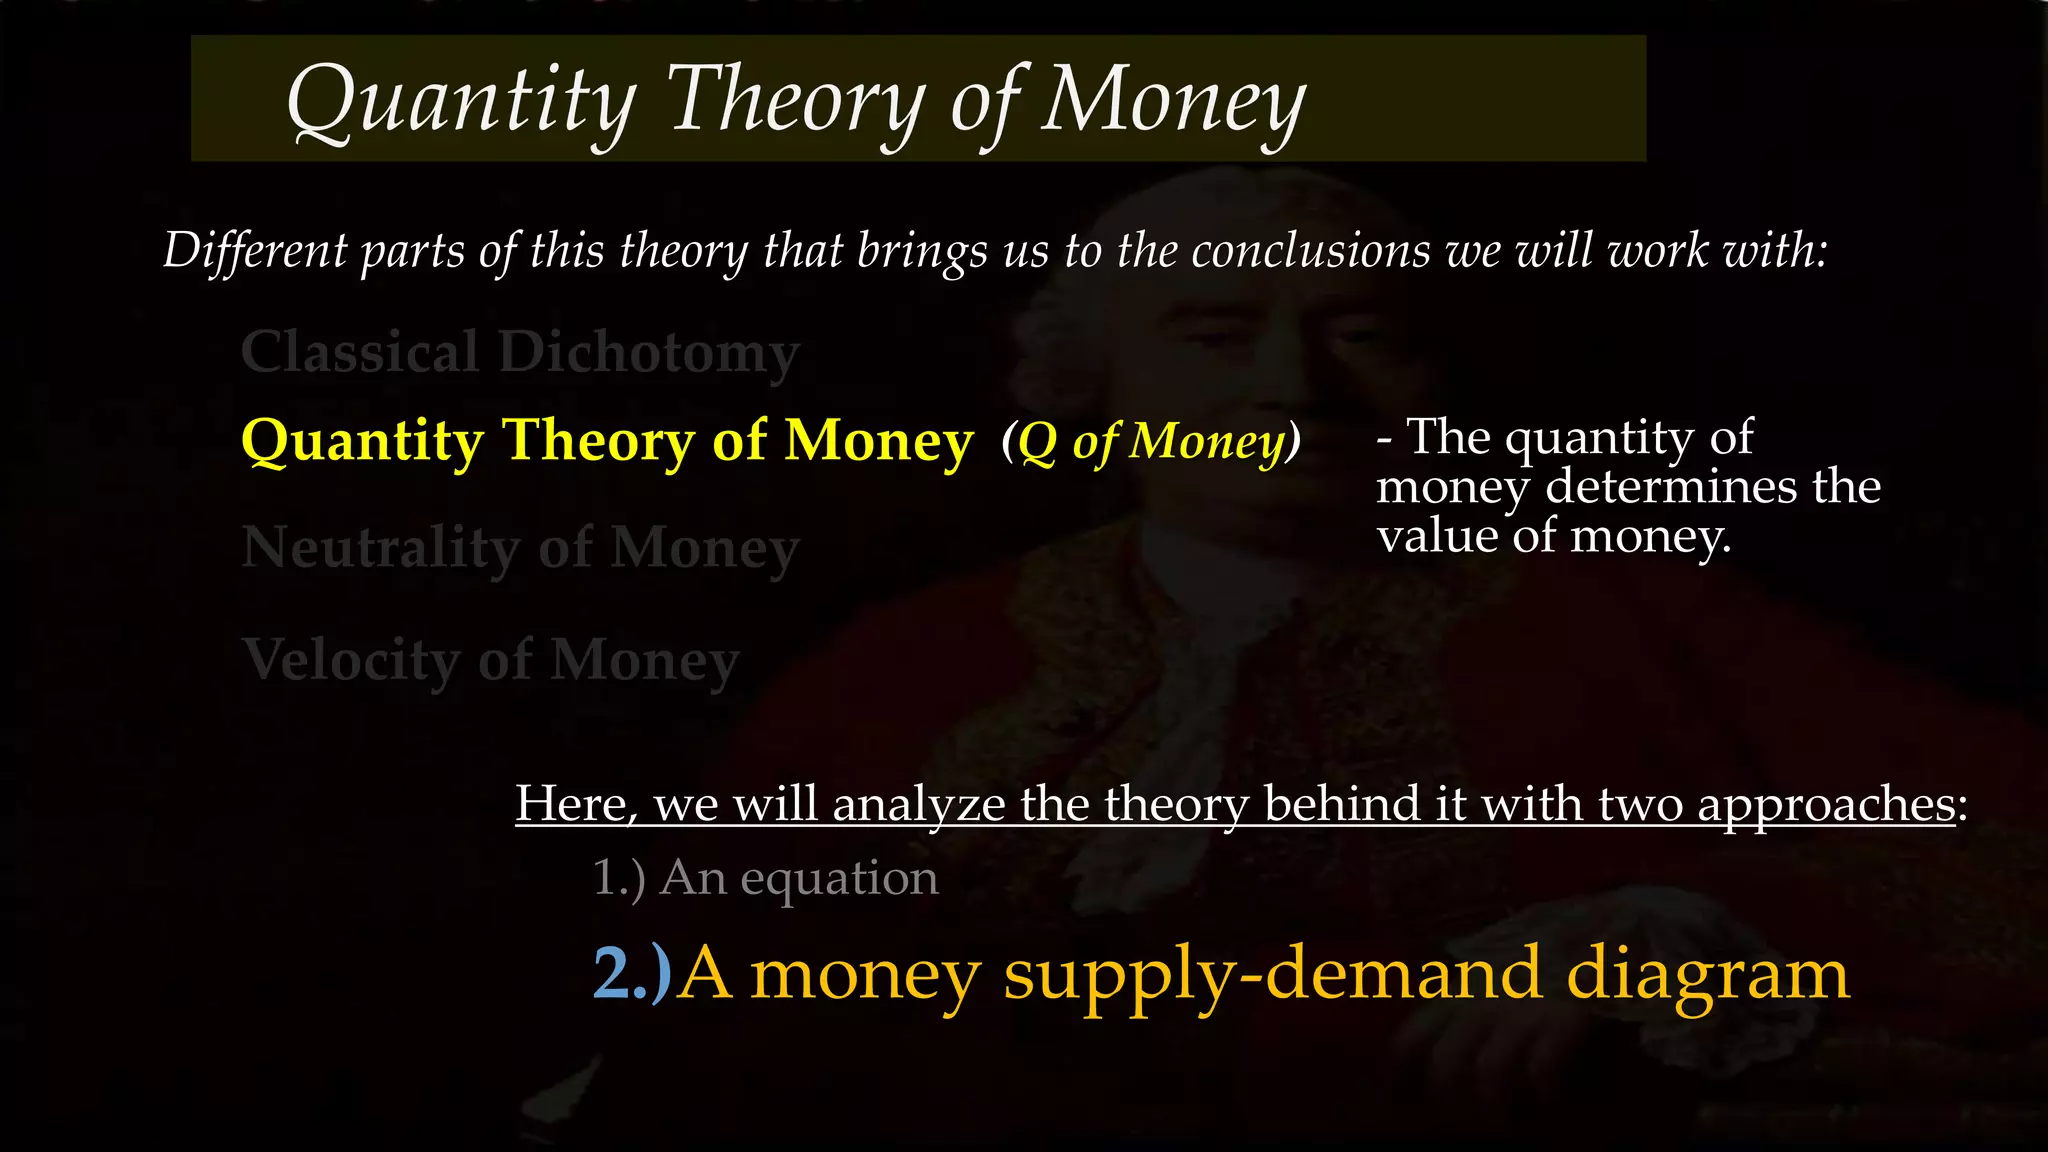
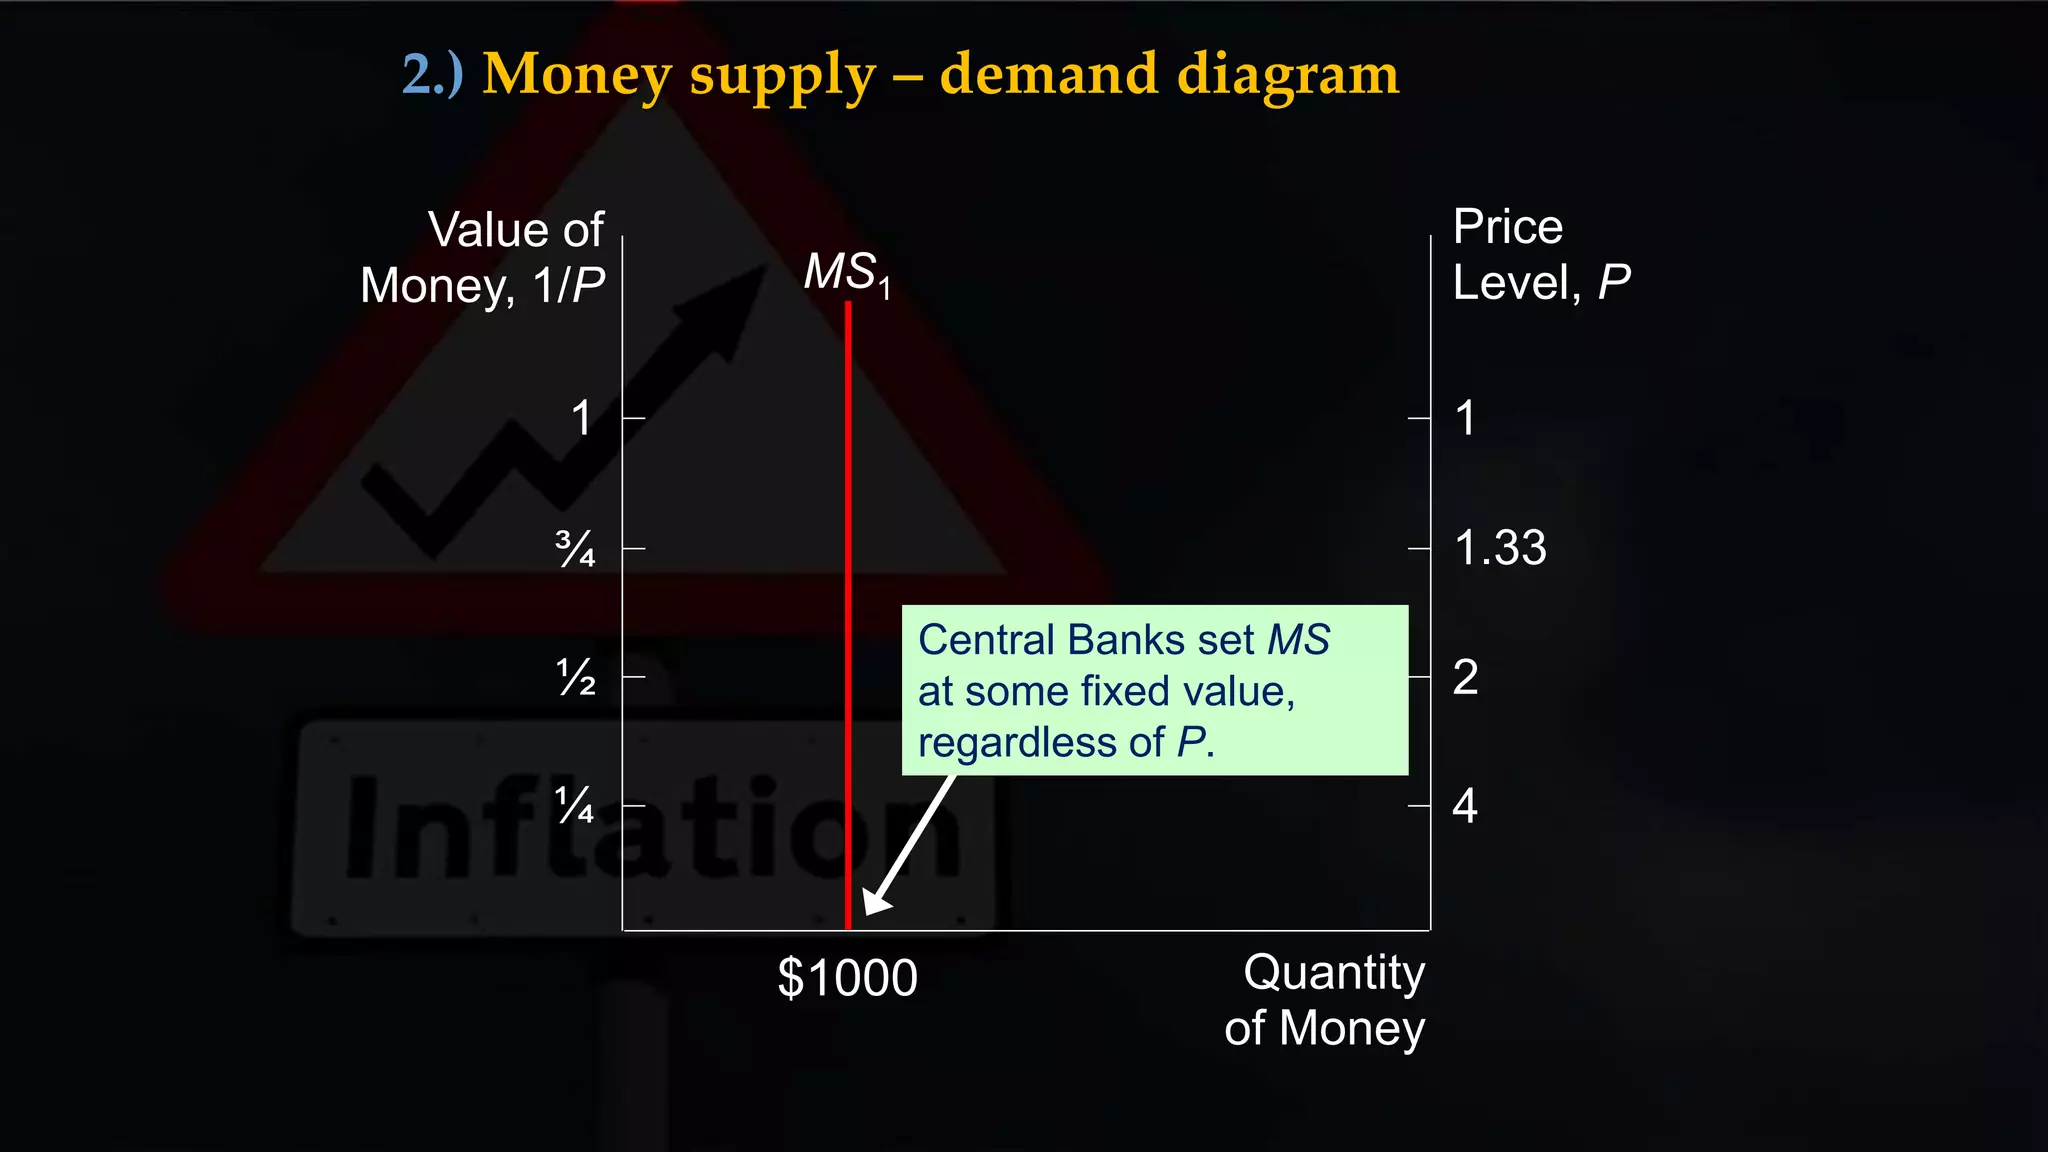
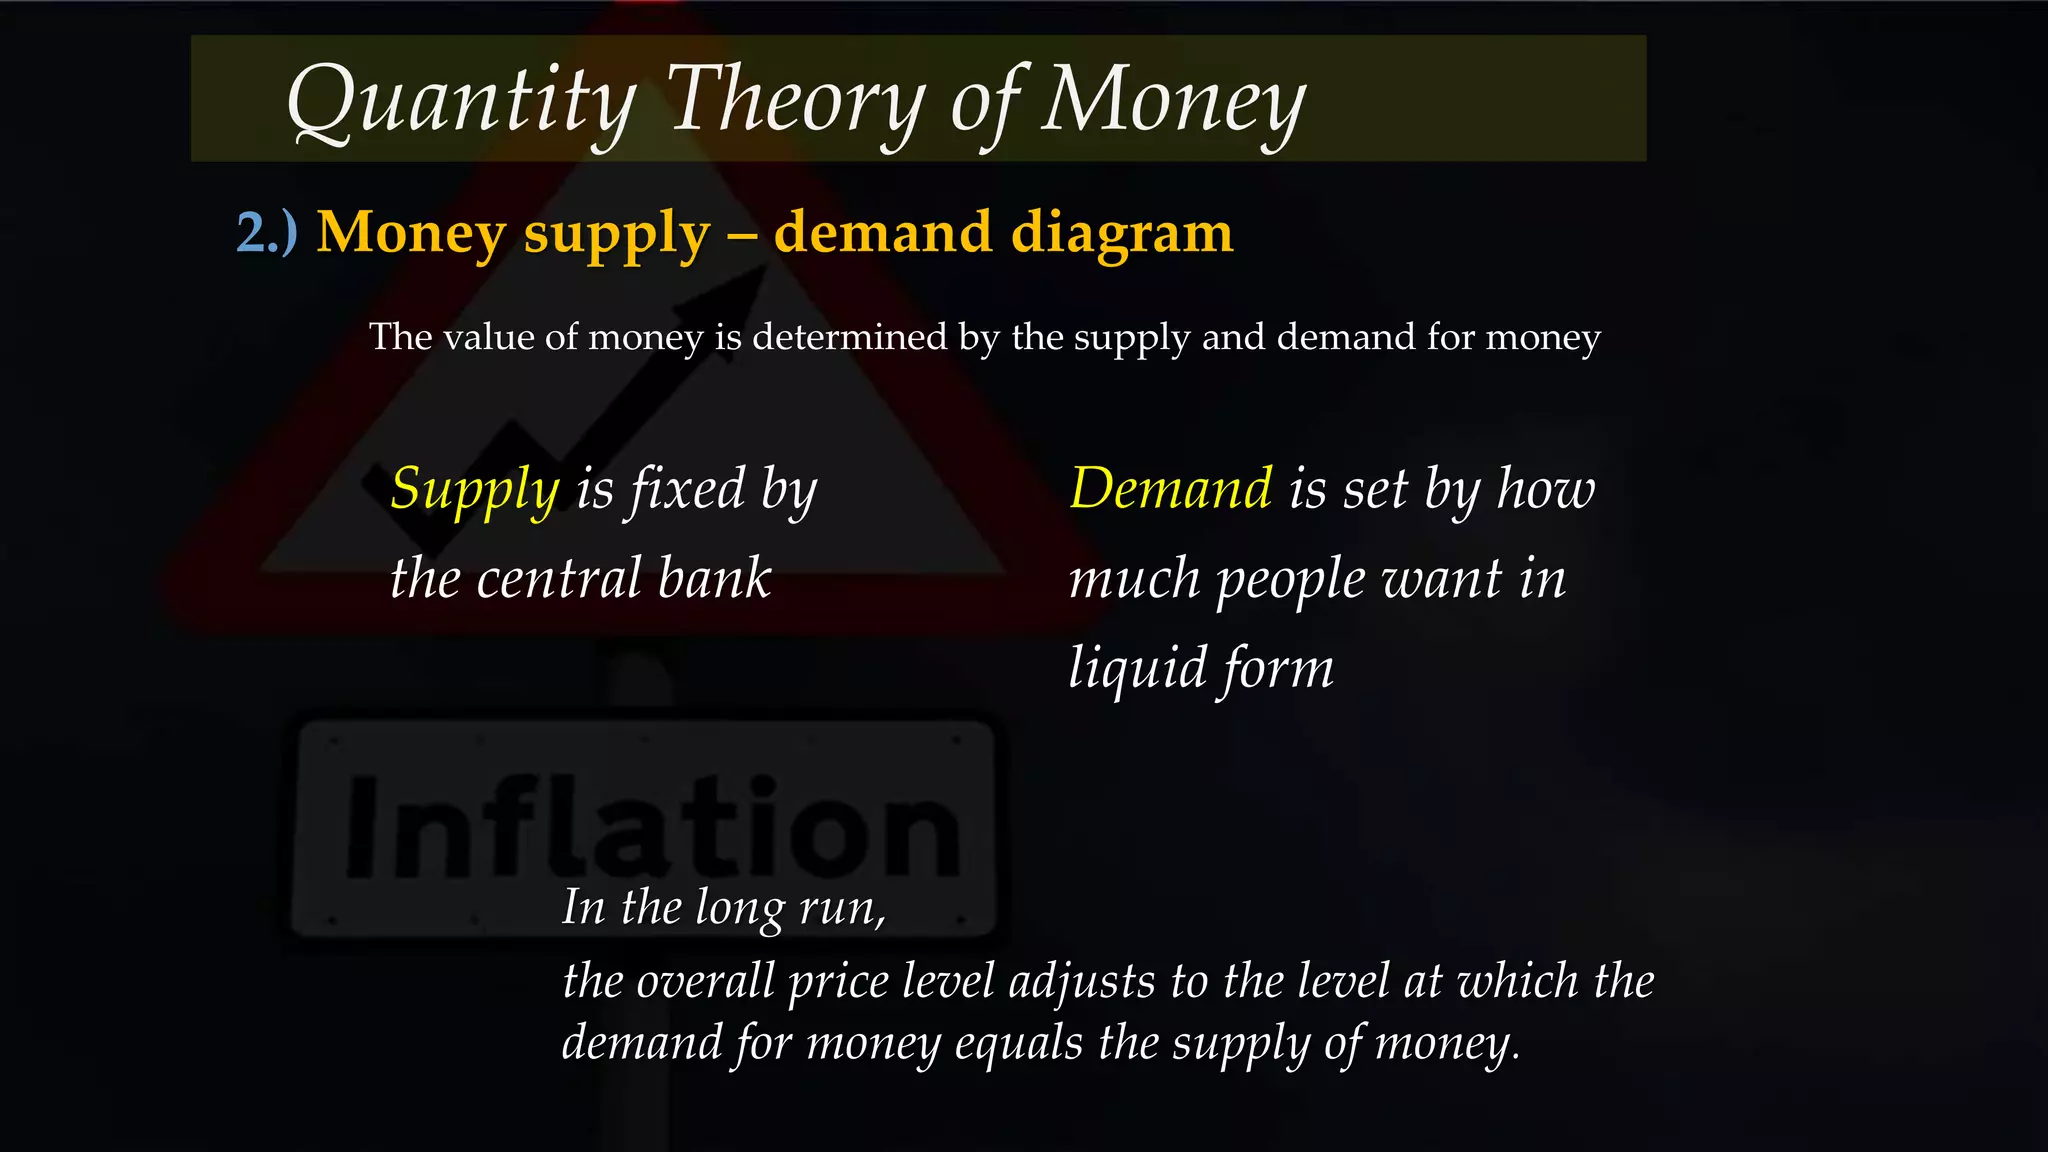
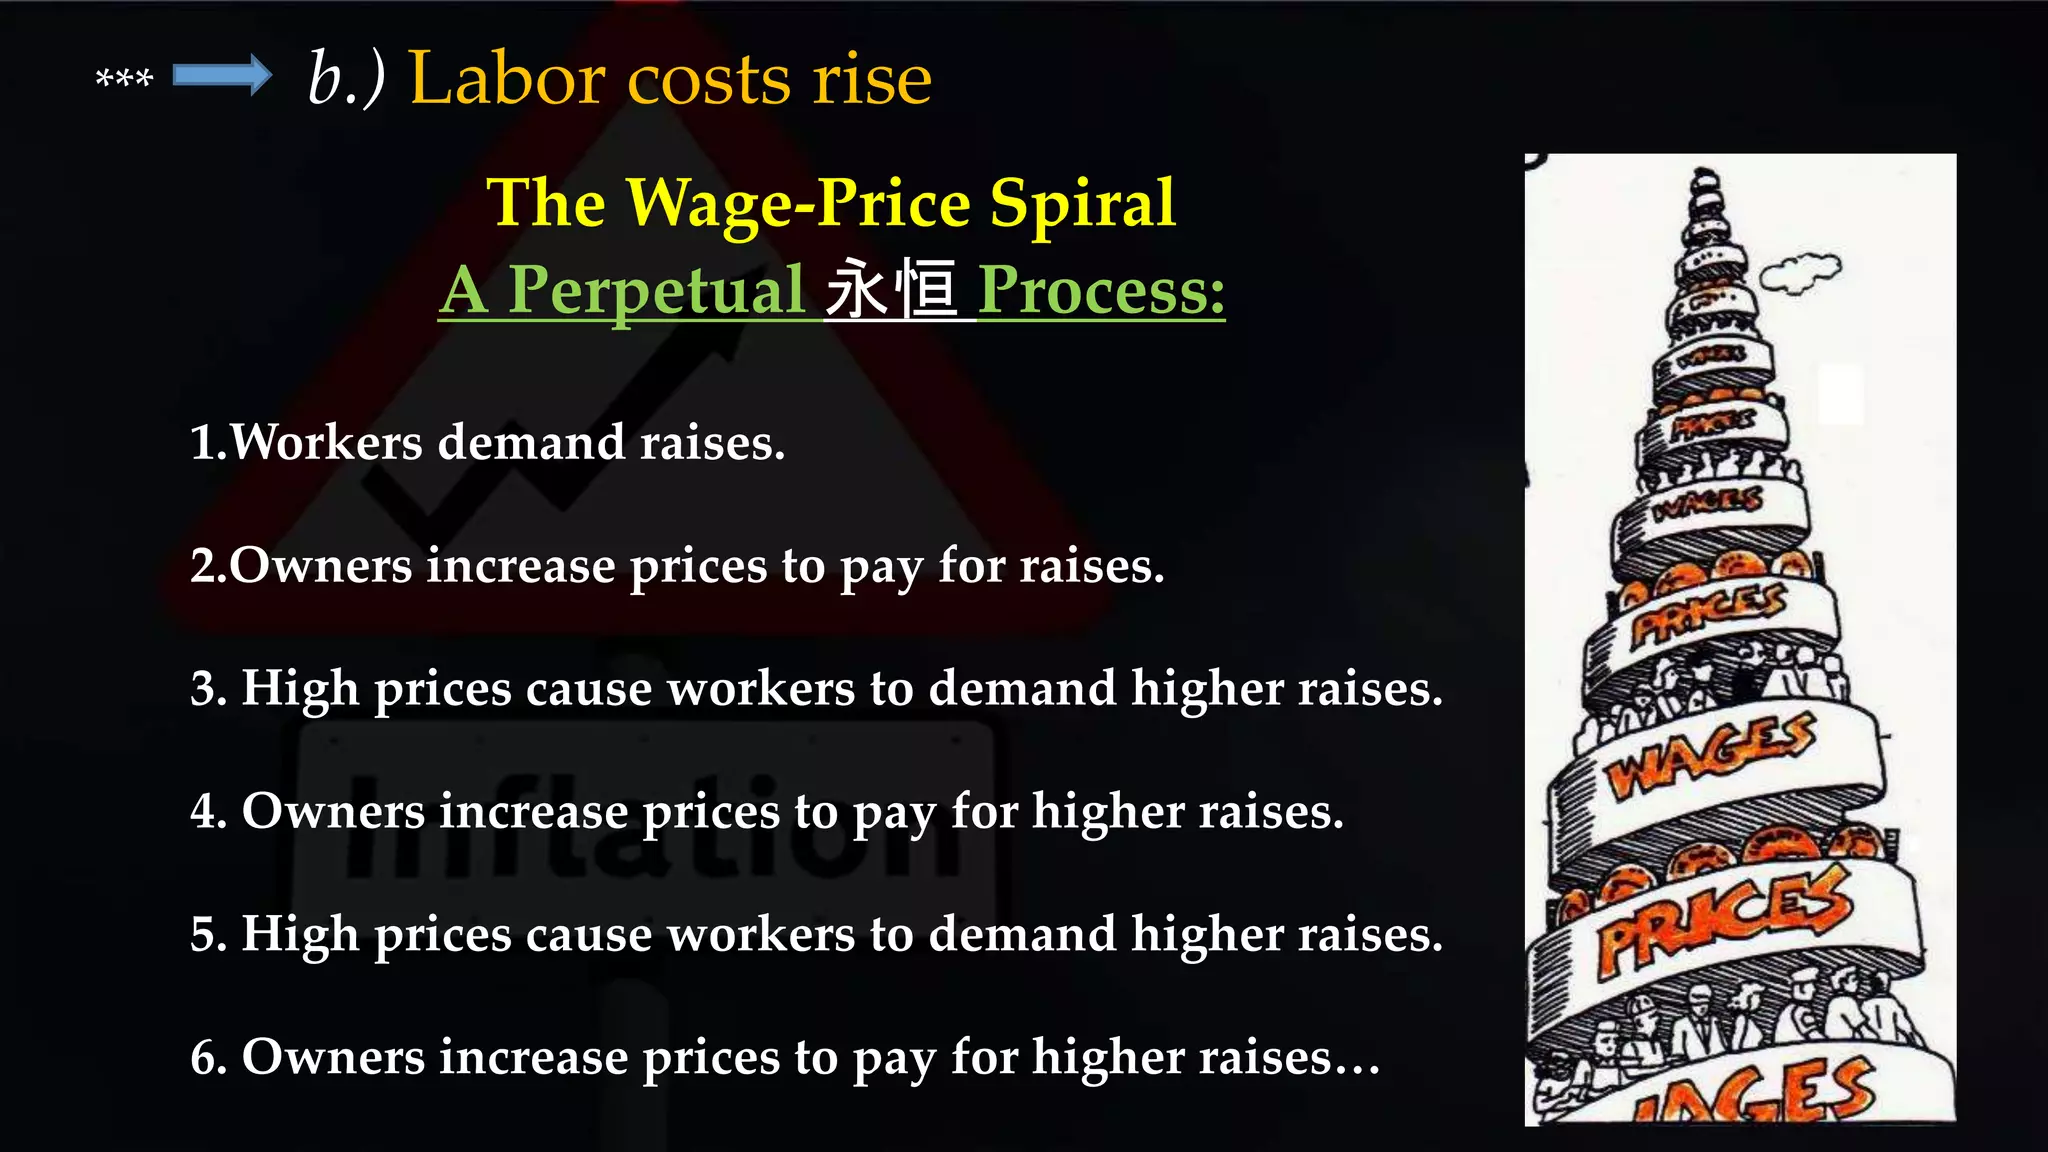
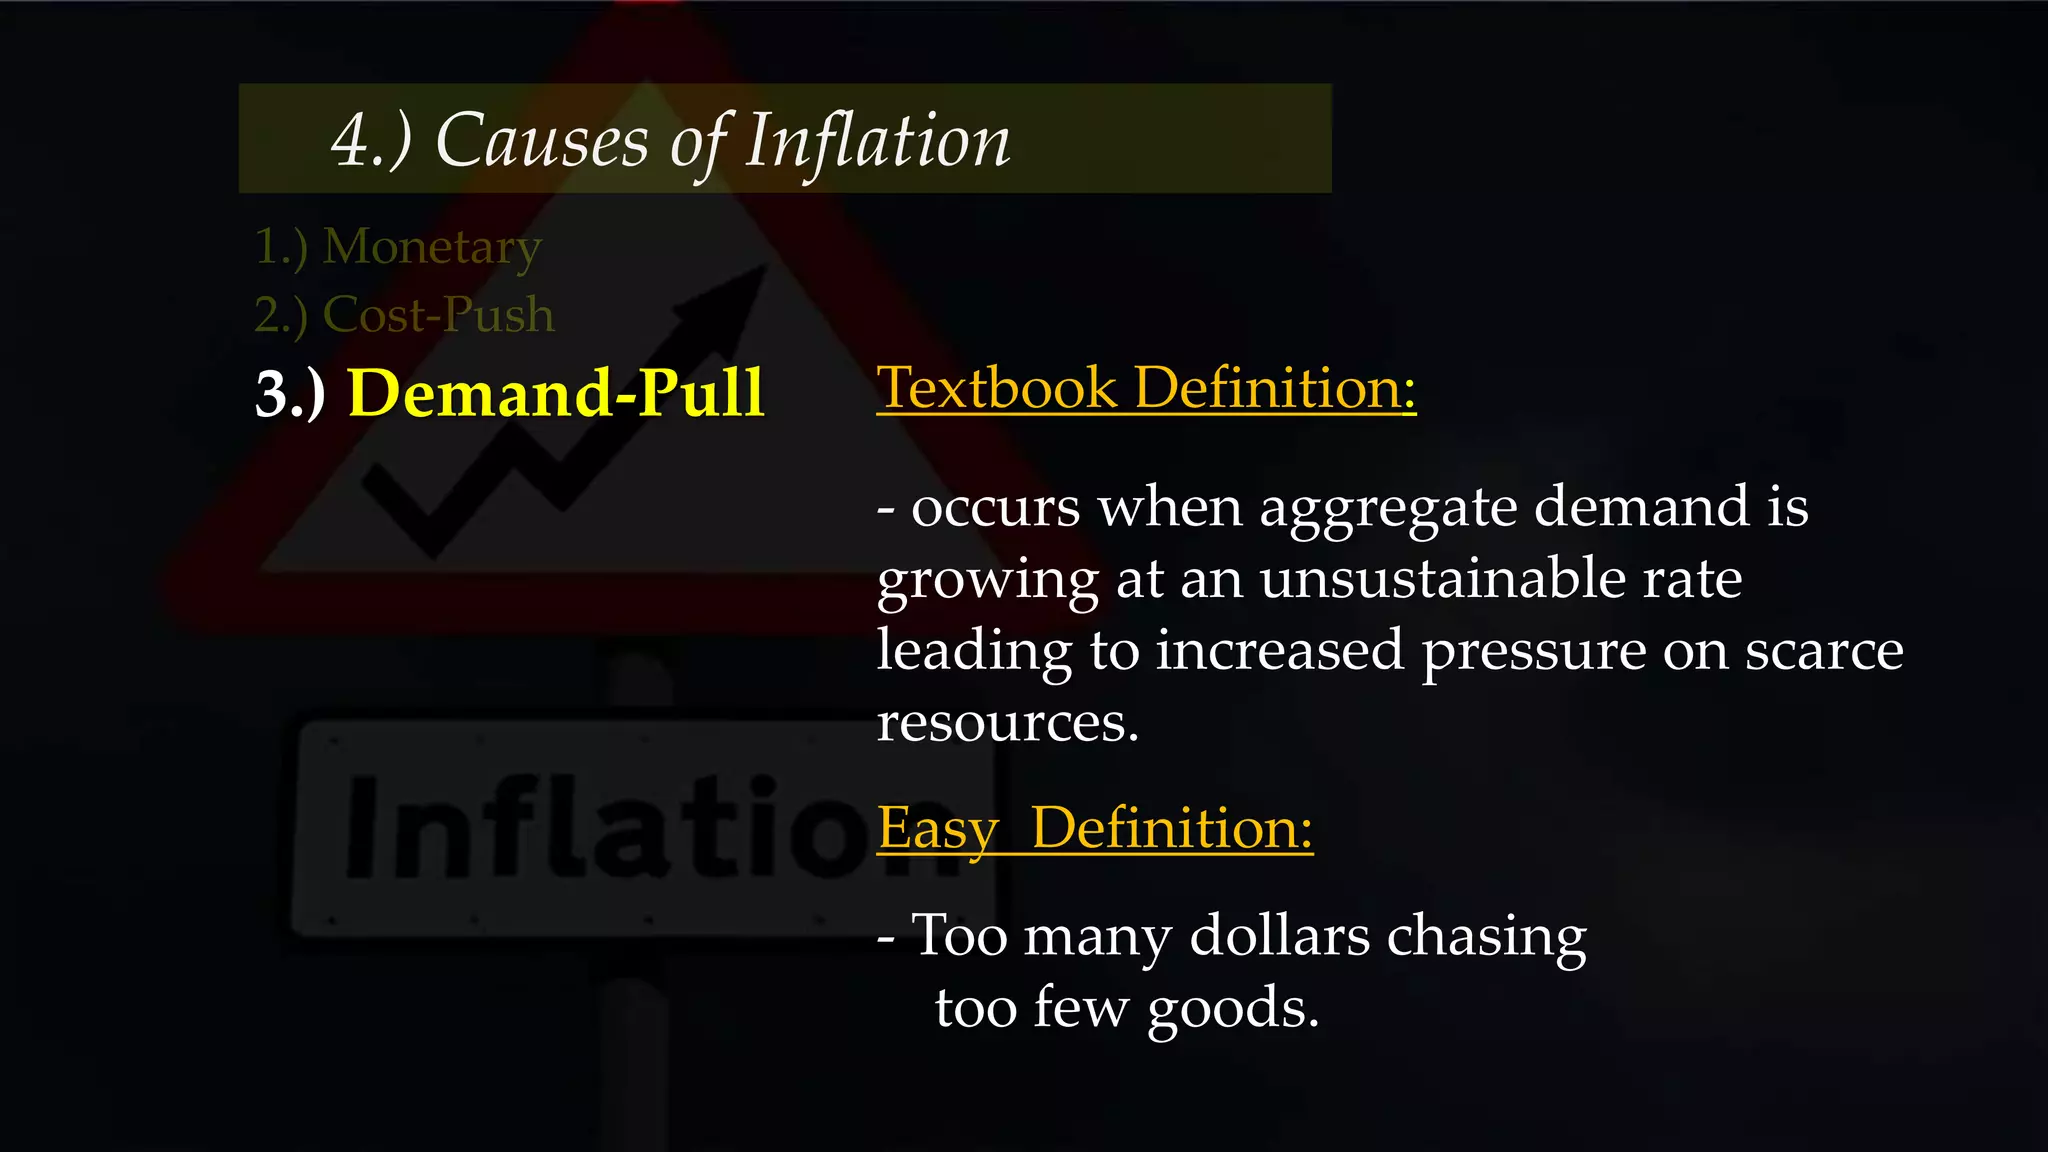
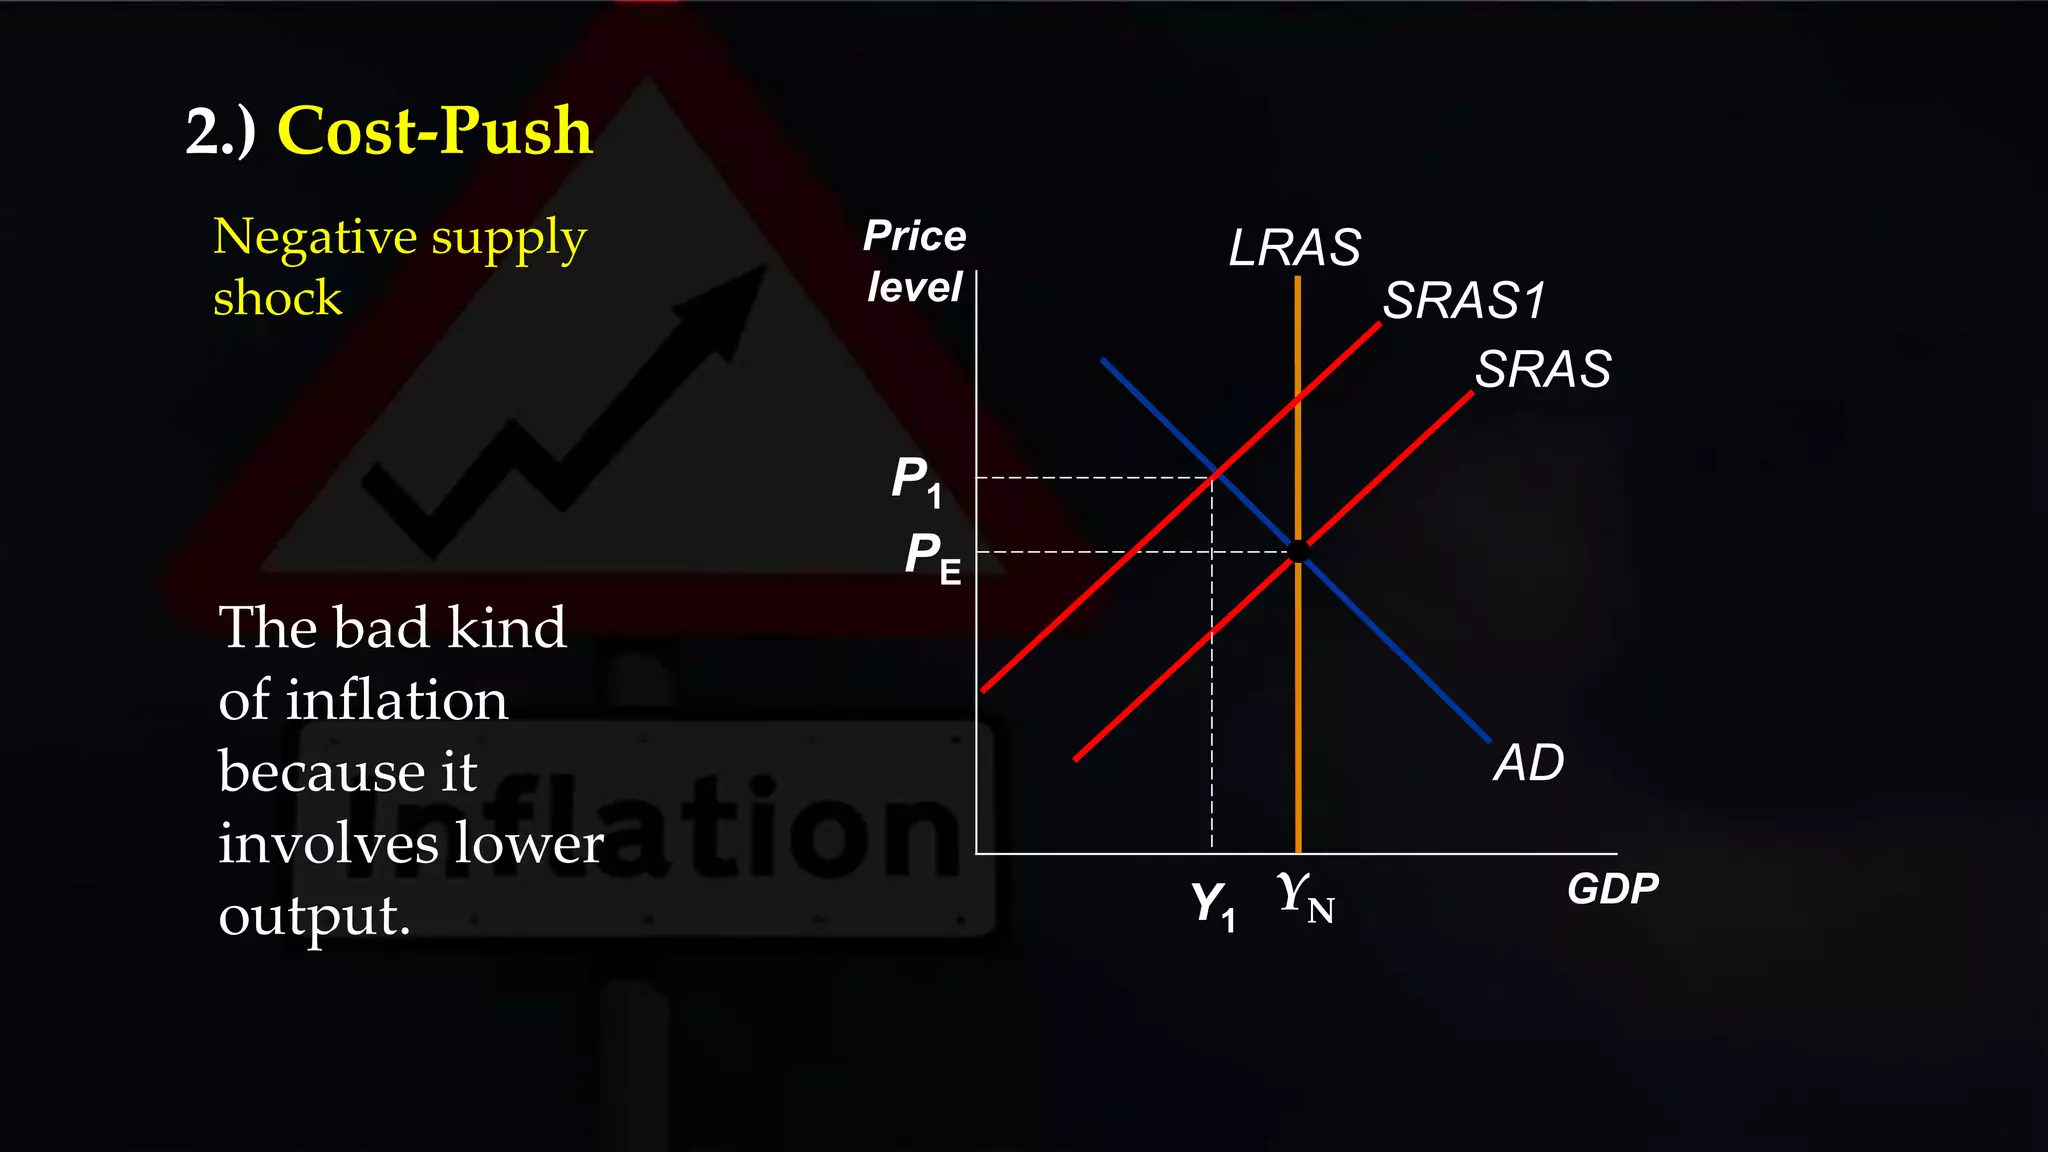
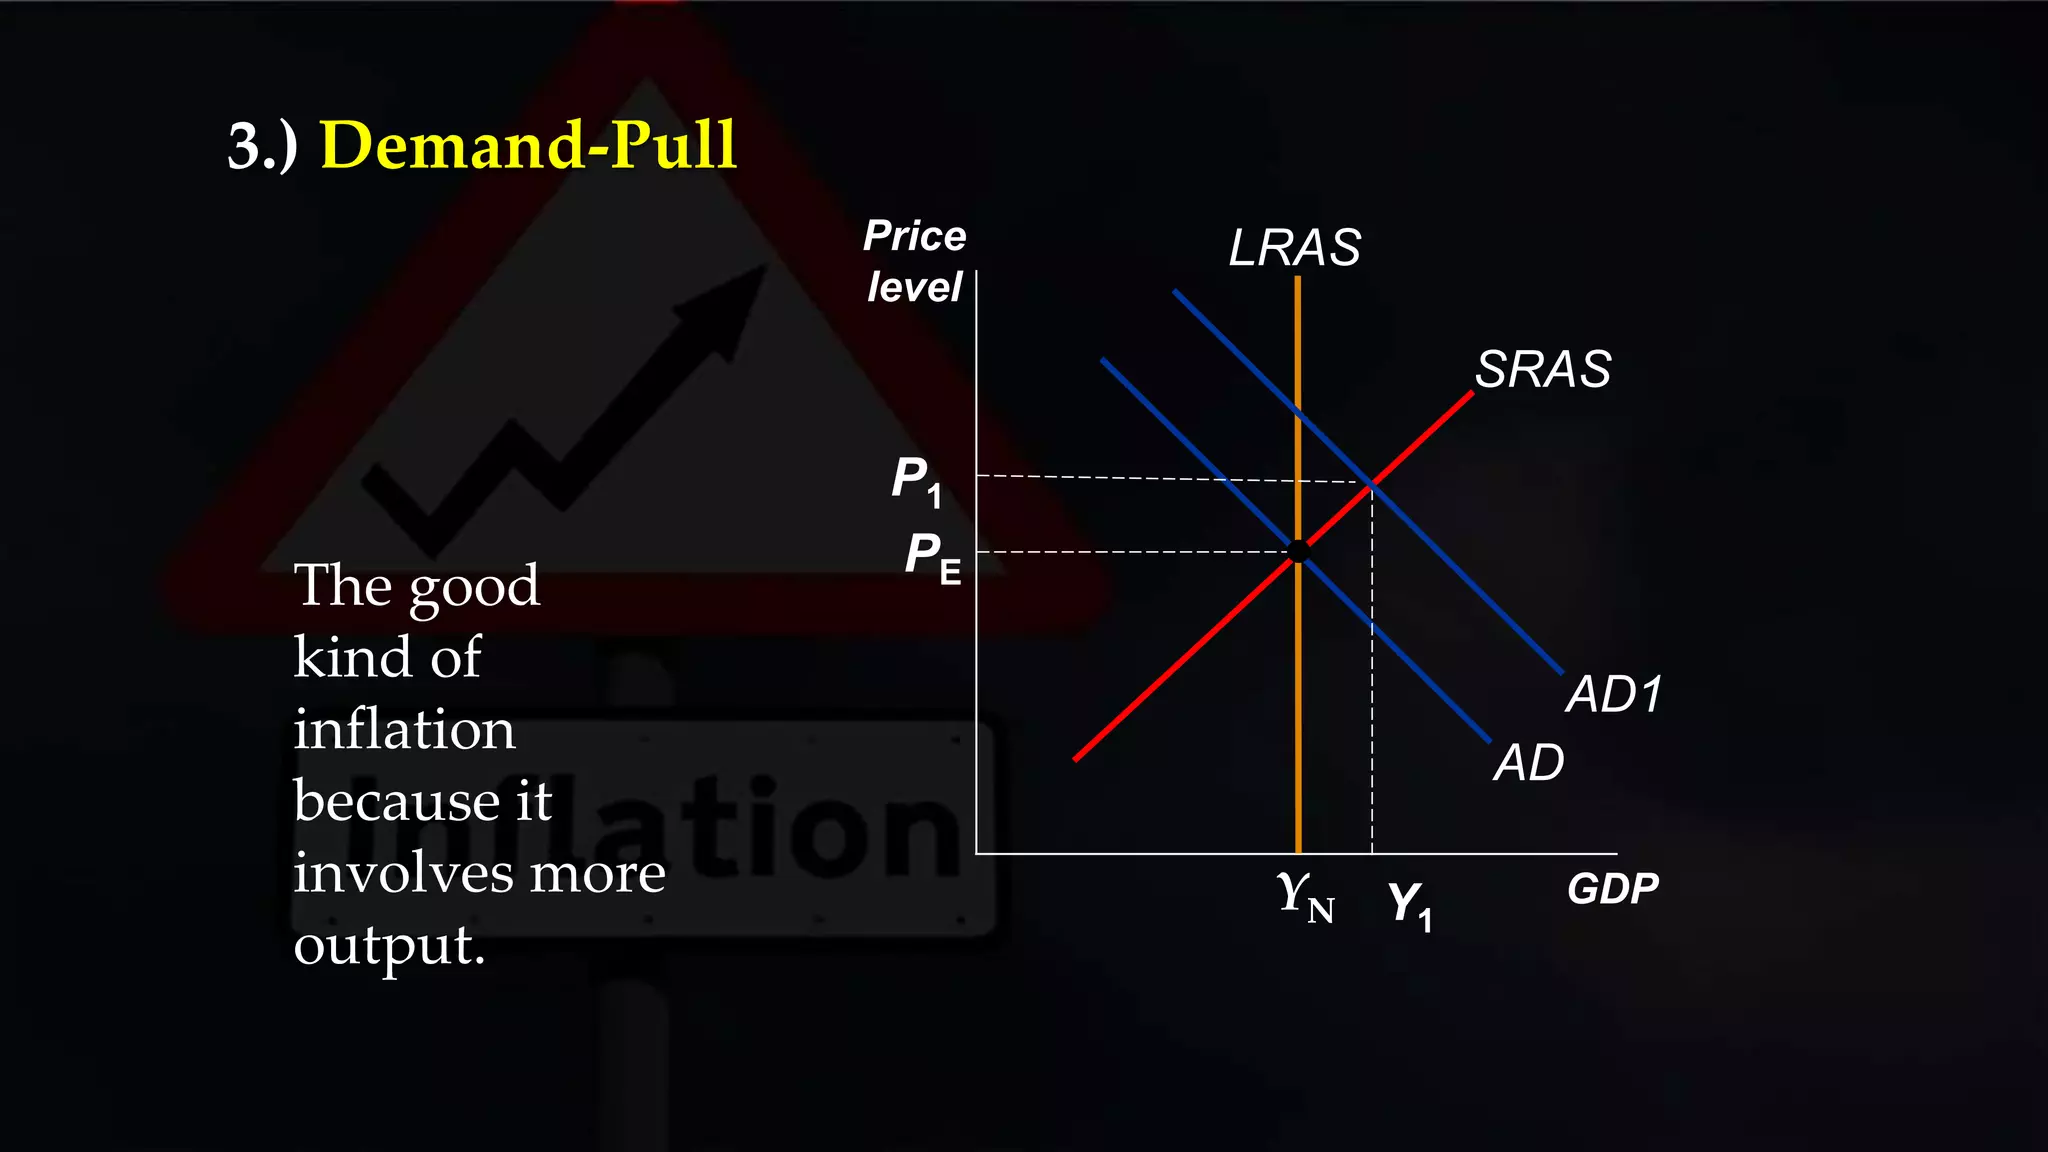
Inflation
(Part 2 – Causes and theory
of the quantity of money)
2.) CPI – measuring Inflation
Inflation:
4.) Causes of Inflation
1.) Inflation Vocabulary
5.) Consequences of Inflation
3.) Problems of CPI
Part 1
Part 2
Part 3
Inflation
3.) Demand-Pull
2.) Cost-Push
1.) Monetary *** A warning about inflation. In
the real world, inflation is
complex, and it’s causes are often
complex. Usually it’s not just one
reason that in happens like the
ones listed above, but many, so
many that economists constantly
disagree about the actual
reasons.
4.) Causes of Inflation
1.) Monetary
4.) Causes of Inflation
Government printing too much
money.
Easy Definition:
Textbook Definition:
The money supply is growing
faster then the increase in the
level of output in an economy
and forcing up prices.
Different parts of this theory that brings us to the conclusions we will work with:
Classical Dichotomy
Quantity Theory of Money
Neutrality of Money
Velocity of Money
(Q of Money)
(N of Money)
(V of Money)
2.1) Classical Theory
Remember this? Now we will
explore it all a little deeper to
explain the greater theory of the
quantity of money.
Different parts of this theory that brings us to the conclusions we will work with:
Classical Dichotomy
Quantity Theory of Money
Neutrality of Money
Velocity of Money
(Q of Money) - The quantity of
money determines the
value of money.
Quantity Theory of Money
Here, we will analyze the theory behind it with two approaches:
1.) An equation
2.) A money supply-demand diagram
Different parts of this theory that brings us to the conclusions we will work with:
Classical Dichotomy
Quantity Theory of Money
Neutrality of Money
Velocity of Money
(N of Money) - In the long run, the overall
price level adjusts to the
level at which the demand
for money equals the
supply of money.
(nominal changes don’t affect real changes)
Quantity Theory of Money
This is the conclusion of all
this theory that explains long
run inflation.
Different parts of this theory that brings us to the conclusions we will work with:
Classical Dichotomy
Quantity Theory of Money
Neutrality of Money
Velocity of Money (V of Money) - the rate at which money
changes hands.
v =
P x Y
M
Equation:
Quantity Theory of Money
P x Y = (price level) x (real GDP)
M = money supply
V = velocity
Households
Firms
G & S
markets
Demand stuff
Supply stuff
pay
money
earn
income
F & P
markets
Demand stuff
Supply stuff
earn
income
pay
money
Government
transferstaxes
taxessubsidies
Demand
stuff
Demand
stuffOther
Countries
Imports
Exports
The idea is that a single piece of
money gets used over and over in
this circular flow and the idea of
“Velocity” is trying to understand
how many times a single piece of
money gets used over and over.
Velocity of Money (V of Money)
v =
P x Y
M
Example with one good:比萨.
Y = real GDP = 5000比萨
P = price level = price of比萨 = 100元
P x Y = value of 比萨 = 500,000元
M = money supply = 100,000元
V = velocity = 500,000/100,000 = 5
The average yuan was used in 5 transactions.
Quantity Theory of Money
Quantity Theory of Money (Q of Money) - The quantity of
money determines the
value of money.
1.) Quantity Equation
or
Fisher Equation
v =
P x Y
M
Multiply both sides of formula by M:
M x V = P x Y=
Quantity Theory of Money
Velocity of Money (V of Money)
The Quantity Theory in 5 Steps:
1.) V is stable.
2.) So, a change in M causes nominal GDP (P x Y)
to change by the same percentage.
3.) A change in M does not affect Y:
money is neutral,
Y is determined by technology & resources
4.) So, P changes by same percentage as
P x Y and M.
5.) Rapid money supply growth causes rapid inflation.
Start with 1.) quantity equation:
M x V = P x Y
Quantity Theory of Money
Long Run Aggregate
Supply (LRAS)
Price
level
GDP
LRAS
Y
P1
P2Therefore: With the 1.) quantity
equation (fisher equation) if V is
stable that means an increase in
M just means and increase in P
and not Y, so in the long run we
just have inflation only.
M x V = P x Y
Inflation and the Classical Theory
Different parts of this theory that brings us to the conclusions we will work with:
Classical Dichotomy
Quantity Theory of Money
Neutrality of Money
Velocity of Money
(Q of Money) - The quantity of
money determines the
value of money.
Here, we will analyze the theory behind it with two approaches:
1.) An equation
2.)A money supply-demand diagram
Quantity Theory of Money
Value of
Money, 1/P
Price
Level, P
Quantity of
Money
1 1
¾ 1.33
½ 2
¼ 4
As the value of
money rises, the
price level falls.
2.) Money supply – demand diagram
- is the relationship between the
quantity of money supplied and
the nominal interest rate.
The Supply of
Money
(MS)
- It is controlled by banks and is
fixed at any given point in time
so it is a perfectly inelastic line.
Supply is fixed by
the central bank
2.) Money supply – demand diagram
Quantity Theory of Money
Value of
Money, 1/P
Price
Level, P
Quantity
of Money
1
¾
½
¼
1
1.33
2
4
MS1
$1000
Central Banks set MS
at some fixed value,
regardless of P.
2.) Money supply – demand diagram
Quantity Theory of Money
Money Demand
(MD)
-is the relationship between the
quantity of money demanded and
the nominal interest rate.
Demand is set by how
much people want in
liquid form
1.) The Transactions motive:
To pay for stuff
2.) The Precautionary motive:
Just in case bad S#!% happens
3.) The Speculative motive:
To speculate on investments such as
bonds.
Liquidity theory
2.) Money supply – demand diagram
Quantity Theory of Money
Money Demand
(MD)
Demand is set by how
much people want in
liquid form
2.) Money supply – demand diagram
Quantity Theory of Money
Money Demand
(MD)
-is the relationship between the
quantity of money demanded and
the nominal interest rate.
Demand is set by how
much people want in
liquid form
Depends on P:
An increase in P reduces
the value of money,
so more money is required
to buy g&s.
Value of
Money, 1/P
Price
Level, P
Quantity
of Money
1
¾
½
¼
1
1.33
2
4
MD1
A fall in value of money (or
increase in P) increases the
quantity of money demanded:
2.) Money supply – demand diagram
Depends on P:
An increase in
P reduces the
value of money,
so more money
is required to
buy g&s.
2.) Money supply – demand diagram
Quantity Theory of Money
Supply is fixed by
the central bank
The value of money is determined by the supply and demand for money
Demand is set by how
much people want in
liquid form
In the long run,
the overall price level adjusts to the level at which the
demand for money equals the supply of money.
MS1
$1000
Value of
Money, 1/P
Price
Level, P
Quantity
of Money
1
¾
½
¼
1
1.33
2
4
MD1
P adjusts to equate
quantity of money
demanded with money
supply.
EQ
price
level
EQ
value
of
money
A
2.) Money supply – demand diagram
MS1
$1000
Value of
Money, 1/P
Price
Level, P
Quantity
of Money
1
¾
½
¼
1
1.33
2
4
MD1
EQ
price
level
EQ
value
of
money
A
MS2
$2000
B
Then the value of
money falls,
and P rises.
Suppose the central
bank increases the
money supply.
2.) Money supply – demand diagram
How does this work? Short version:
 At the initial P, an increase in MS causes
excess supply of money.
 People get rid of their excess money by
spending it on g&s or by loaning it to others,
who spend it. Result: increased demand for
goods.
 But supply of goods does not increase,
so prices must rise.
Result from graph: Increasing MS causes P to rise.
2.) Money supply – demand diagram
Quantity Theory of Money
Price
level
GDP
LRAS
Y
P1
P2
4.) Causes of Inflation
2.) Cost-Push
Negative supply
shock
- occurs when firms respond to
rising costs, by increasing prices
to protect their profit margins.
- Higher production costs
increase prices.
Easy Definition:
Textbook Definition:
Price
level
GDP
AD
SRAS
PE
LRAS
YN
SRAS1
Y1
P1
The bad kind of
inflation because
it involves lower
output.
2.) Cost-Push
Negative supply
shock
Cost-push inflation is really
the same as the term
Stagflation
4.) Causes of Inflation
2.) Cost-Push
Reasons:
a.) Input costs rise - Raw material costs rise.
b.) Labor costs rise - Pay more for workers means
increased input costs.
c.) Fall in the
exchange rate - Raw materials imported
costs rise.
d.) Expectations of
inflation
- If inflation is expected, raise
prices even higher.
***
A Perpetual 永恒 Process:
1.Workers demand raises.
2.Owners increase prices to pay for raises.
3. High prices cause workers to demand higher raises.
4. Owners increase prices to pay for higher raises.
5. High prices cause workers to demand higher raises.
6. Owners increase prices to pay for higher raises…
The Wage-Price Spiral
b.) Labor costs rise***
4.) Causes of Inflation
- occurs when aggregate demand is
growing at an unsustainable rate
leading to increased pressure on scarce
resources.
- Too many dollars chasing
too few goods.
Easy Definition:
Textbook Definition:3.) Demand-Pull
Price
level
GDP
AD
SRAS
PE
LRAS
YN Y1
P1
AD1
The good
kind of
inflation
because it
involves more
output.
3.) Demand-Pull
4.) Causes of Inflation
3.) Demand-Pull
Reasons:
a.) Growing economy - Demand rising faster then supply
can keep up.i.) *wealth effect
b.) Fall in the
exchange rate
- Demand internationally rising
faster then supply can keep up.
c.) Expectations of
inflation
- If inflation is expected, raise
prices even higher.
To summarize so far…
- a sustained increase in the cost of living or
the general price level leading to a fall in
the purchasing power of money.
Inflation
- is measured by the annual percentage
change in consumer prices.
Rate of
Inflation
1.) Inflation Vocabulary
- when the rate of inflation becomes
negative.
Deflation
- the value of money becomes worthless.Hyperinflation
- measures the typical consumer’s cost of
living with only the typical things that are
purchased.
- the main way to measure inflation.
Consumer Price
Index (CPI)
1.) Inflation Vocabulary
How the CPI Is Calculated:
- Government surveys consumers to
determine what’s in the typical consumer’s
“shopping basket.”
2.) CPI – measuring Inflation
1.) Fix the “basket”
- Government then collects data on the
prices of all the goods in the basket.
2.) Find the prices
3.) Compute the
basket’s cost
-Use the prices to
compute the total cost of
the basket.
How the CPI Is Calculated:
- The CPI in any year equals:
2.) CPI – measuring Inflation
4.) Choose a base year and compute the index
100 x
cost of basket in current year
cost of basket in base year
- The percentage change in the CPI from the preceding period:
5.) Compute the inflation rate
CPI this year – CPI last year
CPI last year
Inflation
rate
x 100%=
3.) Problems of CPI
*** The general problem is that CPI
tends to overstate the actual increase
in the cost of living.
- Introduction of New Goods
- Substitution Bias
- Unmeasured Quality Change
- Discount sales
Different parts of this theory that brings us to the conclusions we will work with:
Classical Dichotomy
Quantity Theory of Money
Neutrality of Money
Velocity of Money (V of Money) - the rate at which money
changes hands.
v =
P x Y
M
Equation:
Inflation and the Classical Theory
Long Run Aggregate
Supply (LRAS)
Price
level
GDP
LRAS
Y
P1
P2Therefore: With the quantity
equation (fisher equation) if V
is stable that means an increase
in M just means and increase
in P and not Y, so in the long
run we just have inflation only.
M x V = P x Y
Inflation and the Classical Theory
MS1
$1000
Value of
Money, 1/P
Price
Level, P
Quantity
of Money
1
¾
½
¼
1
1.33
2
4
MD1
EQ
price
level
EQ
value
of
money
A
MS2
$2000
B
Then the value of
money falls,
and P rises.
Suppose the central
bank increases the
money supply.
2.) Money supply – demand diagram
How does this work? Short version:
 At the initial P, an increase in MS causes
excess supply of money.
 People get rid of their excess money by
spending it on g&s or by loaning it to others,
who spend it. Result: increased demand for
goods.
 But supply of goods does not increase,
so prices must rise.
Result from graph: Increasing MS causes P to rise.
2.) Money supply – demand diagram
Quantity Theory of Money
Price
level
GDP
LRAS
Y
P1
P2
Price
level
GDP
AD
SRAS
PE
LRAS
YN
SRAS1
Y1
P1
The bad kind
of inflation
because it
involves lower
output.
2.) Cost-Push
Negative supply
shock
4.) Causes of Inflation
2.) Cost-Push
Reasons:
a.) Input costs rise - Raw material costs rise.
b.) Labor costs rise - Pay more for workers means
increased input costs.
c.) Fall in the
exchange rate - Raw materials imported
costs rise.
d.) Expectations of
inflation
- If inflation is expected, raise
prices even higher.
Price
level
GDP
AD
SRAS
PE
LRAS
YN Y1
P1
AD1
The good
kind of
inflation
because it
involves more
output.
3.) Demand-Pull
4.) Causes of Inflation
3.) Demand-Pull
Reasons:
a.) Growing economy - Demand rising faster then supply
can keep up.i.) *wealth effect
b.) Fall in the
exchange rate
- Demand internationally rising
faster then supply can keep up.
c.) Expectations of
inflation
- If inflation is expected, raise
prices even higher.
The end of
part 2
Thank you 

Inflation SFLS types

  • 1.
    Inflation (Part 2 –Causes and theory of the quantity of money)
  • 2.
    2.) CPI –measuring Inflation Inflation: 4.) Causes of Inflation 1.) Inflation Vocabulary 5.) Consequences of Inflation 3.) Problems of CPI Part 1 Part 2 Part 3
  • 3.
  • 4.
    3.) Demand-Pull 2.) Cost-Push 1.)Monetary *** A warning about inflation. In the real world, inflation is complex, and it’s causes are often complex. Usually it’s not just one reason that in happens like the ones listed above, but many, so many that economists constantly disagree about the actual reasons. 4.) Causes of Inflation
  • 5.
    1.) Monetary 4.) Causesof Inflation Government printing too much money. Easy Definition: Textbook Definition: The money supply is growing faster then the increase in the level of output in an economy and forcing up prices.
  • 6.
    Different parts ofthis theory that brings us to the conclusions we will work with: Classical Dichotomy Quantity Theory of Money Neutrality of Money Velocity of Money (Q of Money) (N of Money) (V of Money) 2.1) Classical Theory Remember this? Now we will explore it all a little deeper to explain the greater theory of the quantity of money.
  • 7.
    Different parts ofthis theory that brings us to the conclusions we will work with: Classical Dichotomy Quantity Theory of Money Neutrality of Money Velocity of Money (Q of Money) - The quantity of money determines the value of money. Quantity Theory of Money Here, we will analyze the theory behind it with two approaches: 1.) An equation 2.) A money supply-demand diagram
  • 8.
    Different parts ofthis theory that brings us to the conclusions we will work with: Classical Dichotomy Quantity Theory of Money Neutrality of Money Velocity of Money (N of Money) - In the long run, the overall price level adjusts to the level at which the demand for money equals the supply of money. (nominal changes don’t affect real changes) Quantity Theory of Money This is the conclusion of all this theory that explains long run inflation.
  • 9.
    Different parts ofthis theory that brings us to the conclusions we will work with: Classical Dichotomy Quantity Theory of Money Neutrality of Money Velocity of Money (V of Money) - the rate at which money changes hands. v = P x Y M Equation: Quantity Theory of Money P x Y = (price level) x (real GDP) M = money supply V = velocity
  • 10.
    Households Firms G & S markets Demandstuff Supply stuff pay money earn income F & P markets Demand stuff Supply stuff earn income pay money Government transferstaxes taxessubsidies Demand stuff Demand stuffOther Countries Imports Exports The idea is that a single piece of money gets used over and over in this circular flow and the idea of “Velocity” is trying to understand how many times a single piece of money gets used over and over.
  • 11.
    Velocity of Money(V of Money) v = P x Y M Example with one good:比萨. Y = real GDP = 5000比萨 P = price level = price of比萨 = 100元 P x Y = value of 比萨 = 500,000元 M = money supply = 100,000元 V = velocity = 500,000/100,000 = 5 The average yuan was used in 5 transactions. Quantity Theory of Money
  • 12.
    Quantity Theory ofMoney (Q of Money) - The quantity of money determines the value of money. 1.) Quantity Equation or Fisher Equation v = P x Y M Multiply both sides of formula by M: M x V = P x Y= Quantity Theory of Money Velocity of Money (V of Money)
  • 13.
    The Quantity Theoryin 5 Steps: 1.) V is stable. 2.) So, a change in M causes nominal GDP (P x Y) to change by the same percentage. 3.) A change in M does not affect Y: money is neutral, Y is determined by technology & resources 4.) So, P changes by same percentage as P x Y and M. 5.) Rapid money supply growth causes rapid inflation. Start with 1.) quantity equation: M x V = P x Y Quantity Theory of Money
  • 14.
    Long Run Aggregate Supply(LRAS) Price level GDP LRAS Y P1 P2Therefore: With the 1.) quantity equation (fisher equation) if V is stable that means an increase in M just means and increase in P and not Y, so in the long run we just have inflation only. M x V = P x Y Inflation and the Classical Theory
  • 15.
    Different parts ofthis theory that brings us to the conclusions we will work with: Classical Dichotomy Quantity Theory of Money Neutrality of Money Velocity of Money (Q of Money) - The quantity of money determines the value of money. Here, we will analyze the theory behind it with two approaches: 1.) An equation 2.)A money supply-demand diagram Quantity Theory of Money
  • 16.
    Value of Money, 1/P Price Level,P Quantity of Money 1 1 ¾ 1.33 ½ 2 ¼ 4 As the value of money rises, the price level falls. 2.) Money supply – demand diagram
  • 17.
    - is therelationship between the quantity of money supplied and the nominal interest rate. The Supply of Money (MS) - It is controlled by banks and is fixed at any given point in time so it is a perfectly inelastic line. Supply is fixed by the central bank 2.) Money supply – demand diagram Quantity Theory of Money
  • 18.
    Value of Money, 1/P Price Level,P Quantity of Money 1 ¾ ½ ¼ 1 1.33 2 4 MS1 $1000 Central Banks set MS at some fixed value, regardless of P. 2.) Money supply – demand diagram
  • 19.
    2.) Money supply– demand diagram Quantity Theory of Money Money Demand (MD) -is the relationship between the quantity of money demanded and the nominal interest rate. Demand is set by how much people want in liquid form
  • 20.
    1.) The Transactionsmotive: To pay for stuff 2.) The Precautionary motive: Just in case bad S#!% happens 3.) The Speculative motive: To speculate on investments such as bonds. Liquidity theory 2.) Money supply – demand diagram Quantity Theory of Money Money Demand (MD) Demand is set by how much people want in liquid form
  • 21.
    2.) Money supply– demand diagram Quantity Theory of Money Money Demand (MD) -is the relationship between the quantity of money demanded and the nominal interest rate. Demand is set by how much people want in liquid form Depends on P: An increase in P reduces the value of money, so more money is required to buy g&s.
  • 22.
    Value of Money, 1/P Price Level,P Quantity of Money 1 ¾ ½ ¼ 1 1.33 2 4 MD1 A fall in value of money (or increase in P) increases the quantity of money demanded: 2.) Money supply – demand diagram Depends on P: An increase in P reduces the value of money, so more money is required to buy g&s.
  • 23.
    2.) Money supply– demand diagram Quantity Theory of Money Supply is fixed by the central bank The value of money is determined by the supply and demand for money Demand is set by how much people want in liquid form In the long run, the overall price level adjusts to the level at which the demand for money equals the supply of money.
  • 24.
    MS1 $1000 Value of Money, 1/P Price Level,P Quantity of Money 1 ¾ ½ ¼ 1 1.33 2 4 MD1 P adjusts to equate quantity of money demanded with money supply. EQ price level EQ value of money A 2.) Money supply – demand diagram
  • 25.
    MS1 $1000 Value of Money, 1/P Price Level,P Quantity of Money 1 ¾ ½ ¼ 1 1.33 2 4 MD1 EQ price level EQ value of money A MS2 $2000 B Then the value of money falls, and P rises. Suppose the central bank increases the money supply. 2.) Money supply – demand diagram
  • 26.
    How does thiswork? Short version:  At the initial P, an increase in MS causes excess supply of money.  People get rid of their excess money by spending it on g&s or by loaning it to others, who spend it. Result: increased demand for goods.  But supply of goods does not increase, so prices must rise. Result from graph: Increasing MS causes P to rise. 2.) Money supply – demand diagram Quantity Theory of Money Price level GDP LRAS Y P1 P2
  • 27.
    4.) Causes ofInflation 2.) Cost-Push Negative supply shock - occurs when firms respond to rising costs, by increasing prices to protect their profit margins. - Higher production costs increase prices. Easy Definition: Textbook Definition:
  • 28.
    Price level GDP AD SRAS PE LRAS YN SRAS1 Y1 P1 The bad kindof inflation because it involves lower output. 2.) Cost-Push Negative supply shock
  • 29.
    Cost-push inflation isreally the same as the term Stagflation
  • 30.
    4.) Causes ofInflation 2.) Cost-Push Reasons: a.) Input costs rise - Raw material costs rise. b.) Labor costs rise - Pay more for workers means increased input costs. c.) Fall in the exchange rate - Raw materials imported costs rise. d.) Expectations of inflation - If inflation is expected, raise prices even higher. ***
  • 31.
    A Perpetual 永恒Process: 1.Workers demand raises. 2.Owners increase prices to pay for raises. 3. High prices cause workers to demand higher raises. 4. Owners increase prices to pay for higher raises. 5. High prices cause workers to demand higher raises. 6. Owners increase prices to pay for higher raises… The Wage-Price Spiral b.) Labor costs rise***
  • 32.
    4.) Causes ofInflation - occurs when aggregate demand is growing at an unsustainable rate leading to increased pressure on scarce resources. - Too many dollars chasing too few goods. Easy Definition: Textbook Definition:3.) Demand-Pull
  • 33.
    Price level GDP AD SRAS PE LRAS YN Y1 P1 AD1 The good kindof inflation because it involves more output. 3.) Demand-Pull
  • 34.
    4.) Causes ofInflation 3.) Demand-Pull Reasons: a.) Growing economy - Demand rising faster then supply can keep up.i.) *wealth effect b.) Fall in the exchange rate - Demand internationally rising faster then supply can keep up. c.) Expectations of inflation - If inflation is expected, raise prices even higher.
  • 35.
  • 36.
    - a sustainedincrease in the cost of living or the general price level leading to a fall in the purchasing power of money. Inflation - is measured by the annual percentage change in consumer prices. Rate of Inflation 1.) Inflation Vocabulary - when the rate of inflation becomes negative. Deflation - the value of money becomes worthless.Hyperinflation
  • 37.
    - measures thetypical consumer’s cost of living with only the typical things that are purchased. - the main way to measure inflation. Consumer Price Index (CPI) 1.) Inflation Vocabulary
  • 38.
    How the CPIIs Calculated: - Government surveys consumers to determine what’s in the typical consumer’s “shopping basket.” 2.) CPI – measuring Inflation 1.) Fix the “basket” - Government then collects data on the prices of all the goods in the basket. 2.) Find the prices 3.) Compute the basket’s cost -Use the prices to compute the total cost of the basket.
  • 39.
    How the CPIIs Calculated: - The CPI in any year equals: 2.) CPI – measuring Inflation 4.) Choose a base year and compute the index 100 x cost of basket in current year cost of basket in base year - The percentage change in the CPI from the preceding period: 5.) Compute the inflation rate CPI this year – CPI last year CPI last year Inflation rate x 100%=
  • 40.
    3.) Problems ofCPI *** The general problem is that CPI tends to overstate the actual increase in the cost of living. - Introduction of New Goods - Substitution Bias - Unmeasured Quality Change - Discount sales
  • 41.
    Different parts ofthis theory that brings us to the conclusions we will work with: Classical Dichotomy Quantity Theory of Money Neutrality of Money Velocity of Money (V of Money) - the rate at which money changes hands. v = P x Y M Equation: Inflation and the Classical Theory
  • 42.
    Long Run Aggregate Supply(LRAS) Price level GDP LRAS Y P1 P2Therefore: With the quantity equation (fisher equation) if V is stable that means an increase in M just means and increase in P and not Y, so in the long run we just have inflation only. M x V = P x Y Inflation and the Classical Theory
  • 43.
    MS1 $1000 Value of Money, 1/P Price Level,P Quantity of Money 1 ¾ ½ ¼ 1 1.33 2 4 MD1 EQ price level EQ value of money A MS2 $2000 B Then the value of money falls, and P rises. Suppose the central bank increases the money supply. 2.) Money supply – demand diagram
  • 44.
    How does thiswork? Short version:  At the initial P, an increase in MS causes excess supply of money.  People get rid of their excess money by spending it on g&s or by loaning it to others, who spend it. Result: increased demand for goods.  But supply of goods does not increase, so prices must rise. Result from graph: Increasing MS causes P to rise. 2.) Money supply – demand diagram Quantity Theory of Money Price level GDP LRAS Y P1 P2
  • 45.
    Price level GDP AD SRAS PE LRAS YN SRAS1 Y1 P1 The bad kind ofinflation because it involves lower output. 2.) Cost-Push Negative supply shock
  • 46.
    4.) Causes ofInflation 2.) Cost-Push Reasons: a.) Input costs rise - Raw material costs rise. b.) Labor costs rise - Pay more for workers means increased input costs. c.) Fall in the exchange rate - Raw materials imported costs rise. d.) Expectations of inflation - If inflation is expected, raise prices even higher.
  • 47.
    Price level GDP AD SRAS PE LRAS YN Y1 P1 AD1 The good kindof inflation because it involves more output. 3.) Demand-Pull
  • 48.
    4.) Causes ofInflation 3.) Demand-Pull Reasons: a.) Growing economy - Demand rising faster then supply can keep up.i.) *wealth effect b.) Fall in the exchange rate - Demand internationally rising faster then supply can keep up. c.) Expectations of inflation - If inflation is expected, raise prices even higher.
  • 49.
    The end of part2 Thank you 