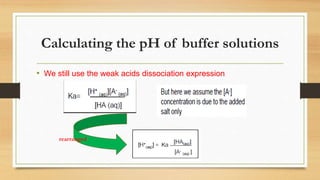
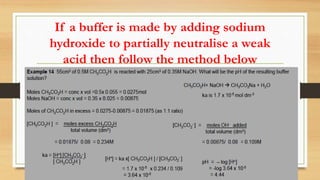
This document discusses acid-base equilibria and calculations involving pH. It defines Bronsted-Lowry acids and bases as substances that can donate or accept protons. It describes how to calculate the pH of strong acids, strong bases, weak acids and buffer solutions. It also covers acid-base indicators, and titration curves for strong vs weak acids and bases.


![Calculating pH
Where [H+] is the concentration of hydrogen ions in the
solution
Calculating pH of strong acids](https://image.slidesharecdn.com/acidbaseequilibriappt-240318182233-4e15d1b0/85/Acid-Base-Equilibria-ppt-pptx-titrations-4-320.jpg)
![• The concentration of hydrogen ions in a monoprotic strong acid will be the
same as the concentration of the acidFor HCl and HNO3 the [H+(aq)] will
be the same as the
• original concentration of the acid.
• For 0.1M HCl the pH will be –log[0.1] =1.00.](https://image.slidesharecdn.com/acidbaseequilibriappt-240318182233-4e15d1b0/85/Acid-Base-Equilibria-ppt-pptx-titrations-5-320.jpg)
![Finding [H+] from pH
• [H+] = 1 x 10-pH](https://image.slidesharecdn.com/acidbaseequilibriappt-240318182233-4e15d1b0/85/Acid-Base-Equilibria-ppt-pptx-titrations-6-320.jpg)


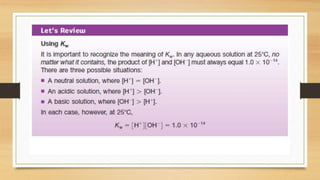
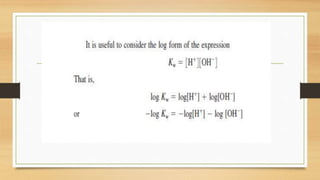
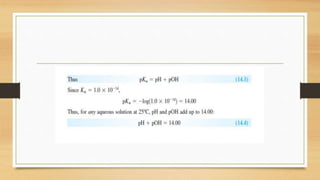
![• Because [H2O (l)] is much bigger than theconcentrations of the ions,
we assume its value is constant and make a new constant Kw
• At 25oC the value of Kw for all aqueous solutions is 1x10-14 mol2dm-6](https://image.slidesharecdn.com/acidbaseequilibriappt-240318182233-4e15d1b0/85/Acid-Base-Equilibria-ppt-pptx-titrations-9-320.jpg)
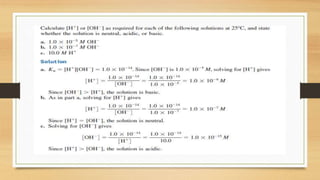
![• The Kw expression can be used to calculate [H+ (aq)] ions if we know the
[OH- (aq)] ions and vice versa
• Finding pH of pure water.](https://image.slidesharecdn.com/acidbaseequilibriappt-240318182233-4e15d1b0/85/Acid-Base-Equilibria-ppt-pptx-titrations-10-320.jpg)

![Calculating pH of Strong Base
• For bases we are normally given the concentration of the hydroxide ion.
• To work out the pH we need to work out [H+(aq)] using the kw expression.
• We need know
• The concentration of the OH- ions in solution
• The ionization expression for the ionization of water Kw = [H+] [OH–]
• As Kw = [H+] [OH–]
• [H+] =Kw/[OH–]](https://image.slidesharecdn.com/acidbaseequilibriappt-240318182233-4e15d1b0/85/Acid-Base-Equilibria-ppt-pptx-titrations-12-320.jpg)

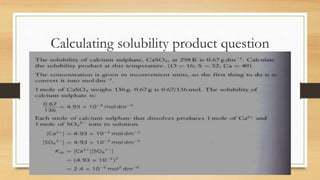
![Strong base (a quicker method)
A quick way to get the same answer is to:■■ find –log10 [OH–] (here –log10 [OH–] =
–log10 (0.0500)= 1.3).
■■ subtract this value from 14 (in this example
14 – 1.3 = 12.7).
This works because –log10 [H+] – log10 [OH–] = 14.](https://image.slidesharecdn.com/acidbaseequilibriappt-240318182233-4e15d1b0/85/Acid-Base-Equilibria-ppt-pptx-titrations-14-320.jpg)


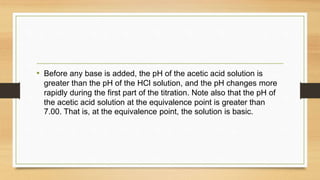
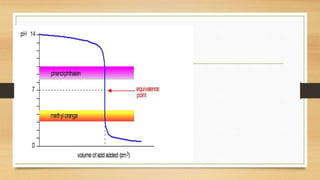
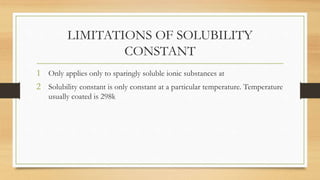
![• In contrast to strong acids and bases, the shape of the titration curve for a weak acid or a
weak base depends dramatically on the identity of the acid or the base and the
corresponding Ka or Kb.
• the pH also changes much more gradually around the eq
uivalence point in the titration of a weak acid or a weak base.
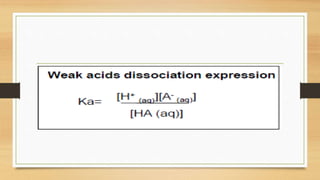
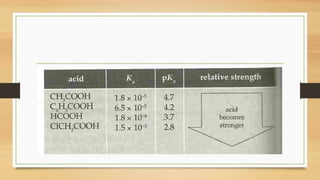
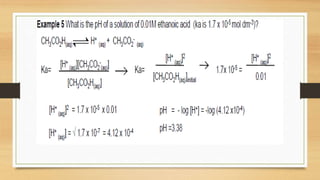
• [H+] of a solution of a weak acid (HA) is not equal to the concentration of the acid but
depends on both its pKa and its concentration.
• Because only a fraction of a weak acid dissociates,
• [H+] is less than [HA] . Thus the pH of a solution of a weak acid is greater than
the pH of a solution of a strong acid of the same concentration.](https://image.slidesharecdn.com/acidbaseequilibriappt-240318182233-4e15d1b0/85/Acid-Base-Equilibria-ppt-pptx-titrations-45-320.jpg)


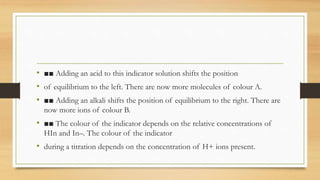
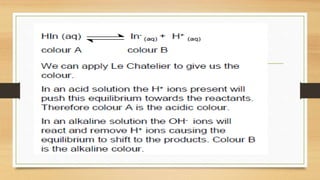
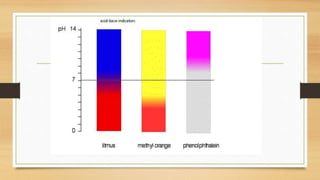
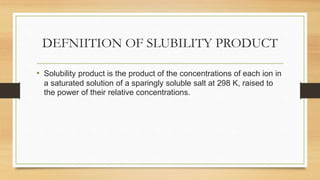
![Choosing an Indicator
• Indicators can be considered as weak acids.
• The acid must have a different colour to its conjugate . An indicator
changes colour from HIn to In- over a narrow range.
• Different indicators change colours over a different ranges
• The end-point of a titration is reached when [HIn] =[In-].
• To choose a correct indicator for a titration oneshould pick an indicator
whose end-point coincideswith the equivalence point for the titration.](https://image.slidesharecdn.com/acidbaseequilibriappt-240318182233-4e15d1b0/85/Acid-Base-Equilibria-ppt-pptx-titrations-52-320.jpg)


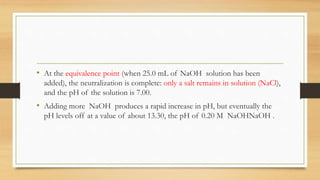
![• Most of H+ are removed in the reaction CH3COOH is weak acid. This
[H+] becomes less and the pH becomes larger than 7 . The solution is
alkaline.
• Salts of strong acids & weak bases form acidic solutions in water.
• ammonium sulphate
(NH4 )2SO4](https://image.slidesharecdn.com/acidbaseequilibriappt-240318182233-4e15d1b0/85/Acid-Base-Equilibria-ppt-pptx-titrations-78-320.jpg)


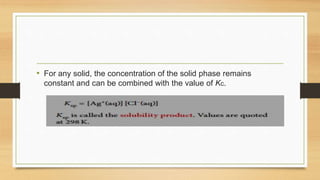
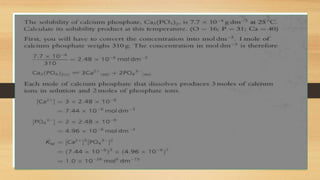


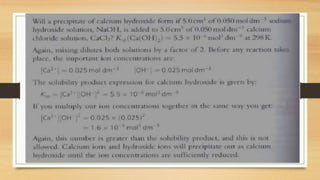
![• when we add a solution of sodium chloride to a saturated solution of silver chloride and silver
chloride precipitates.
• In a saturated solution of silver chloride in water, we have the following equilibrium:
• AgCl(s) Cl–(aq) + Ag+(aq)
• We now add a solution of sodium chloride:
• ■■ the chloride ion is common to both sodium chloride and silver chloride
• ■■ the added chloride ions shift the position of equilibrium to the left
• ■■ silver chloride is precipitated.
• The addition of the common ion, Cl–, has reduced the solubility of the silver chloride because its
solubility product has been exceeded. When [Ag+] [Cl–] is greater than the Ksp for silver
chloride a precipitate will form.](https://image.slidesharecdn.com/acidbaseequilibriappt-240318182233-4e15d1b0/85/Acid-Base-Equilibria-ppt-pptx-titrations-91-320.jpg)