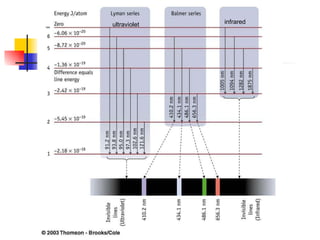
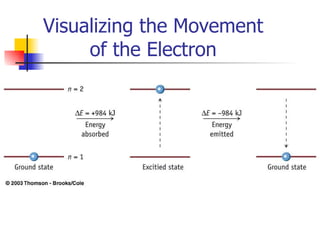
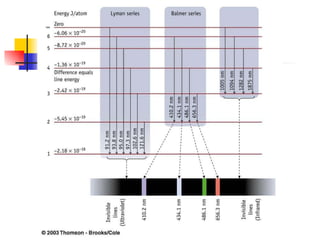
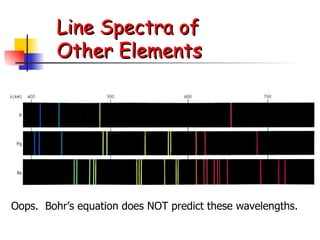
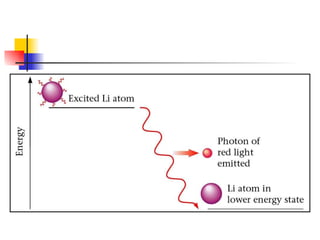
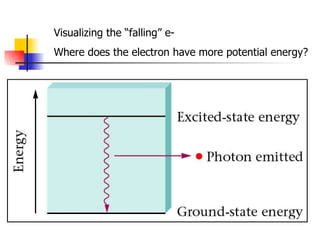
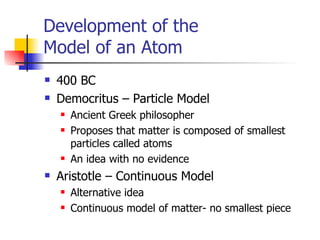
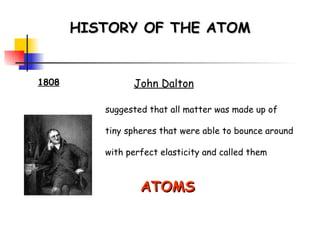
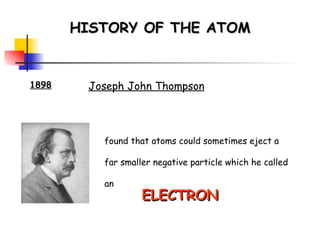
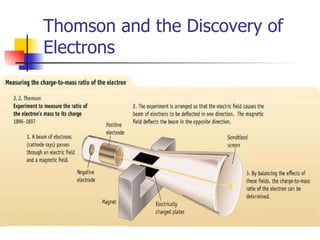
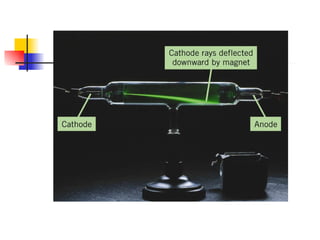
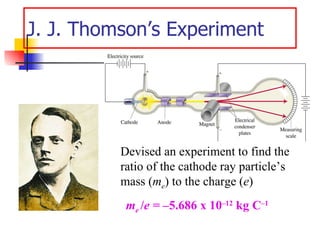
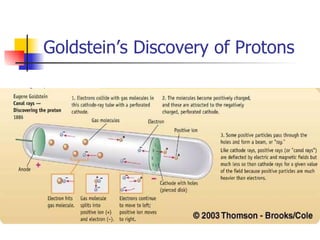
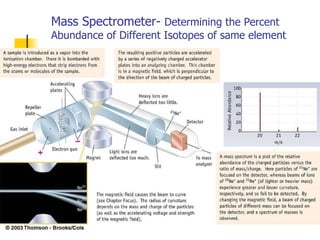
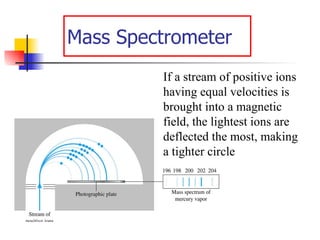
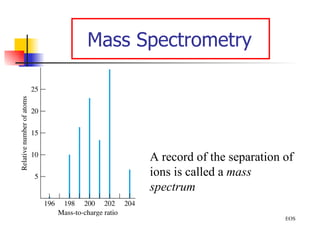
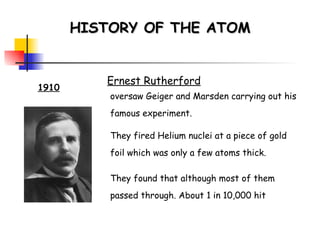
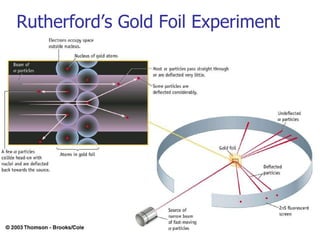
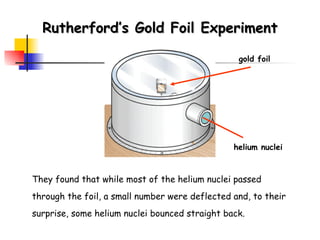
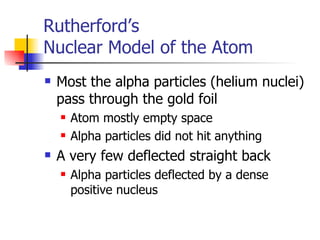
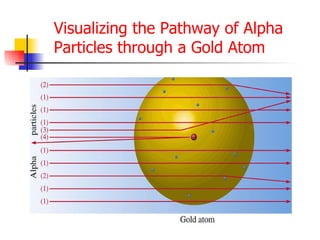
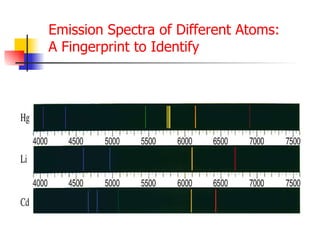
Lab 9 Atomic Structure  Emission Spectrum Electron Configuration
HISTORY OF THE ATOM 460 BC Democritus develops the idea of atoms he pounded up materials in his mortar and pestle until he had reduced them to smaller and smaller particles which he called ATOMS   ( greek for indivisible )
Development of the  Model of an Atom 400 BC Democritus – Particle Model Ancient Greek philosopher  Proposes that matter is composed of smallest particles called atoms An idea with no evidence Aristotle – Continuous Model Alternative idea Continuous model of matter- no smallest piece
HISTORY OF THE ATOM 1808 John Dalton suggested that all matter was made up of tiny spheres that were able to bounce around with perfect elasticity and called them ATOMS
Dalton proposes  Atomic Theory in 1803 Based upon experimental evidence All matter composed of atoms Atoms of same element have same mass and properties Atoms are neither created nor destroyed, they are rather simply rearranged in chemical reactions  Evidence – Lavoiser- Conservation of Mass Compounds are composed of elements in simple whole number ratios  Evidence – Proust
HISTORY OF THE ATOM 1898 Joseph John Thompson found that atoms could sometimes eject a far smaller negative particle which he called an ELECTRON
Thomson and the Discovery of Electrons
 
J. J. Thomson’s Experiment Devised an experiment to find the ratio of the cathode ray particle’s mass ( m e ) to the charge ( e ) m e  / e =  –5.686 x 10 –12  kg C –1
Thomson’s Plum Pudding Model Based upon the charge to mass ratio, the electron must be much smaller than the atom Proposed negative electrons embedded in positive matrix of atom
HISTORY OF THE ATOM Thomson develops the idea that an atom was made up of electrons scattered unevenly within an elastic sphere surrounded by a soup of positive charge to balance the electron's charge 1904 PLUM PUDDING MODEL
Millikan’s Oil Drop Experiment Measuring the Charge on an electron
Unstable Atoms and Radioactivity Atoms are not indestructible Atoms are composed of smaller particles Alpha particles – positively charged Beta particles – negatively charged Gamma rays – no charge
Radioactivity
Goldstein’s Discovery of Protons
Mass Spectrometer-  Determining the Percent Abundance of Different Isotopes of same element
Mass Spectrometer If a stream of positive ions having equal velocities is brought into a magnetic field, the lightest ions are deflected the most, making a tighter circle
Mass Spectrometry EOS A record of the separation of ions is called a  mass spectrum
Isotopes of Neon Neon-20 10 protons 10 neutrons Neon-21 10 protons 11 neutrons Neon-22 10 protons 12 neutrons
 
HISTORY OF THE ATOM 1910 Ernest Rutherford oversaw Geiger and Marsden carrying out his famous experiment.  They fired Helium nuclei at a piece of gold foil which was only a few atoms thick. They found that although most of them passed through. About 1 in 10,000 hit
Rutherford’s Gold Foil Experiment
Rutherford’s Gold Foil Experiment gold foil helium nuclei They found that while most of the helium nuclei passed through the foil, a small number were deflected and, to their surprise, some helium nuclei bounced straight back.
Rutherford’s  Nuclear Model of the Atom Most the alpha particles (helium nuclei) pass through the gold foil Atom mostly empty space Alpha particles did not hit anything A very few deflected straight back Alpha particles deflected by a dense positive nucleus
Visualizing the Pathway of Alpha Particles through a Gold Atom
ELECTROMAGNETIC RADIATION
Electromagnetic radiation.
Electromagnetic Radiation Most subatomic particles behave as PARTICLES and obey the physics of waves.
Electromagnetic Radiation
The Electromagnetic Spectrum
Wave Model of Light Wavelength   measured in meters (m) Frequency  ƒ measured in waves per second (Hz) Energy  E measured in Joules (J)
Wavelength, Frequency and Energy Wavelength inversely related to frequency Increasing wavelength     decreasing frequency Decreasing wavelength     increasing frequency Wavelength x frequency = speed of light c  =      ƒ   c = speed of light = 3.00 x 10 8   m/s Frequency directly related to energy Increasing frequency     increasing energy Energy = Planck’s constant x frequency  E  =   h  ƒ  h = Planck’s constant = 6.63 x 10 -34  J/Hz
Electromagnetic Radiation wavelength Visible light wavelength Ultaviolet radiation Amplitude Node
Electro magnetic   Spectrum In increasing energy, R O Y   G   B I V
 
Sunlight viewed through a spectroscope
Prisms and diffraction grating  bend light  Red light with longer wavelengths bend less Violet light with shorter wavelengths bend more Separates white light into ROYGBIV Red – Orange – Yellow – Green – Blue – Indigo – Violet long waves short waves low frequency high frequency low energy high energy
Photoelectric Effect
Photoelectric Effect Bright red light shined on the photocell has no effect- regardless of intensity or time Dim green light shined on the photocell causes electrons to be emitted and flow through the wire Brighter green light emits more electrons per second- greater current
Explaining the Photoelectric Effect ONLY the photon or particle model can be used to explain these results Energy is required to pull off negative electrons attracted to positive protons in nucleus- breaking attraction Each red photon does not have enough energy to pull off an electron – regardless of how long the light is shined Each green photon has more energy and can pull off the electron when the green photon collides
Light Spectrum Lab! Slit that allows light inside Line up the slit so that it is parallel with the spectrum tube (light bulb)
The Emission Spectrum of Hydrogen-  Discrete Bands of Colored Light
Excited Gases  & Atomic Structure
Emission Spectra of Different Atoms: A Fingerprint to Identify
Rydberg and Balmer (1886) Independently develop mathematical equations that fit the data for hydrogen emission spectrum The electron had no yet been discovered Neither had a model to explain the observed wavelengths Just an equation that worked
Rydberg Equation 1/ λ   = R H   [1/n 1 2   -  1/n 2 2 ] R H  = 1.09678 x 10 -2  nm -1 Solve the equation for an electron  moving from level 4 to 2.
Bohr’s Model of the Atom (1910) Assumed electrons orbit the nucleus in circular orbits Proposed the energy of the orbit is proportional to the distance from the nucleus  (increasing distance – increasing energy) Assumed only certain allowable energies Used angular momentum to calculate the allowable energy
Bohr’s Model of the Atom (1910) When the atom absorbs energy Electron moves up to higher energy with more potential energy farther away from nucleus Unstable with higher PE Electron falls back down to lower levels Energy released PE converted to KE as electron fall The color of light observed reflects the energy released in the fall
Bohr’s Calculations  of the Energy Δ E = -2.18 x 10 -18  J (1/n f 2  – 1/n i 2 ) n = the energy level Δ E = positive when electron climbs up levels absorbing energy increasing PE Δ E = negative when e- falls down levels releasing energy decreasing PE
Niels Bohr (1885-1962) Δ E = -2.18 x 10 -18  J (1/n f 2  – 1/n i 2 ) Calculate the energy as an electron drops from level 6 down to level 2. Calculate the frequency and wavelength of this photon.
ultraviolet infrared
Visualizing the Movement of the Electron
 
Line Spectra of Other Elements Oops.  Bohr’s equation does NOT predict these wavelengths.
 
Visualizing the “falling” e- Where does the electron have more potential energy?
Electron is a wave - De Broglie  De Broglie Since light is both particle and wave, perhaps so is matter both particle and wave Wavelength depends upon mass and velocity Objects with large mass have  negligible, so small we can ignore Electrons with very small mass have wave properties that cannot be ignored λ  = h/p
Quantum Mechanics Heisenberg Uncertainty principle Given the wavelike nature of electron Impossible to know both location and energy of electron Can only calculate the probable location Schrodinger Used calculus to “locate” the electron within orbital Orbitals – regions of space representing the most probable location of electron
E. Schrodinger 1887-1961 W. Heisenberg 1901-1976 Wave Functions:  Calculating the Probability of locating an electron in a region of space The Uncertainty Principle:   Cannot both determine location and energy of electron
The Wave Function and Orbitals
The region near the nucleus is separated from the outer region by a spherical  node  - a spherical shell in which the electron probability is zero EOS
 
Quantum Numbers Values that emerge from the wave functions of Schrodinger 1 st  n = energy level 2 nd  ℓ  = shape of orbital (s, p, d or f) 3 rd  m ℓ  = orientation (diff versions) 4 th  m s   = magnetic spin of electron
Increasing Radius of s-orbital with higher values of n
s orbital p orbital d orbital
 
 
f Orbitals


The s-orbital Spherical shaped orbital ℓ  = 0 m ℓ  = 0 Only one s-orbital in any energy level
The p-orbital Double-lobe shaped orbital ℓ  = 1 mℓ = -1 or 0 or +1 Only three p-orbitals in any energy level- except for level one
Planes of zero probability
Model of d-orbital
Only electrons with opposite spins can be in the same orbital
Electron Configurations Show the electrons in orbitals Box used to represent orbital Half arrow used to represent e- with opposite spins Electrons are placed in orbitals of lowest energy first
Use sum of first two quantum numbers to determine which orbital fills first


Nickel  Electron Configuration and quantum numbers 1s   2s  2p   3s  3p 1 0 0  ½  2 0 0 ½  2 1 -1 ½  2 1 0 ½  3 0 0 ½   3 1 0 ½   2 1 0 ½   3 1 -1 ½  3 1 0 ½ 4s   3d 4 01 0 ½   3 2 -2 ½  3 2 -1 ½  3 2 0 ½  3 2 1 ½  3 2 1 ½  1 st  # indicates energy level n = 1 1 st  level n = 2  2 nd  level 2 nd  # type of orbital l = 0  is s-orbital l = 1 is p-orbital l = 2 is d-orbital

Lab 8 atomic structure

  • 1.
    Lab 9 AtomicStructure Emission Spectrum Electron Configuration
  • 2.
    HISTORY OF THEATOM 460 BC Democritus develops the idea of atoms he pounded up materials in his mortar and pestle until he had reduced them to smaller and smaller particles which he called ATOMS ( greek for indivisible )
  • 3.
    Development of the Model of an Atom 400 BC Democritus – Particle Model Ancient Greek philosopher Proposes that matter is composed of smallest particles called atoms An idea with no evidence Aristotle – Continuous Model Alternative idea Continuous model of matter- no smallest piece
  • 4.
    HISTORY OF THEATOM 1808 John Dalton suggested that all matter was made up of tiny spheres that were able to bounce around with perfect elasticity and called them ATOMS
  • 5.
    Dalton proposes Atomic Theory in 1803 Based upon experimental evidence All matter composed of atoms Atoms of same element have same mass and properties Atoms are neither created nor destroyed, they are rather simply rearranged in chemical reactions Evidence – Lavoiser- Conservation of Mass Compounds are composed of elements in simple whole number ratios Evidence – Proust
  • 6.
    HISTORY OF THEATOM 1898 Joseph John Thompson found that atoms could sometimes eject a far smaller negative particle which he called an ELECTRON
  • 7.
    Thomson and theDiscovery of Electrons
  • 8.
  • 9.
    J. J. Thomson’sExperiment Devised an experiment to find the ratio of the cathode ray particle’s mass ( m e ) to the charge ( e ) m e / e = –5.686 x 10 –12 kg C –1
  • 10.
    Thomson’s Plum PuddingModel Based upon the charge to mass ratio, the electron must be much smaller than the atom Proposed negative electrons embedded in positive matrix of atom
  • 11.
    HISTORY OF THEATOM Thomson develops the idea that an atom was made up of electrons scattered unevenly within an elastic sphere surrounded by a soup of positive charge to balance the electron's charge 1904 PLUM PUDDING MODEL
  • 12.
    Millikan’s Oil DropExperiment Measuring the Charge on an electron
  • 13.
    Unstable Atoms andRadioactivity Atoms are not indestructible Atoms are composed of smaller particles Alpha particles – positively charged Beta particles – negatively charged Gamma rays – no charge
  • 14.
  • 15.
  • 16.
    Mass Spectrometer- Determining the Percent Abundance of Different Isotopes of same element
  • 17.
    Mass Spectrometer Ifa stream of positive ions having equal velocities is brought into a magnetic field, the lightest ions are deflected the most, making a tighter circle
  • 18.
    Mass Spectrometry EOSA record of the separation of ions is called a mass spectrum
  • 19.
    Isotopes of NeonNeon-20 10 protons 10 neutrons Neon-21 10 protons 11 neutrons Neon-22 10 protons 12 neutrons
  • 20.
  • 21.
    HISTORY OF THEATOM 1910 Ernest Rutherford oversaw Geiger and Marsden carrying out his famous experiment. They fired Helium nuclei at a piece of gold foil which was only a few atoms thick. They found that although most of them passed through. About 1 in 10,000 hit
  • 22.
  • 23.
    Rutherford’s Gold FoilExperiment gold foil helium nuclei They found that while most of the helium nuclei passed through the foil, a small number were deflected and, to their surprise, some helium nuclei bounced straight back.
  • 24.
    Rutherford’s NuclearModel of the Atom Most the alpha particles (helium nuclei) pass through the gold foil Atom mostly empty space Alpha particles did not hit anything A very few deflected straight back Alpha particles deflected by a dense positive nucleus
  • 25.
    Visualizing the Pathwayof Alpha Particles through a Gold Atom
  • 26.
  • 27.
  • 28.
    Electromagnetic Radiation Mostsubatomic particles behave as PARTICLES and obey the physics of waves.
  • 29.
  • 30.
  • 31.
    Wave Model ofLight Wavelength  measured in meters (m) Frequency ƒ measured in waves per second (Hz) Energy E measured in Joules (J)
  • 32.
    Wavelength, Frequency andEnergy Wavelength inversely related to frequency Increasing wavelength  decreasing frequency Decreasing wavelength  increasing frequency Wavelength x frequency = speed of light c =  ƒ c = speed of light = 3.00 x 10 8 m/s Frequency directly related to energy Increasing frequency  increasing energy Energy = Planck’s constant x frequency E = h ƒ h = Planck’s constant = 6.63 x 10 -34 J/Hz
  • 33.
    Electromagnetic Radiation wavelengthVisible light wavelength Ultaviolet radiation Amplitude Node
  • 34.
    Electro magnetic Spectrum In increasing energy, R O Y G B I V
  • 35.
  • 36.
  • 37.
    Prisms and diffractiongrating bend light Red light with longer wavelengths bend less Violet light with shorter wavelengths bend more Separates white light into ROYGBIV Red – Orange – Yellow – Green – Blue – Indigo – Violet long waves short waves low frequency high frequency low energy high energy
  • 38.
  • 39.
    Photoelectric Effect Brightred light shined on the photocell has no effect- regardless of intensity or time Dim green light shined on the photocell causes electrons to be emitted and flow through the wire Brighter green light emits more electrons per second- greater current
  • 40.
    Explaining the PhotoelectricEffect ONLY the photon or particle model can be used to explain these results Energy is required to pull off negative electrons attracted to positive protons in nucleus- breaking attraction Each red photon does not have enough energy to pull off an electron – regardless of how long the light is shined Each green photon has more energy and can pull off the electron when the green photon collides
  • 41.
    Light Spectrum Lab!Slit that allows light inside Line up the slit so that it is parallel with the spectrum tube (light bulb)
  • 42.
    The Emission Spectrumof Hydrogen- Discrete Bands of Colored Light
  • 43.
    Excited Gases & Atomic Structure
  • 44.
    Emission Spectra ofDifferent Atoms: A Fingerprint to Identify
  • 45.
    Rydberg and Balmer(1886) Independently develop mathematical equations that fit the data for hydrogen emission spectrum The electron had no yet been discovered Neither had a model to explain the observed wavelengths Just an equation that worked
  • 46.
    Rydberg Equation 1/λ = R H [1/n 1 2 - 1/n 2 2 ] R H = 1.09678 x 10 -2 nm -1 Solve the equation for an electron moving from level 4 to 2.
  • 47.
    Bohr’s Model ofthe Atom (1910) Assumed electrons orbit the nucleus in circular orbits Proposed the energy of the orbit is proportional to the distance from the nucleus (increasing distance – increasing energy) Assumed only certain allowable energies Used angular momentum to calculate the allowable energy
  • 48.
    Bohr’s Model ofthe Atom (1910) When the atom absorbs energy Electron moves up to higher energy with more potential energy farther away from nucleus Unstable with higher PE Electron falls back down to lower levels Energy released PE converted to KE as electron fall The color of light observed reflects the energy released in the fall
  • 49.
    Bohr’s Calculations of the Energy Δ E = -2.18 x 10 -18 J (1/n f 2 – 1/n i 2 ) n = the energy level Δ E = positive when electron climbs up levels absorbing energy increasing PE Δ E = negative when e- falls down levels releasing energy decreasing PE
  • 50.
    Niels Bohr (1885-1962)Δ E = -2.18 x 10 -18 J (1/n f 2 – 1/n i 2 ) Calculate the energy as an electron drops from level 6 down to level 2. Calculate the frequency and wavelength of this photon.
  • 51.
  • 52.
    Visualizing the Movementof the Electron
  • 53.
  • 54.
    Line Spectra ofOther Elements Oops. Bohr’s equation does NOT predict these wavelengths.
  • 55.
  • 56.
    Visualizing the “falling”e- Where does the electron have more potential energy?
  • 57.
    Electron is awave - De Broglie De Broglie Since light is both particle and wave, perhaps so is matter both particle and wave Wavelength depends upon mass and velocity Objects with large mass have negligible, so small we can ignore Electrons with very small mass have wave properties that cannot be ignored λ = h/p
  • 58.
    Quantum Mechanics HeisenbergUncertainty principle Given the wavelike nature of electron Impossible to know both location and energy of electron Can only calculate the probable location Schrodinger Used calculus to “locate” the electron within orbital Orbitals – regions of space representing the most probable location of electron
  • 59.
    E. Schrodinger 1887-1961W. Heisenberg 1901-1976 Wave Functions: Calculating the Probability of locating an electron in a region of space The Uncertainty Principle: Cannot both determine location and energy of electron
  • 60.
    The Wave Functionand Orbitals
  • 61.
    The region nearthe nucleus is separated from the outer region by a spherical node - a spherical shell in which the electron probability is zero EOS
  • 62.
  • 63.
    Quantum Numbers Valuesthat emerge from the wave functions of Schrodinger 1 st n = energy level 2 nd ℓ = shape of orbital (s, p, d or f) 3 rd m ℓ = orientation (diff versions) 4 th m s = magnetic spin of electron
  • 64.
    Increasing Radius ofs-orbital with higher values of n
  • 65.
    s orbital porbital d orbital
  • 66.
  • 67.
  • 68.
  • 69.
  • 70.
  • 71.
  • 72.
    The s-orbital Sphericalshaped orbital ℓ = 0 m ℓ = 0 Only one s-orbital in any energy level
  • 73.
    The p-orbital Double-lobeshaped orbital ℓ = 1 mℓ = -1 or 0 or +1 Only three p-orbitals in any energy level- except for level one
  • 74.
    Planes of zeroprobability
  • 75.
  • 76.
    Only electrons withopposite spins can be in the same orbital
  • 77.
    Electron Configurations Showthe electrons in orbitals Box used to represent orbital Half arrow used to represent e- with opposite spins Electrons are placed in orbitals of lowest energy first
  • 78.
    Use sum offirst two quantum numbers to determine which orbital fills first
  • 79.
  • 80.
  • 81.
  • 82.
  • 83.
  • 84.
  • 85.
  • 86.
  • 87.
  • 88.
  • 89.
  • 90.
    Nickel ElectronConfiguration and quantum numbers 1s 2s 2p 3s 3p 1 0 0 ½ 2 0 0 ½ 2 1 -1 ½ 2 1 0 ½ 3 0 0 ½ 3 1 0 ½ 2 1 0 ½ 3 1 -1 ½ 3 1 0 ½ 4s 3d 4 01 0 ½ 3 2 -2 ½ 3 2 -1 ½ 3 2 0 ½ 3 2 1 ½ 3 2 1 ½ 1 st # indicates energy level n = 1 1 st level n = 2 2 nd level 2 nd # type of orbital l = 0 is s-orbital l = 1 is p-orbital l = 2 is d-orbital