Downloaded 18 times


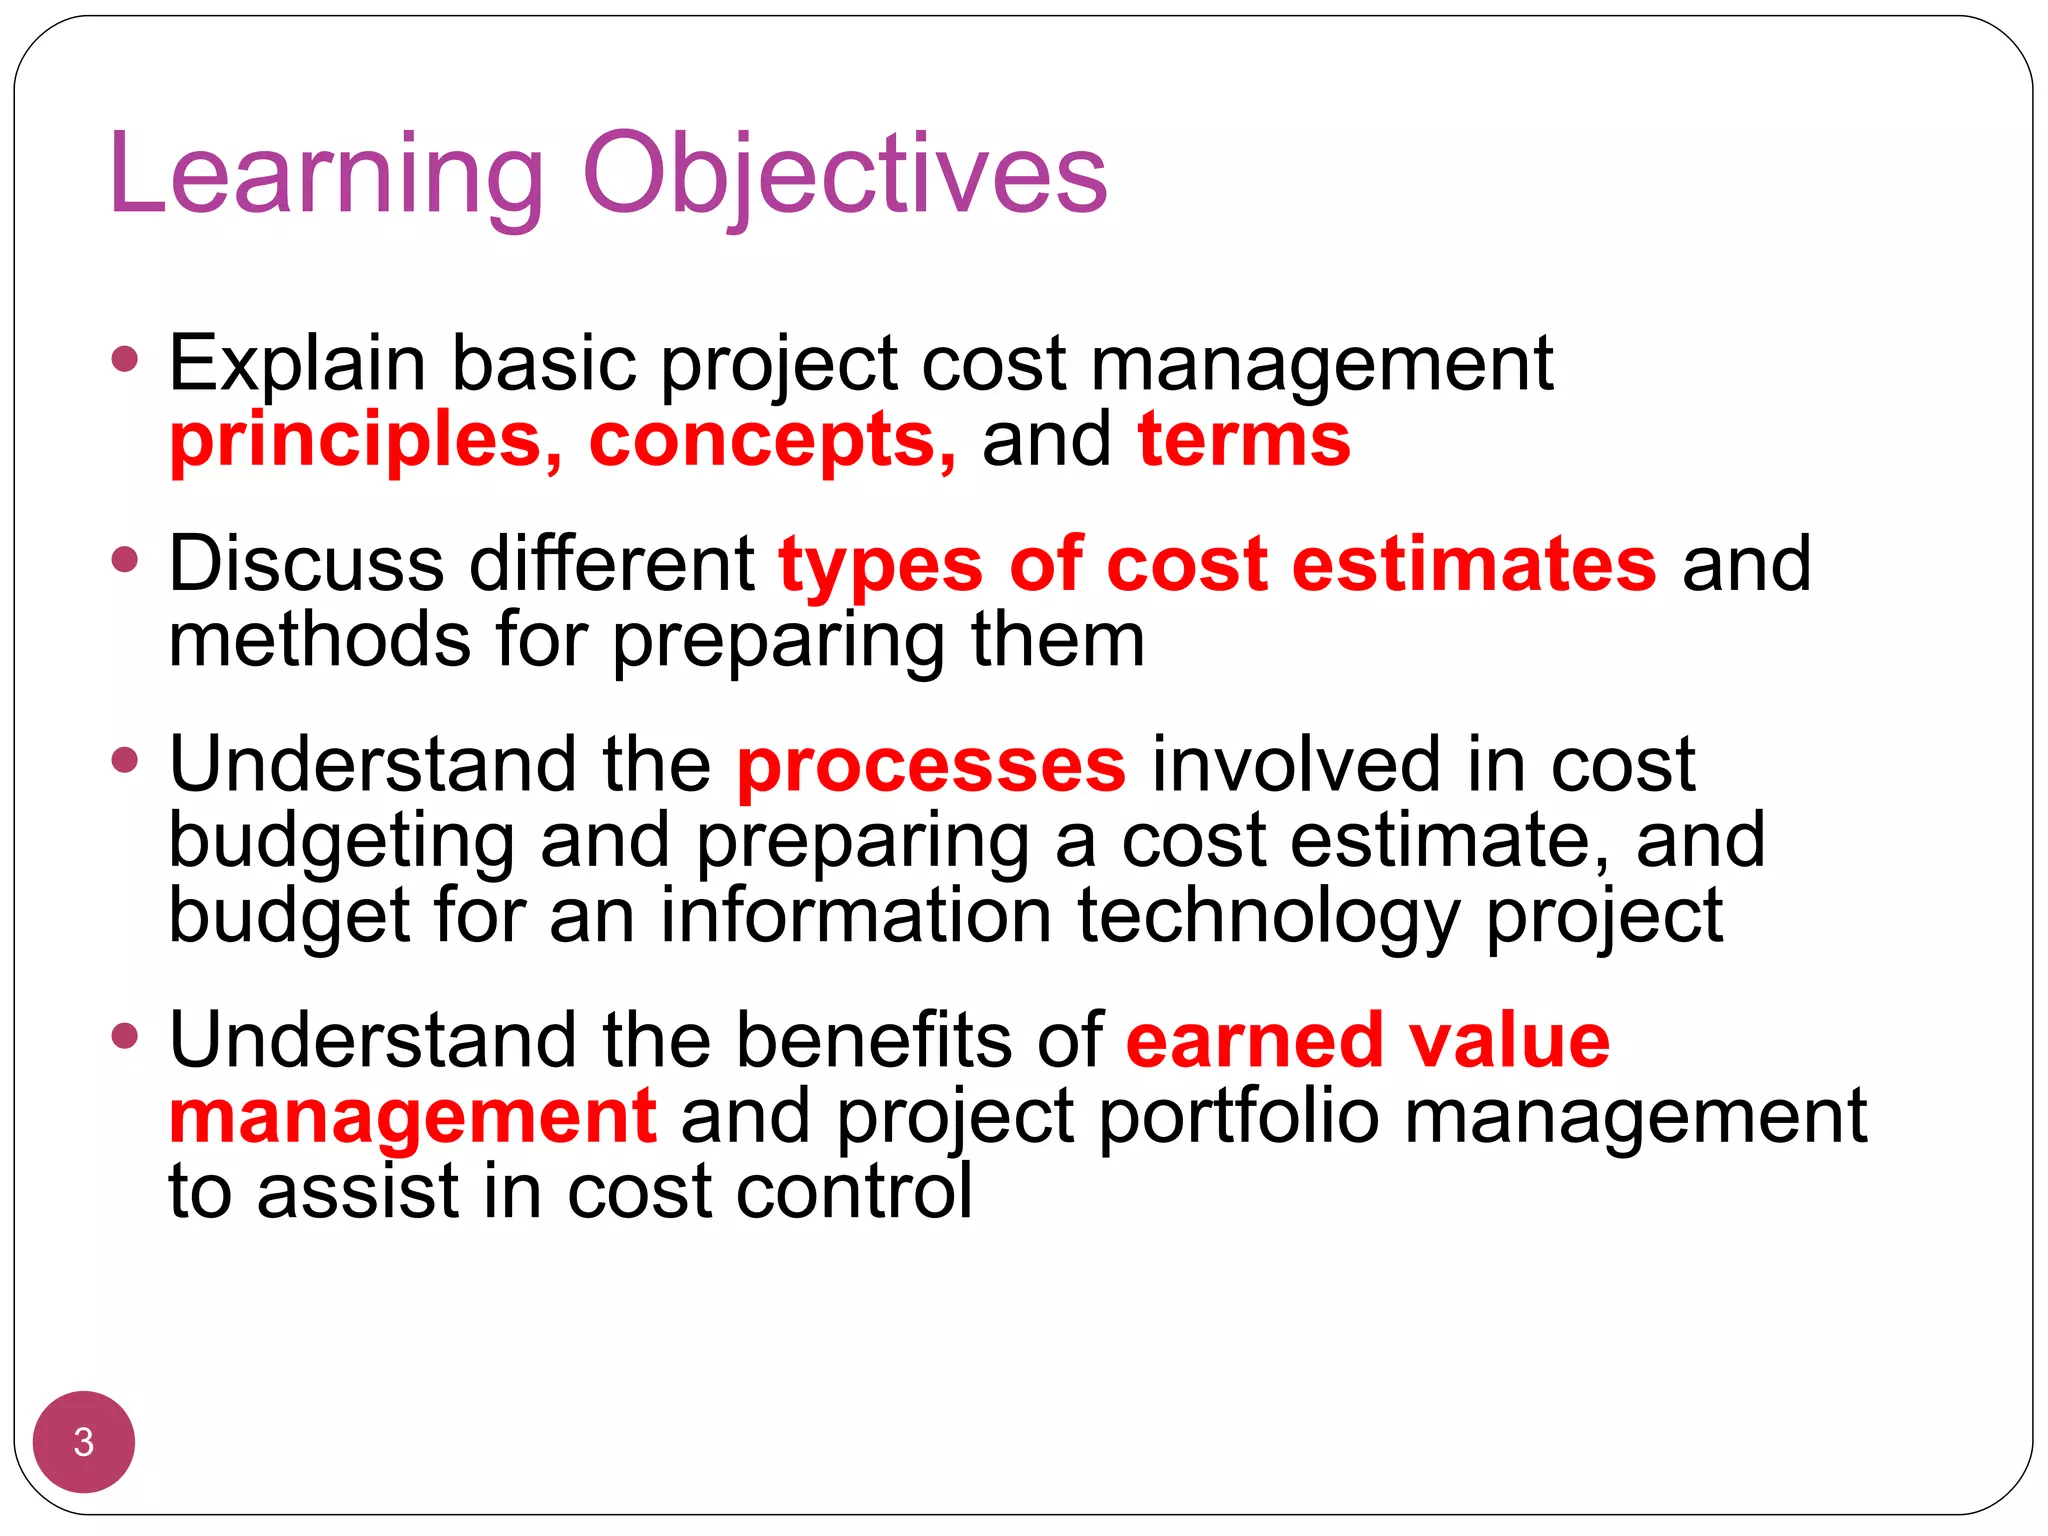


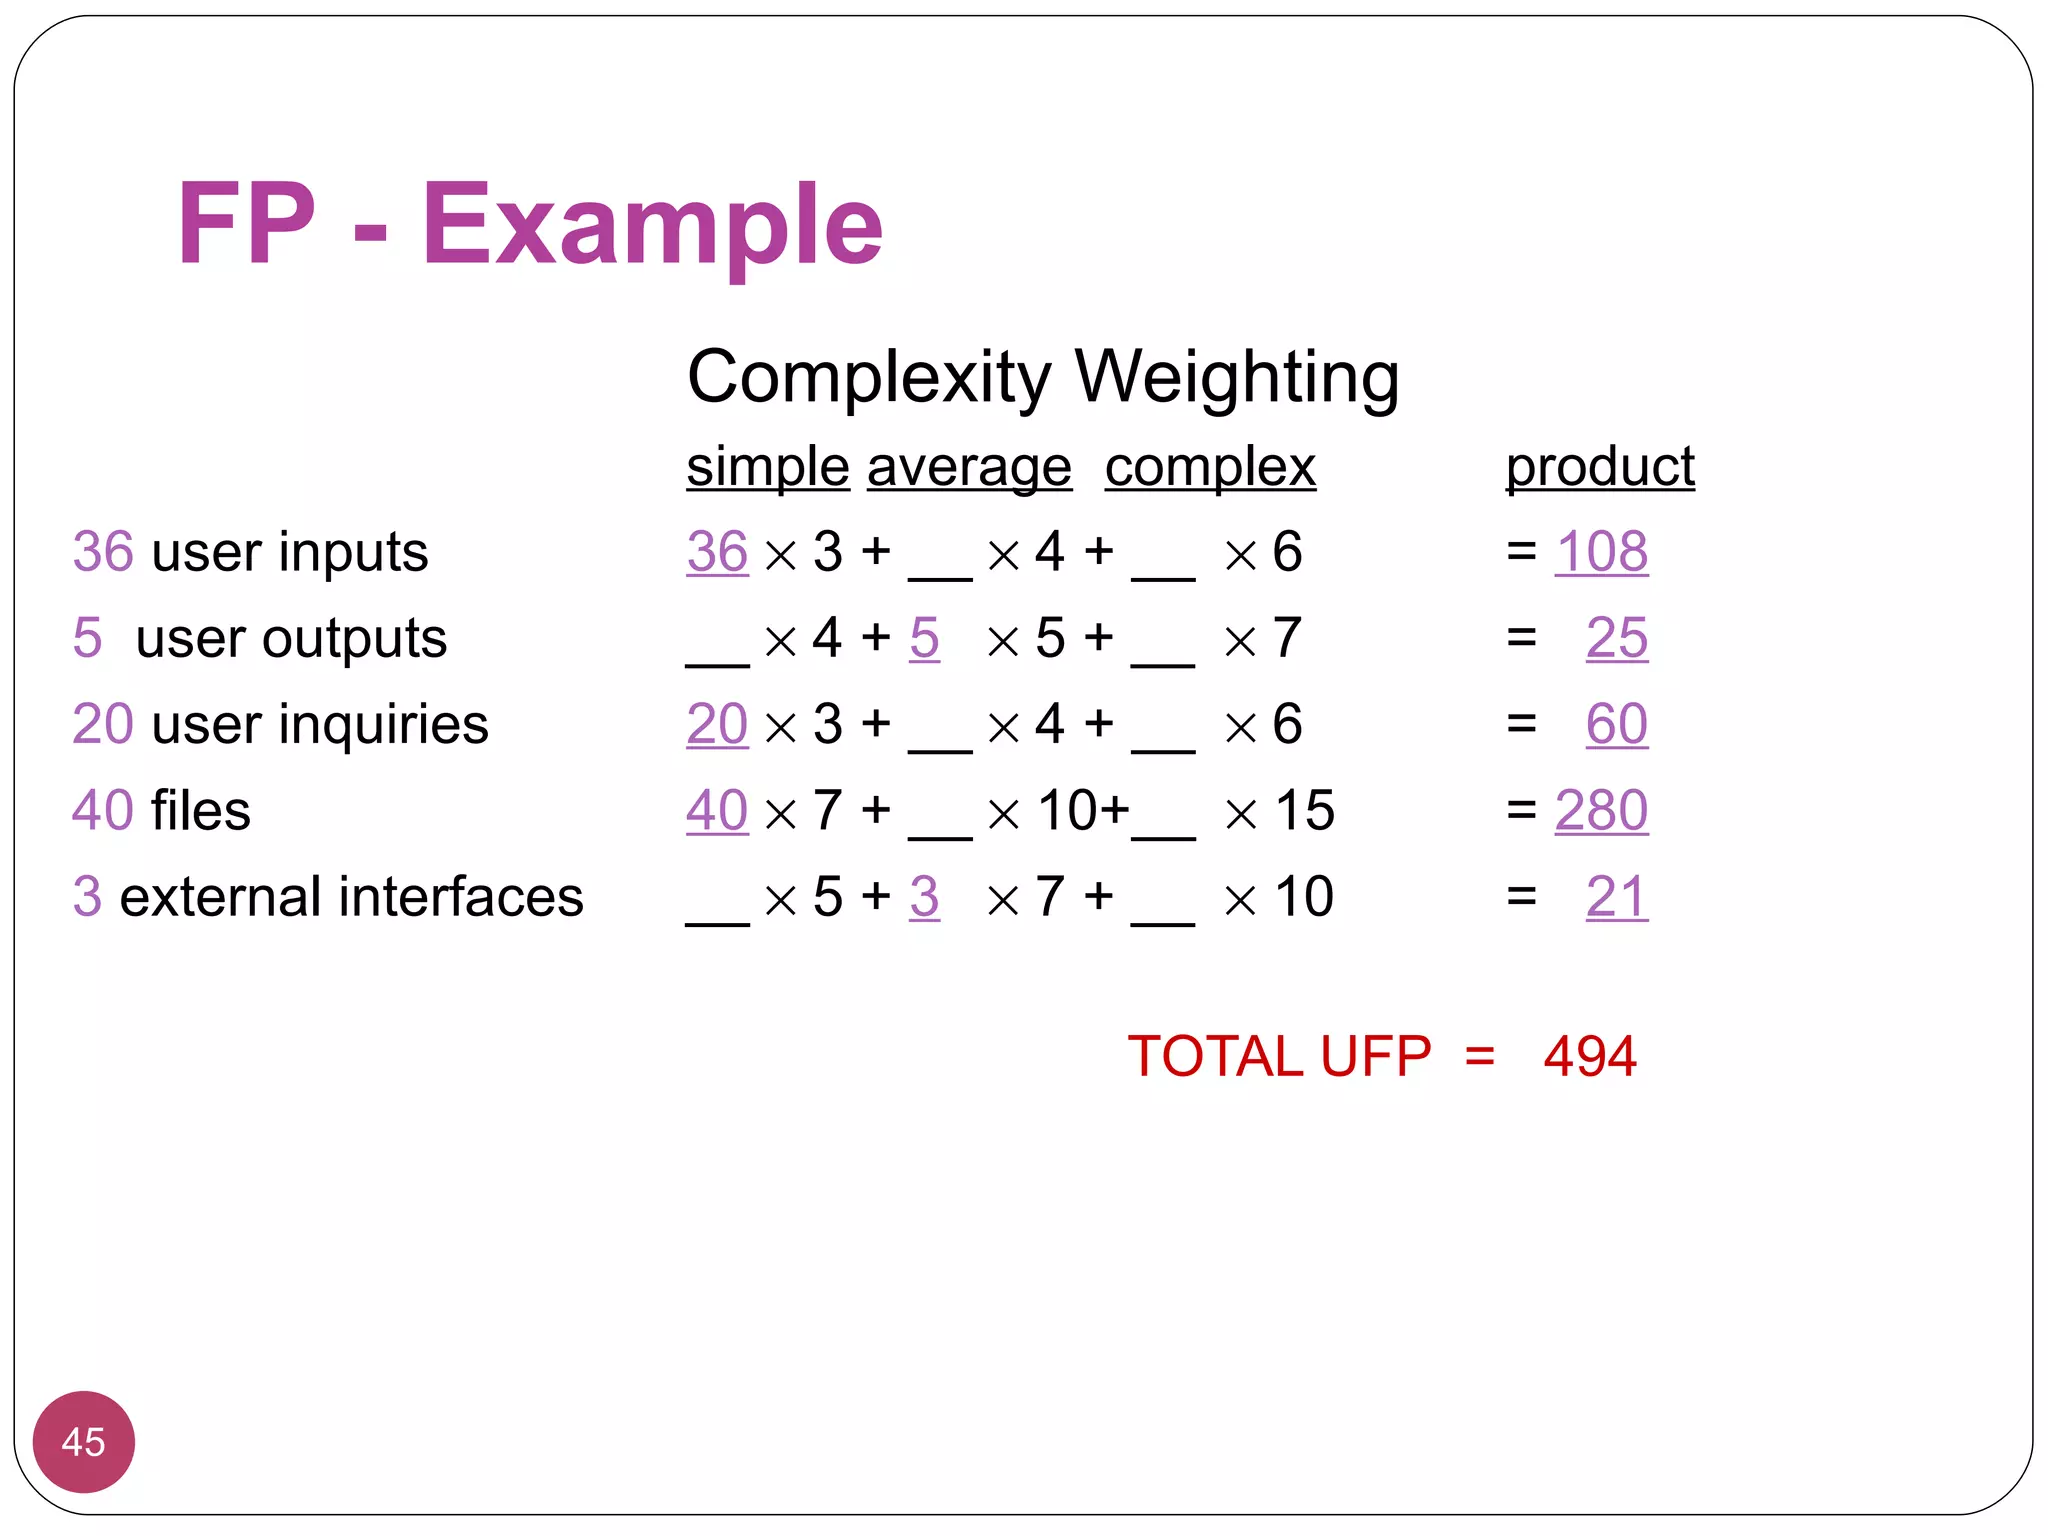
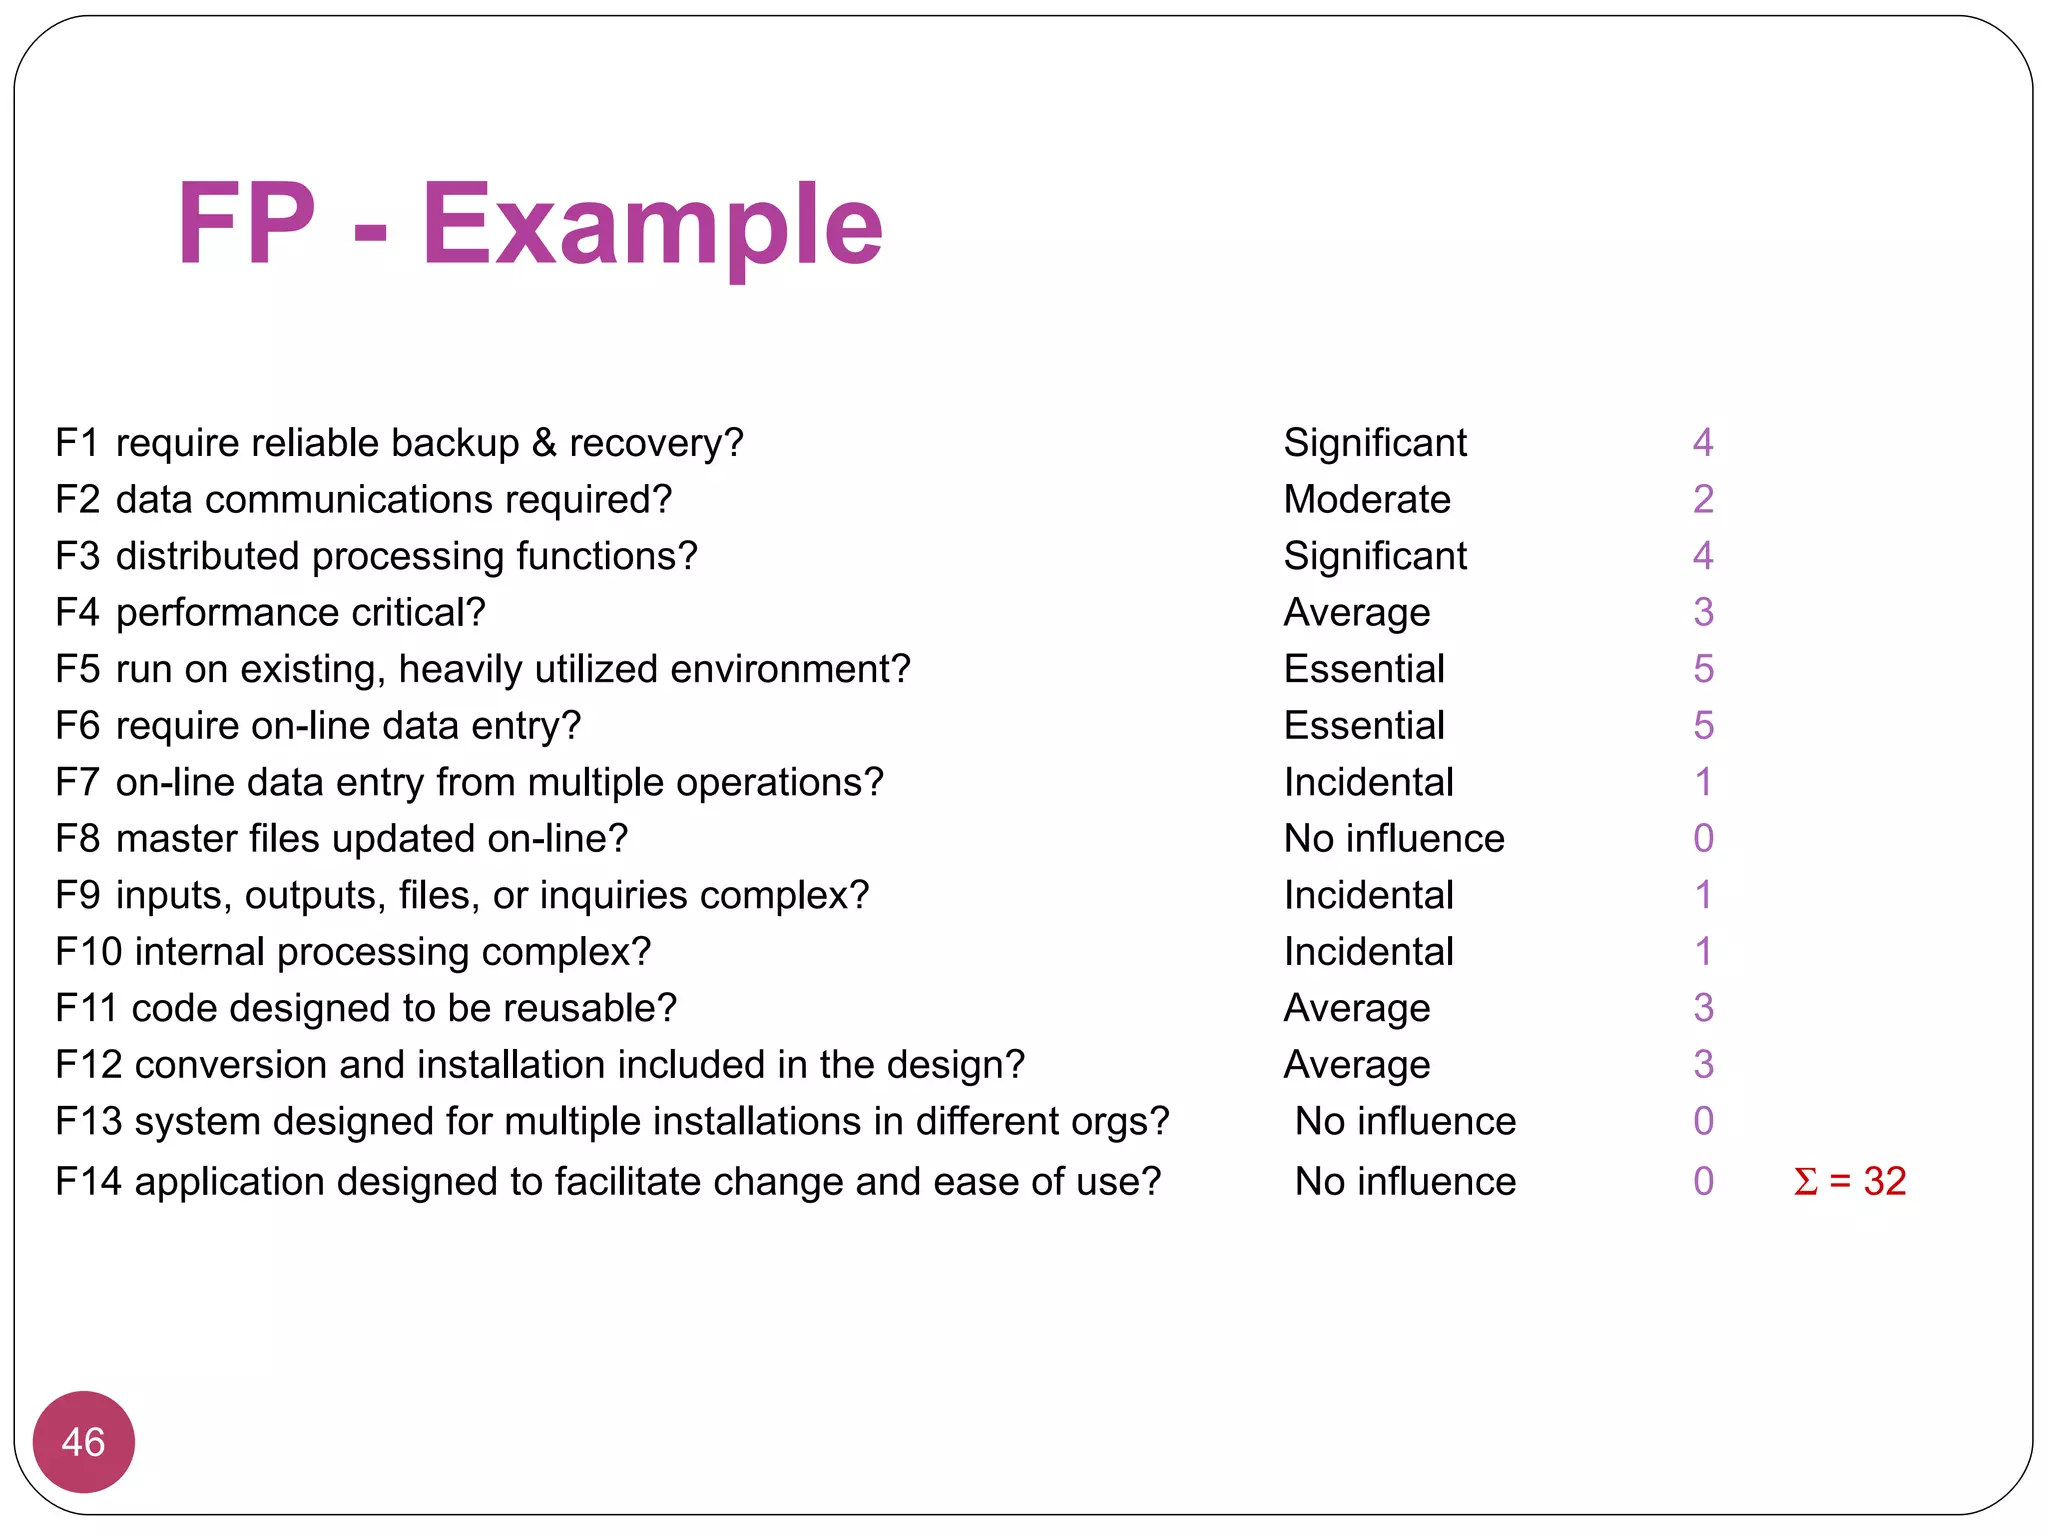
![FP - Example AFP = UFP [0.65 + 0.01 F i ] = 494 [0.65 + 0.01 32 ] = 479.18 Size of Project = AFP * LOC of a given language = 479.18 106 (COBOL) = 50,793 If it costs $10 for a professional programmer to write 1 LOC, the cost of the system is: 10 50,793 = $507,930](https://image.slidesharecdn.com/l06costmanagement-100810221646-phpapp01/75/L06-cost-management-47-2048.jpg)


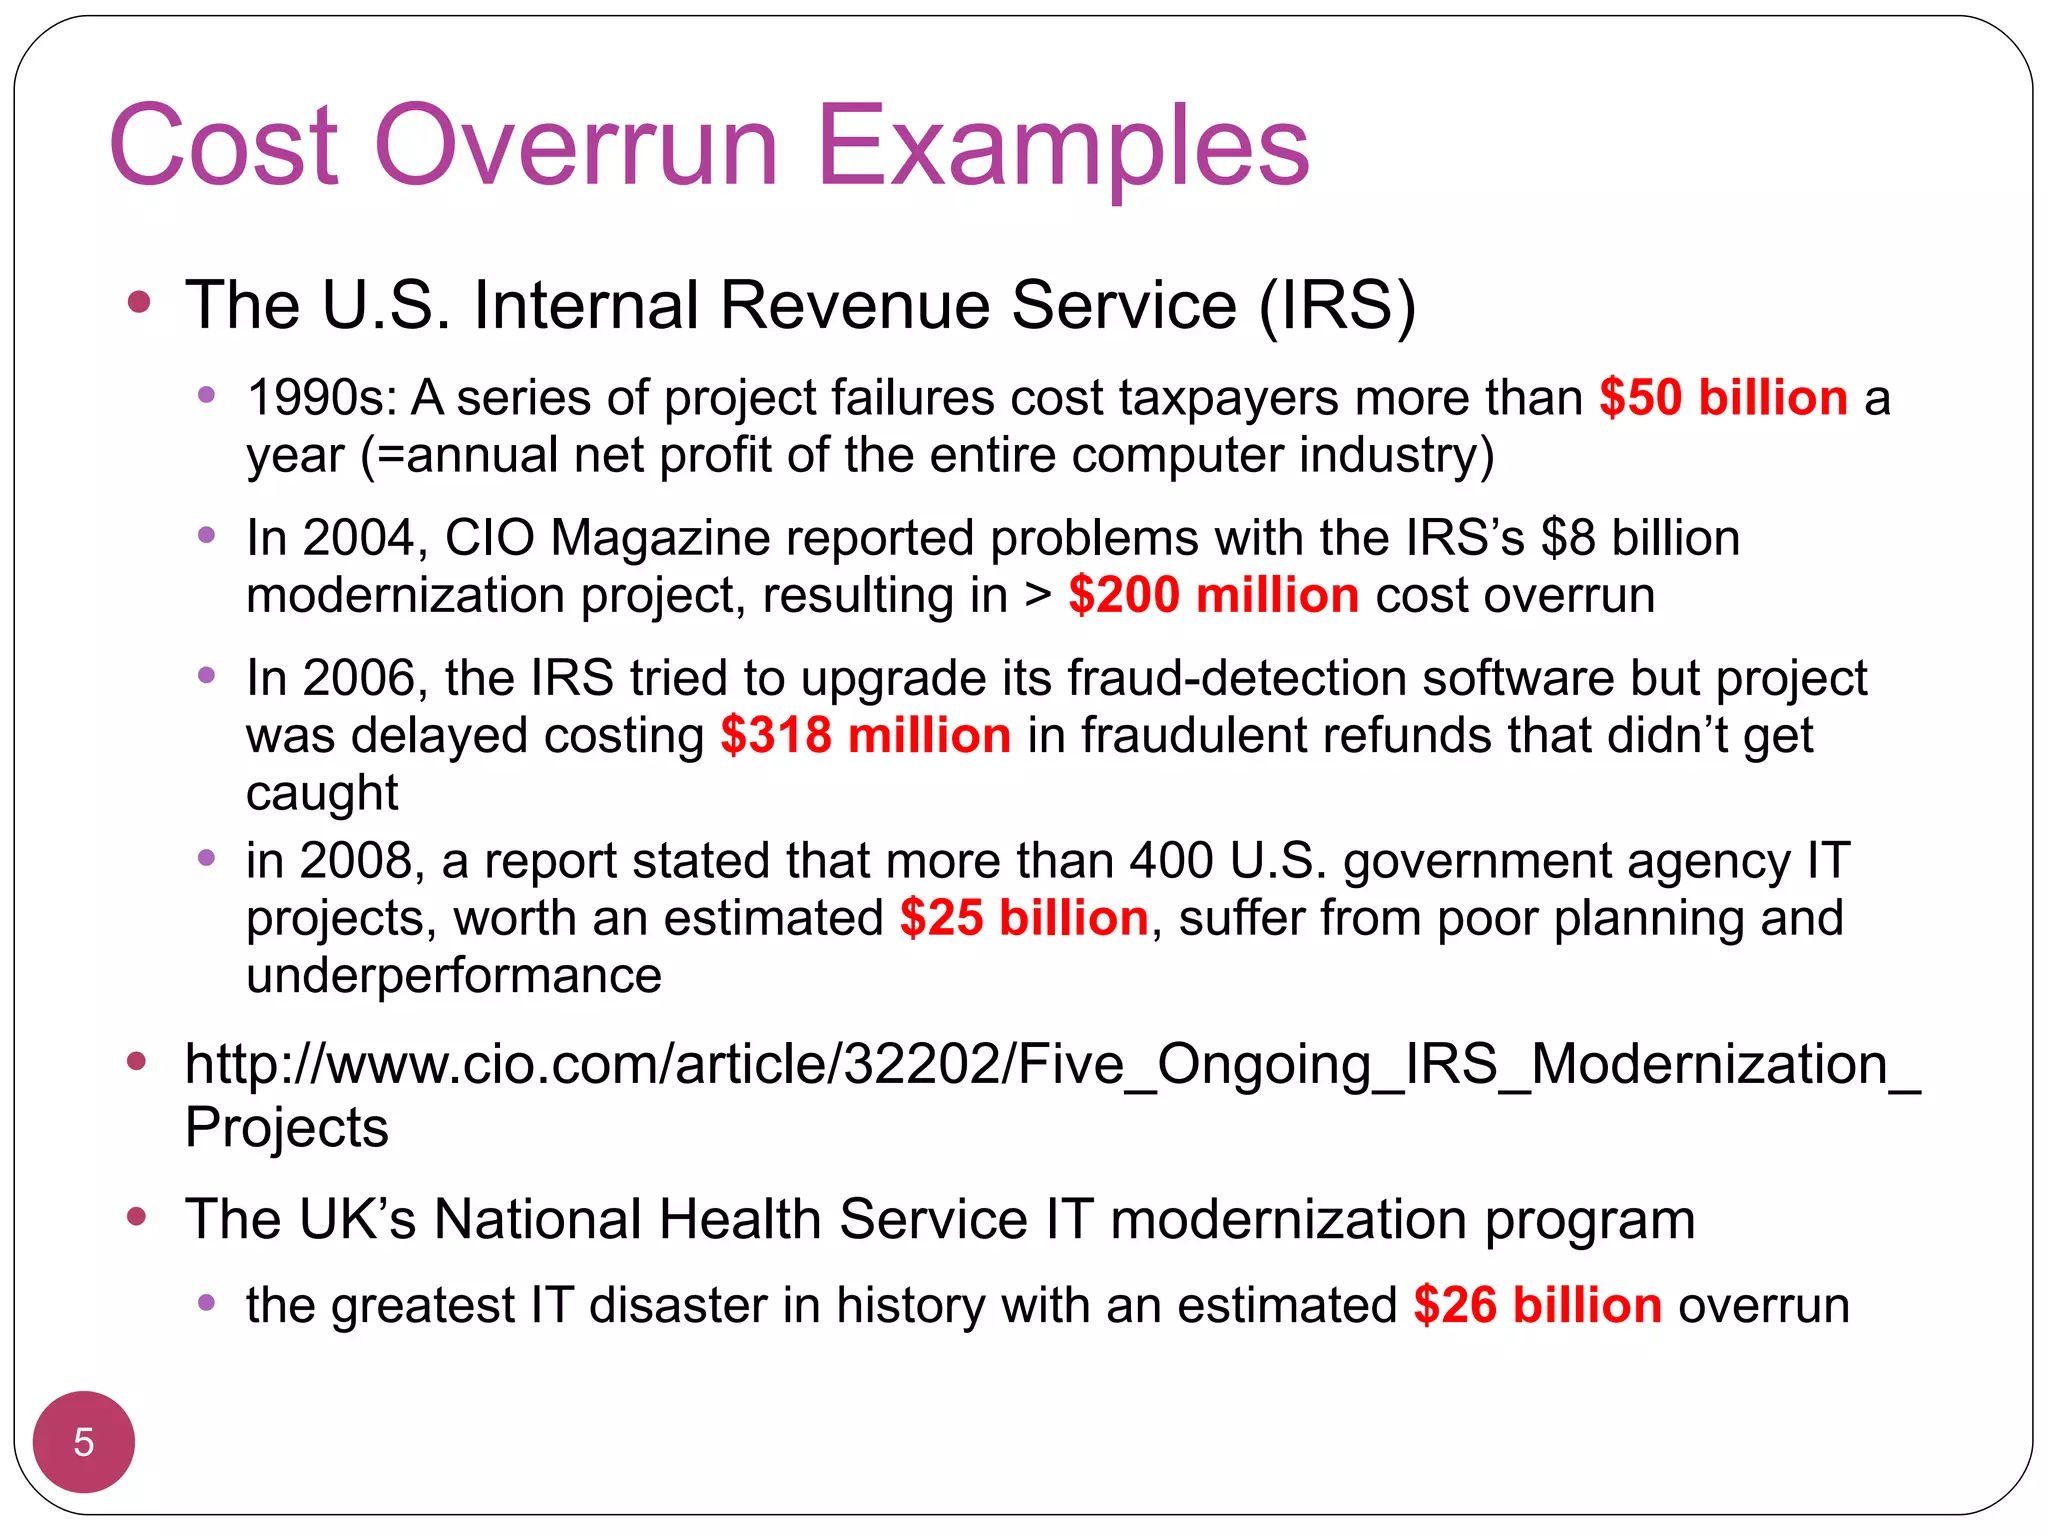
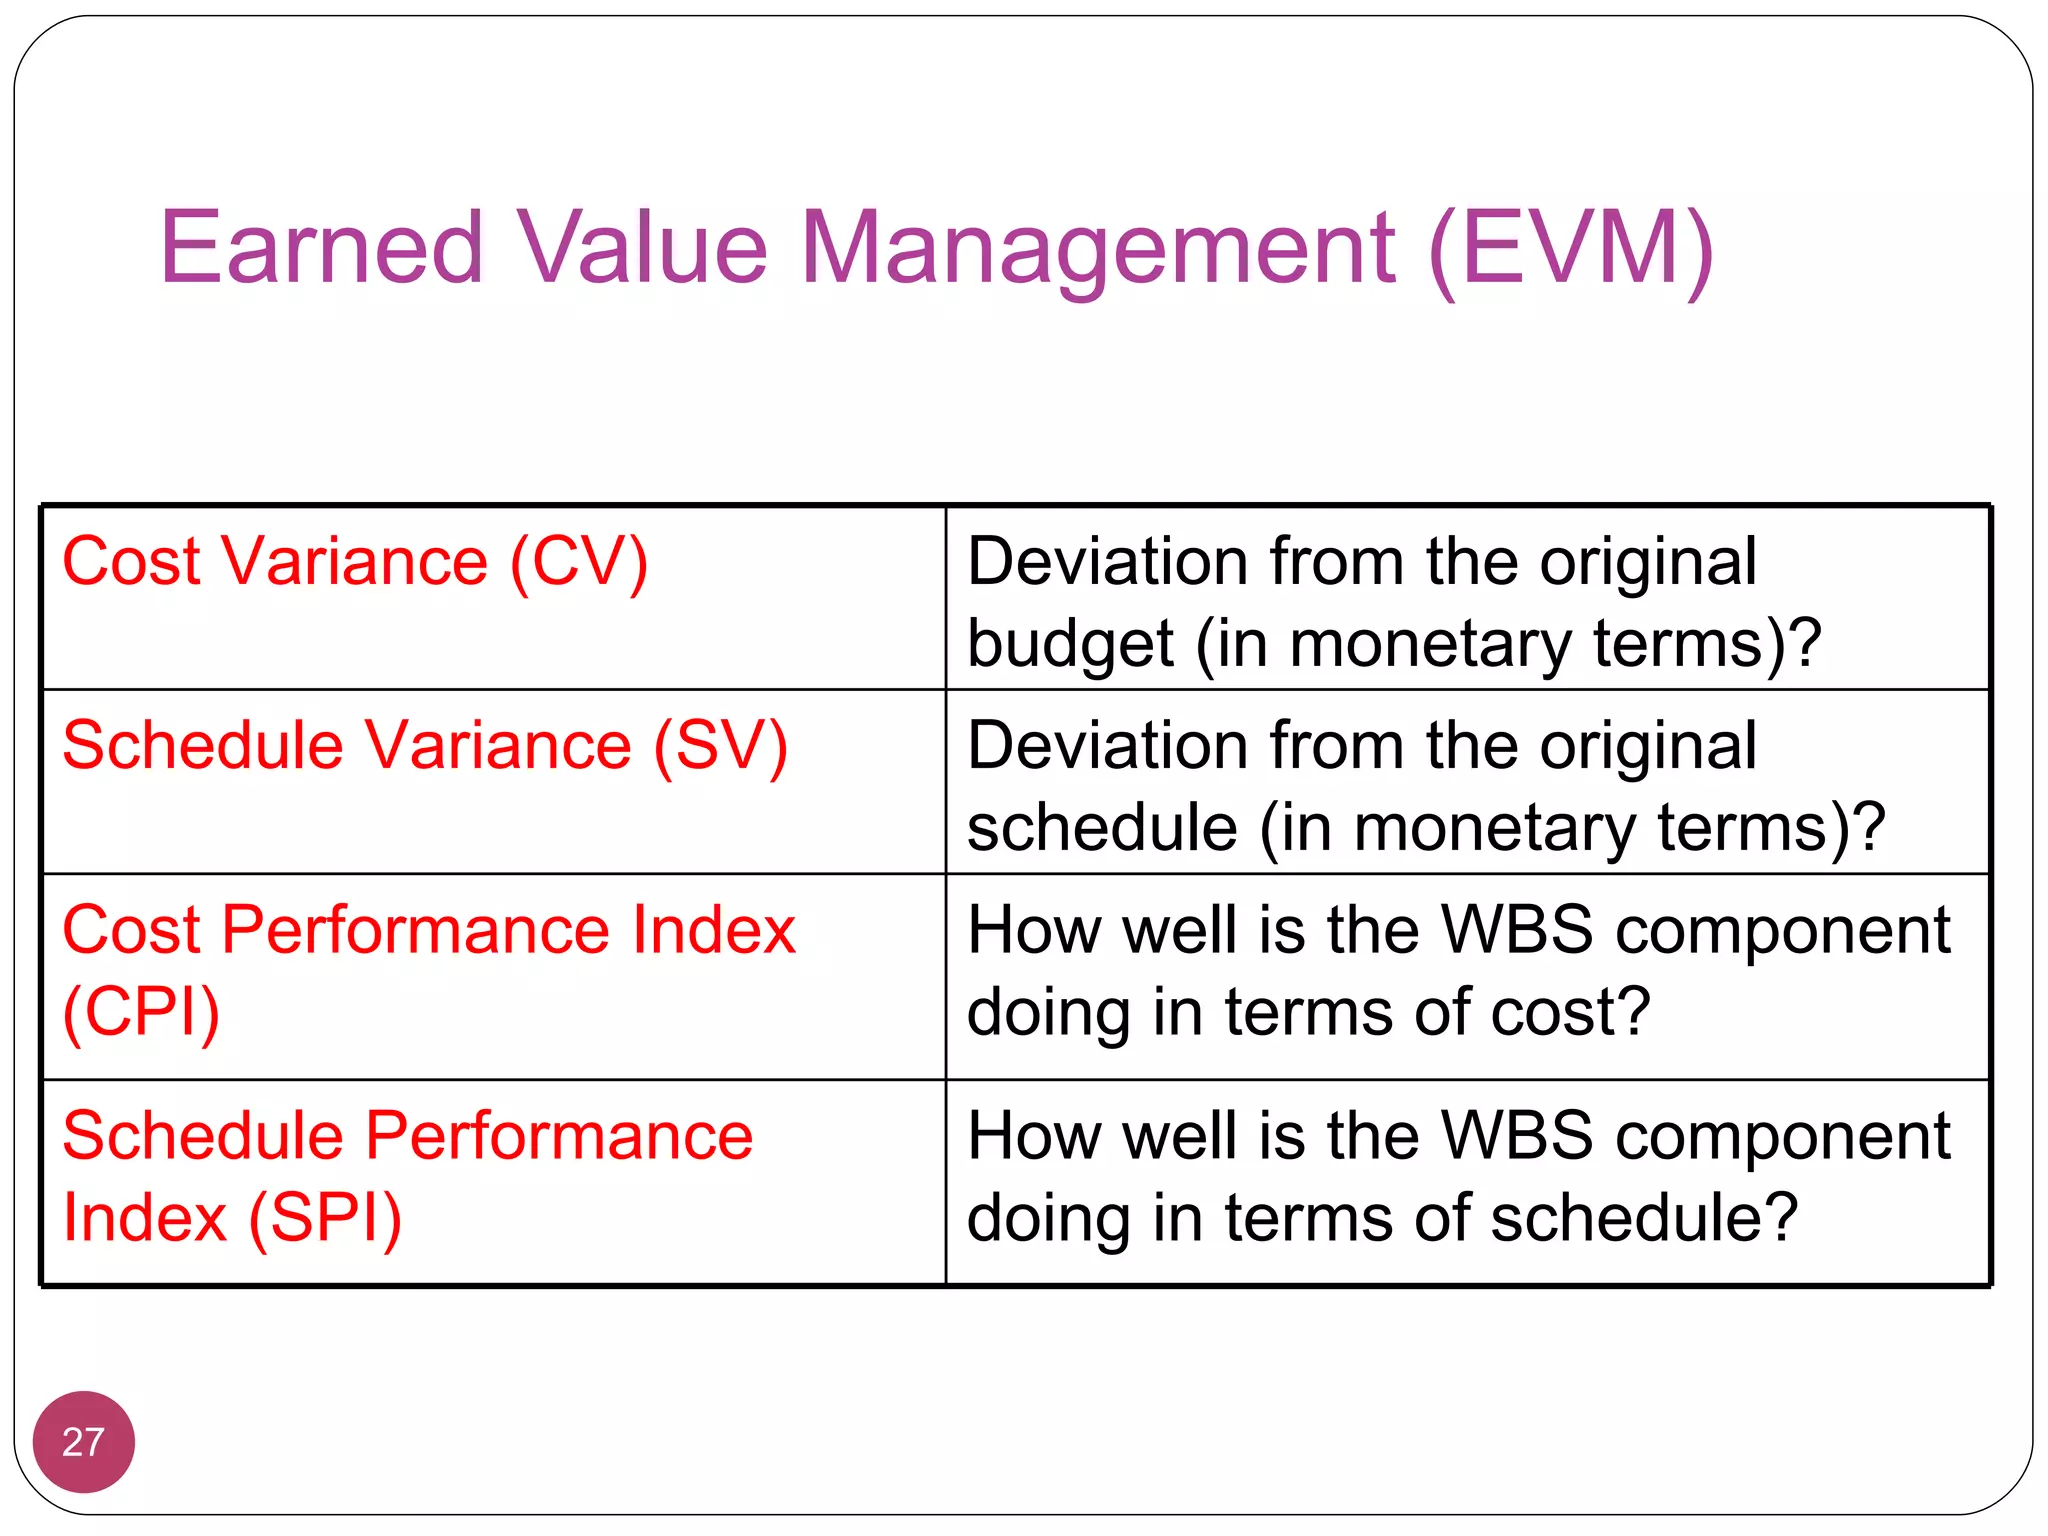
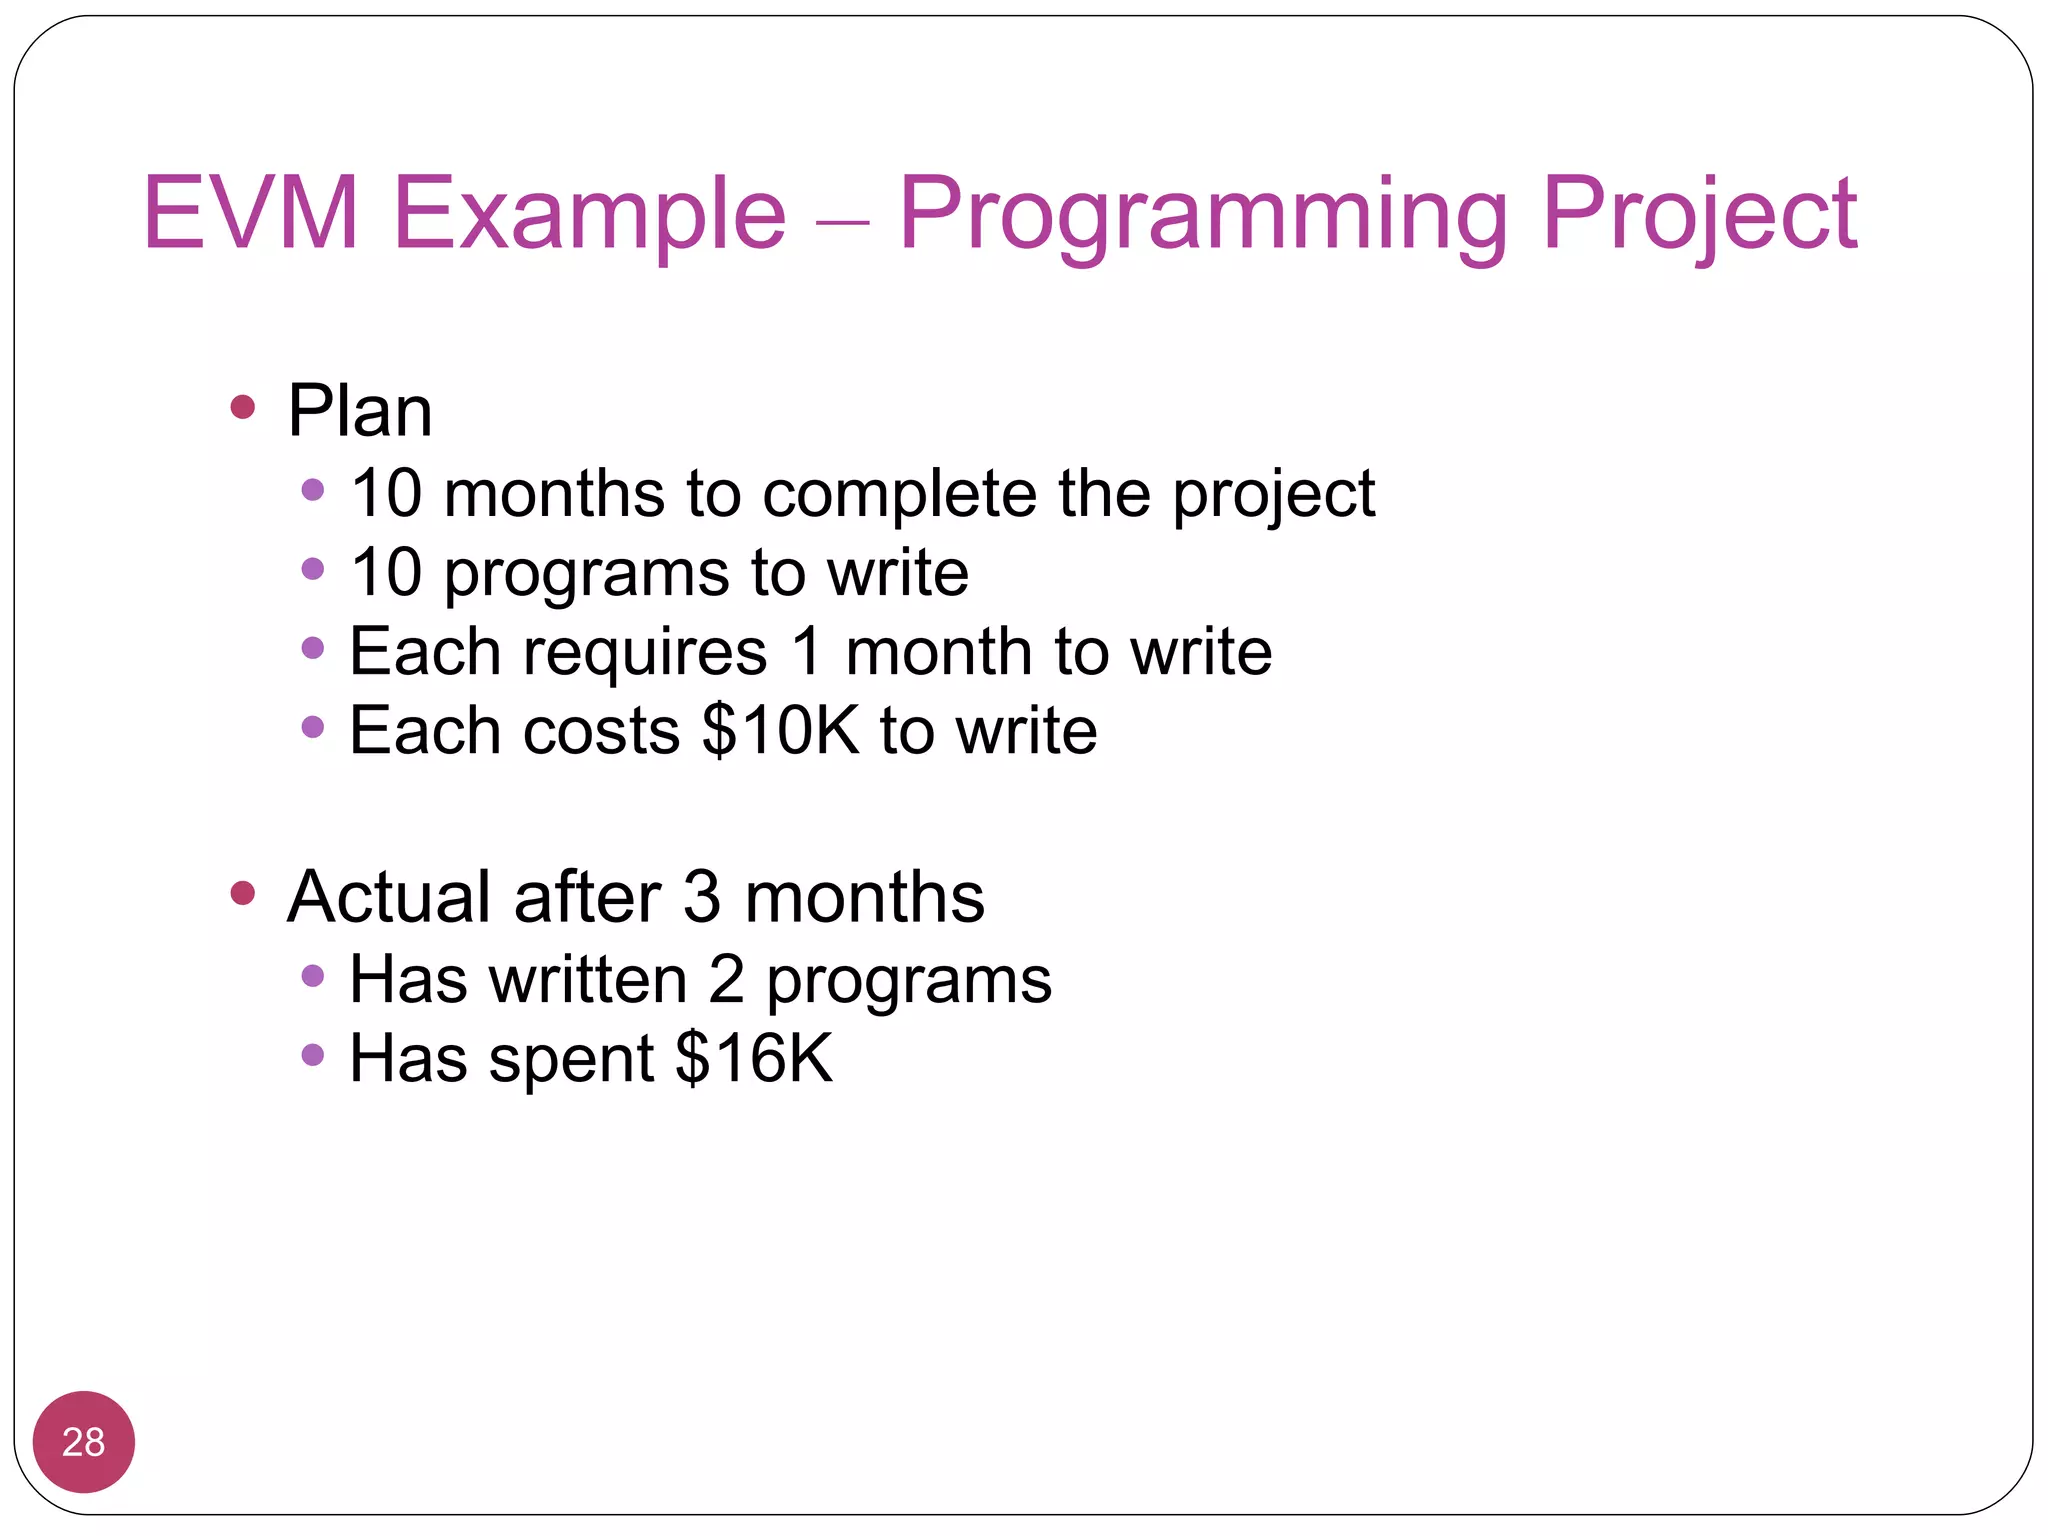
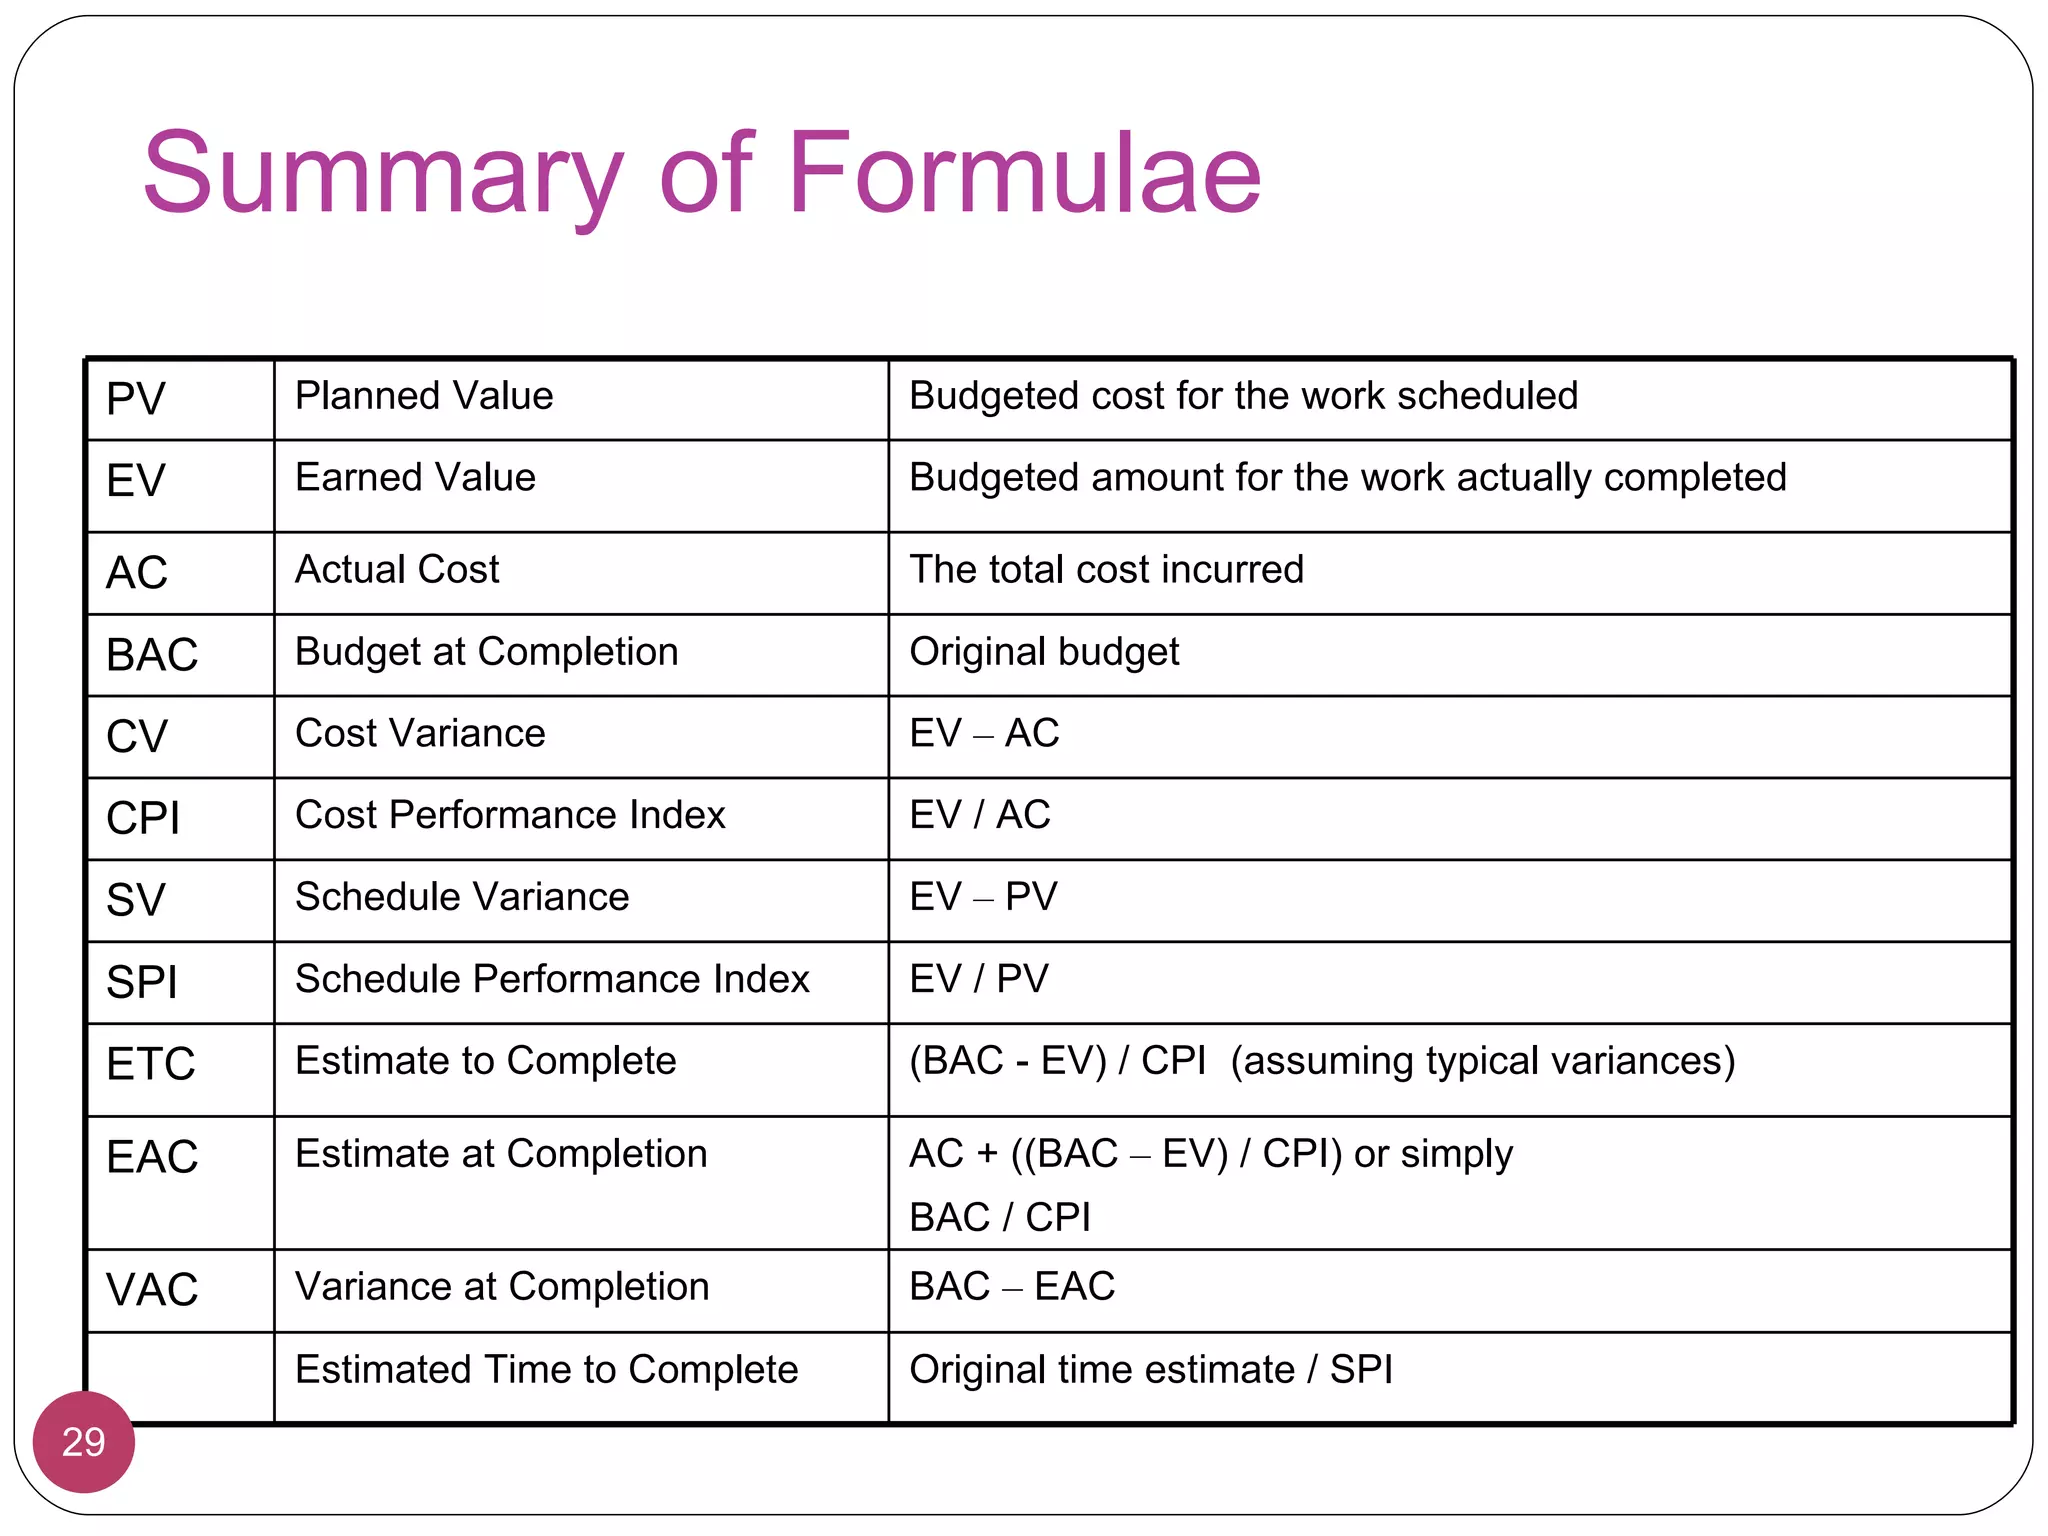
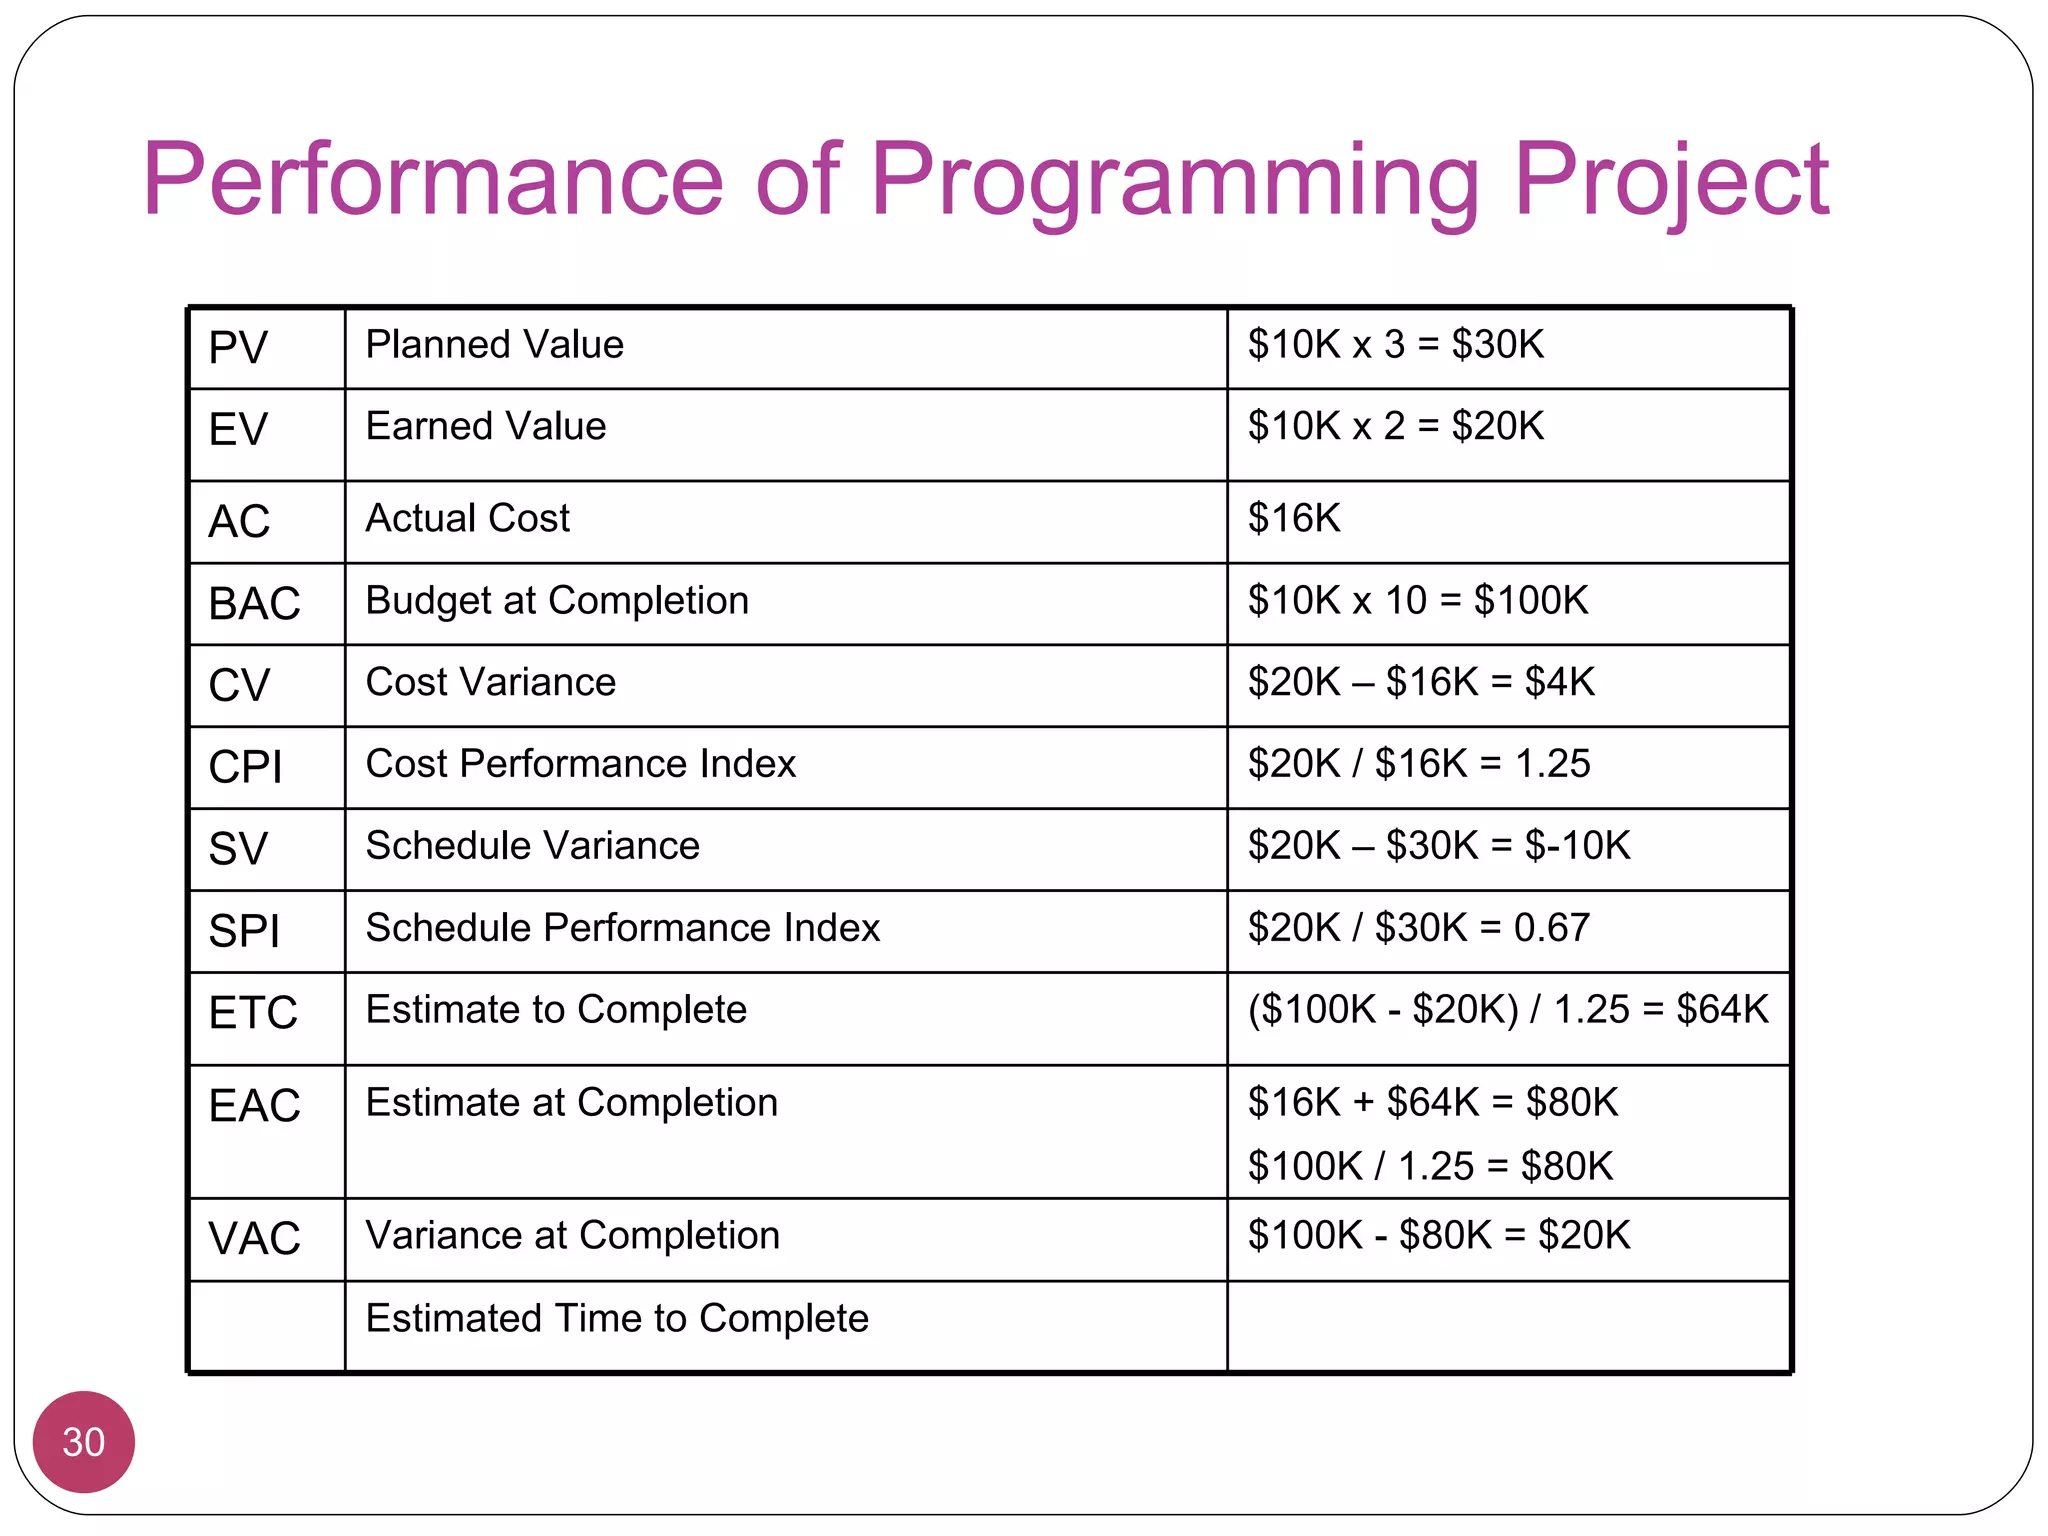
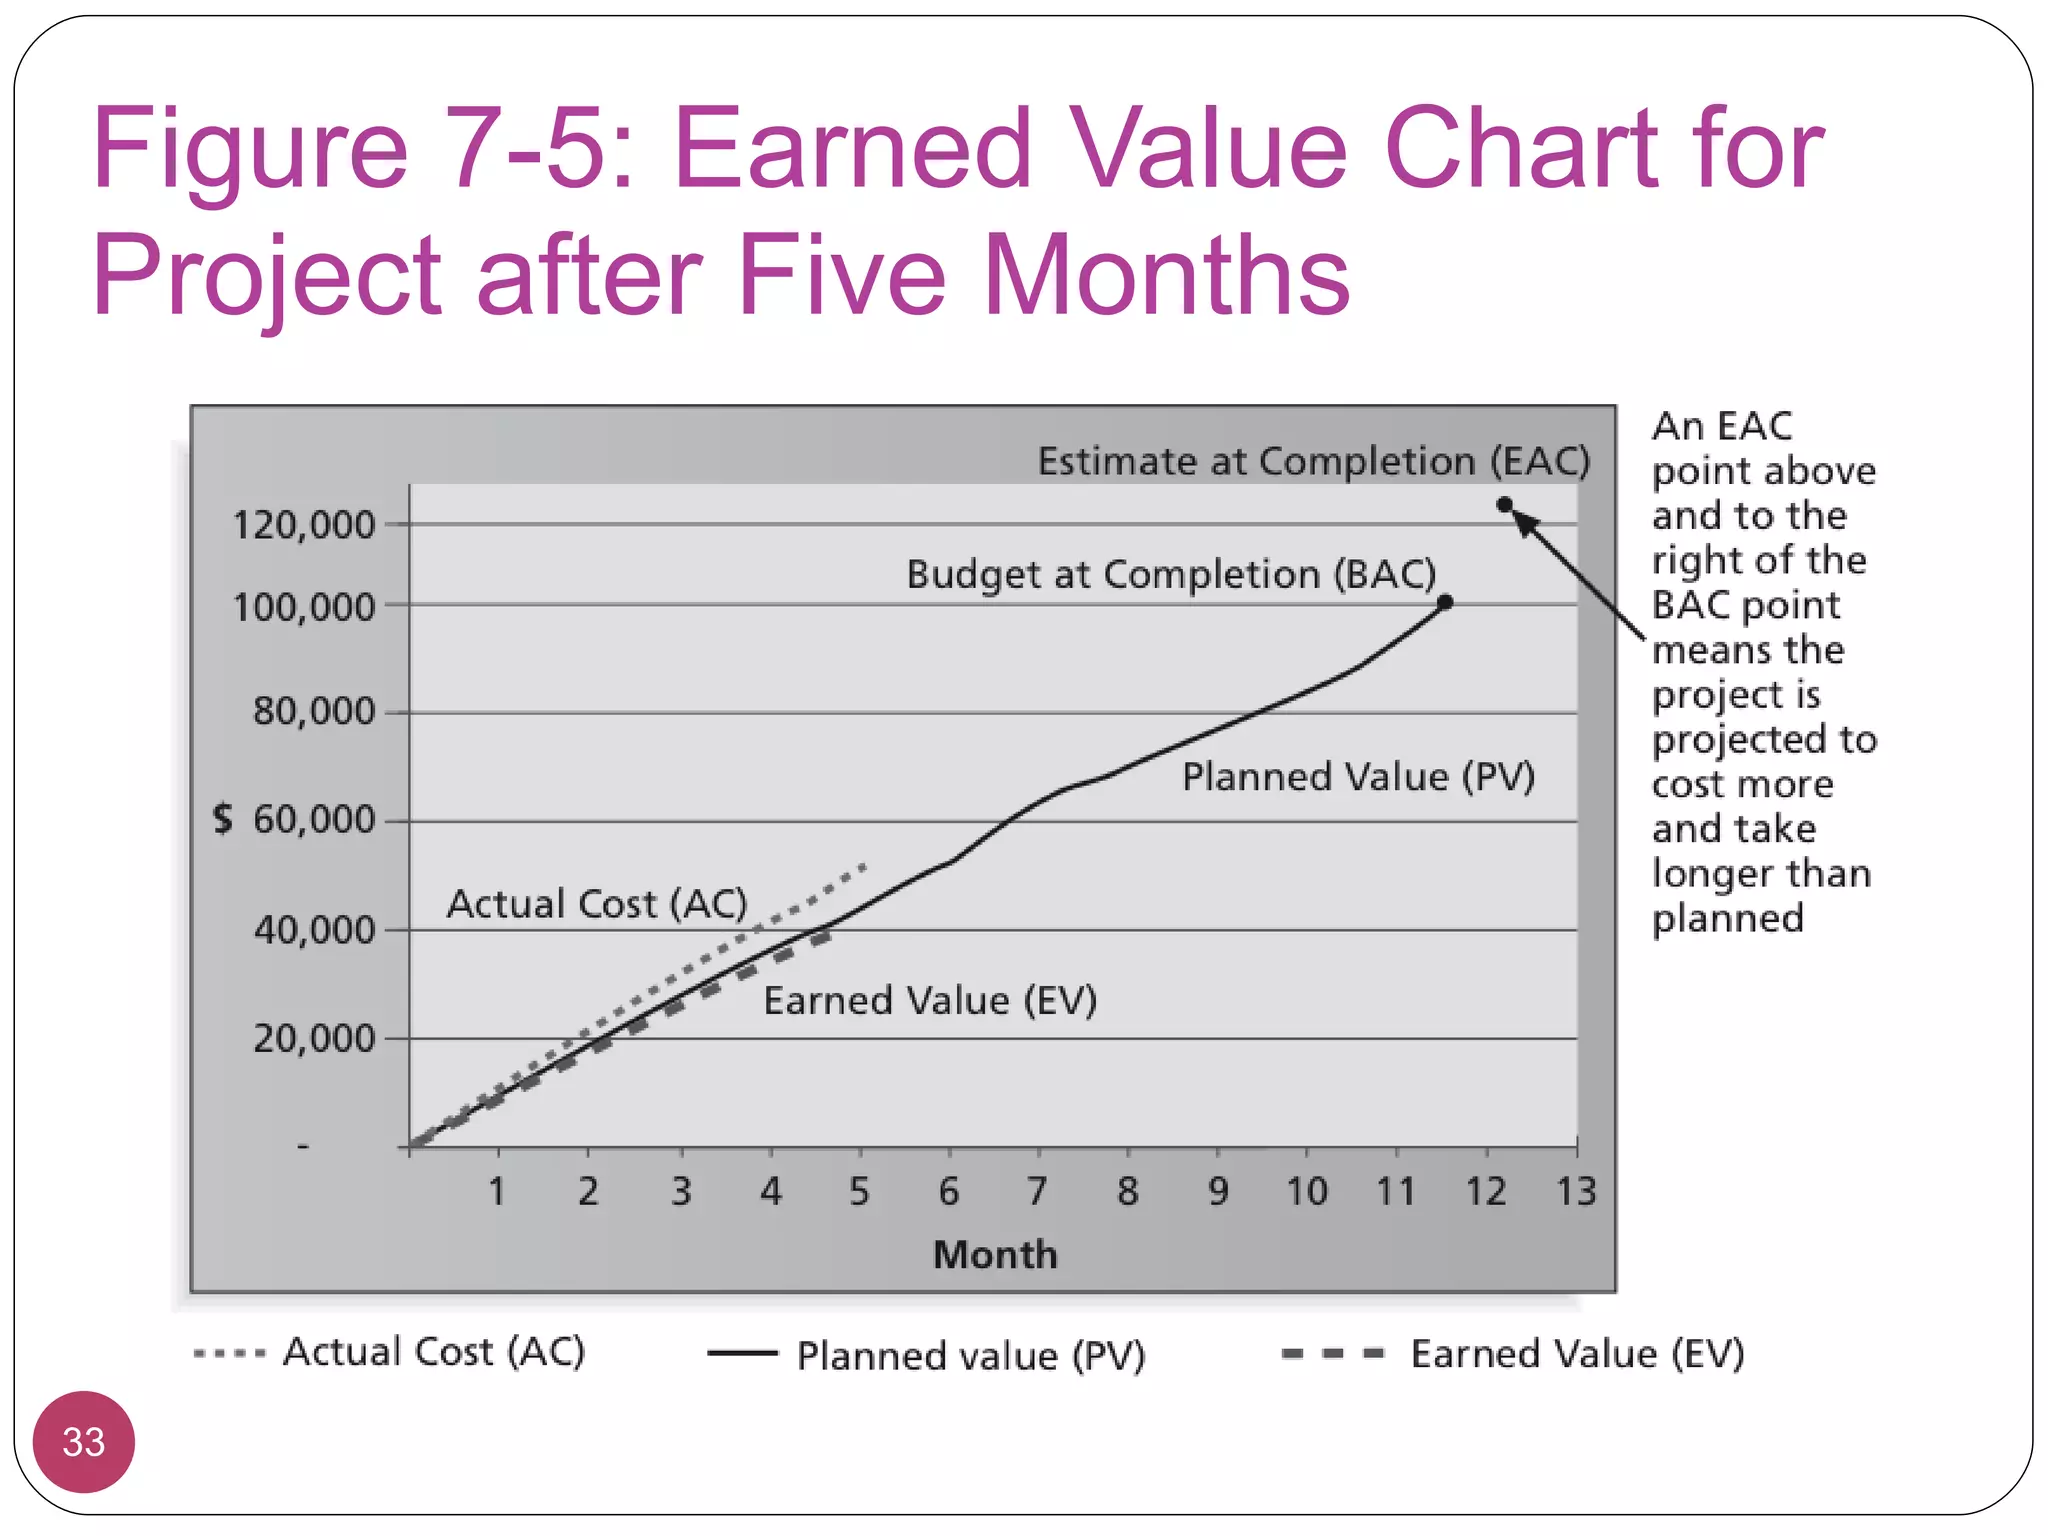
This document discusses project cost management principles and processes. It explains that IT projects often experience cost overruns and provides examples. The key processes for managing costs are estimating costs, determining budgets, and controlling costs. Estimating involves developing cost approximations, while determining budgets allocates the estimate to work items to establish a baseline. Controlling costs involves monitoring performance against the baseline and approving changes. Earned value management is presented as a technique to integrate scope, time and cost data to track project performance.


