Download as PDF, PPTX
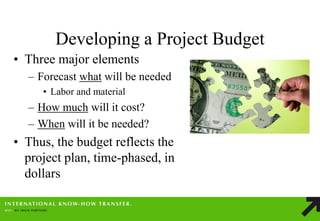
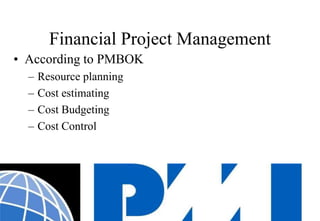
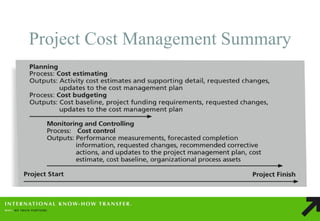
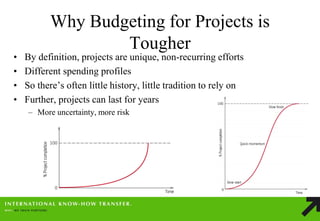
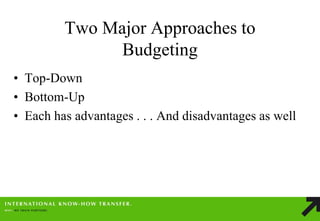
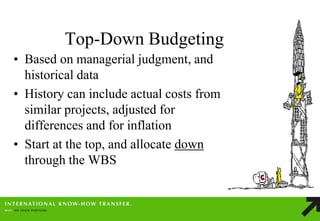
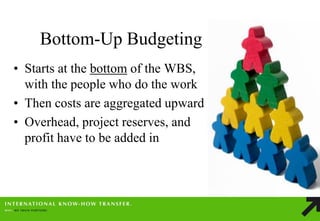
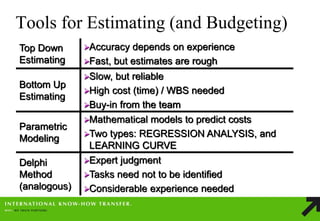
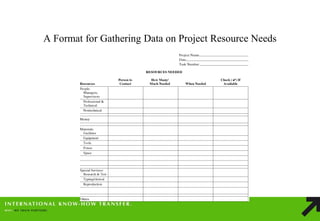
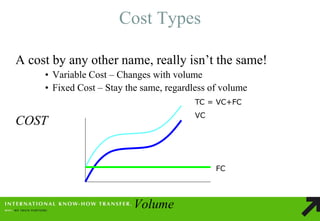
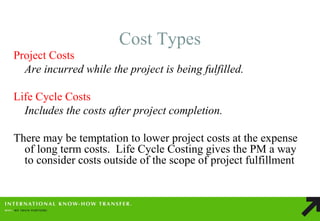
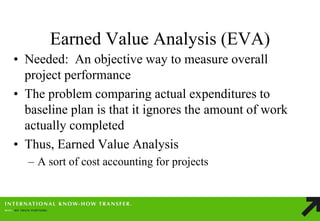
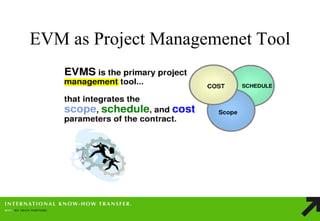
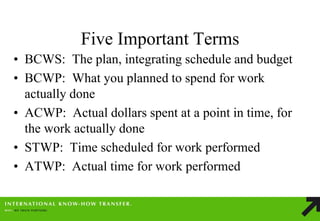
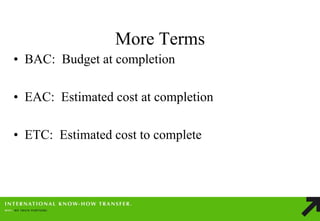
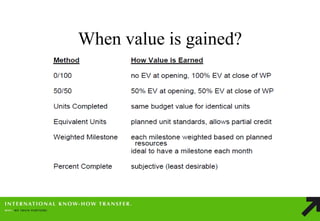
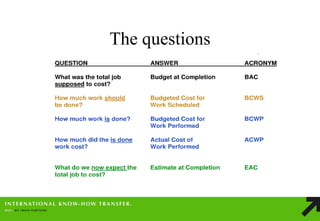
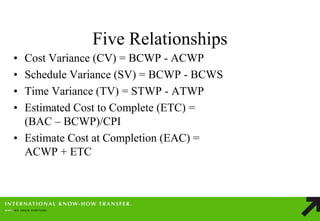
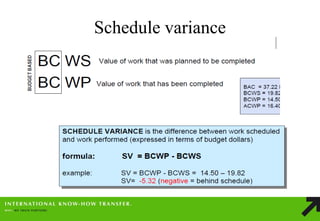
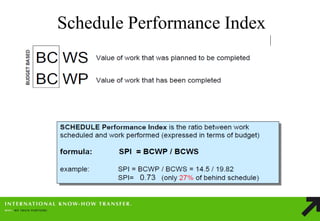
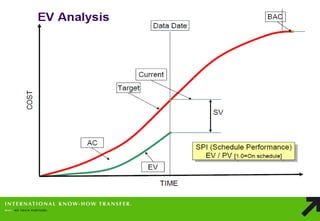
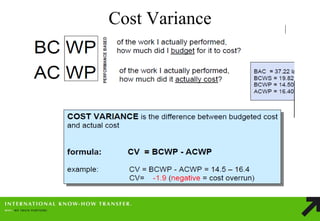
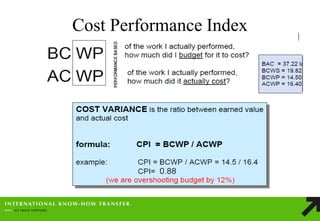
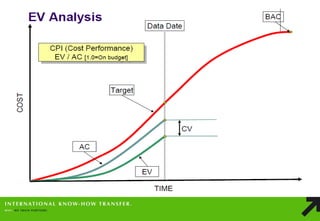
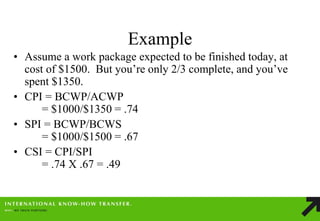
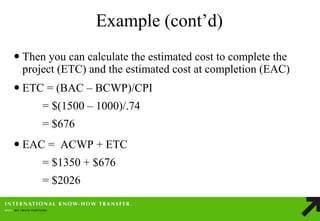


This document discusses project cost management and budgeting. It covers developing a project budget by forecasting labor, materials, and costs. It also discusses top-down and bottom-up budgeting approaches, as well as tools for estimating costs like parametric modeling, the Delphi method, and earned value analysis. Earned value analysis is presented as an objective way to measure project performance by comparing planned, actual work completed, and actual costs.


