Downloaded 175 times
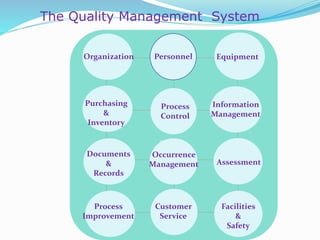


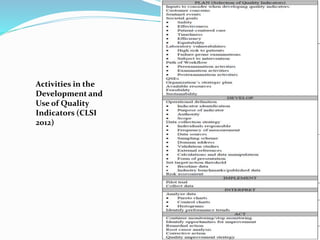
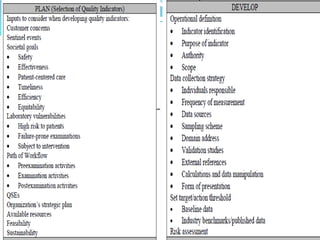
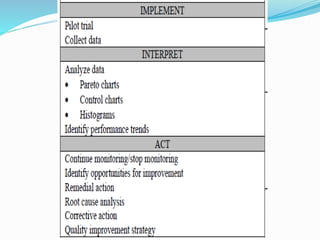
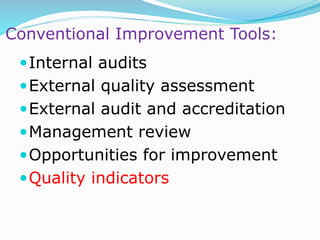
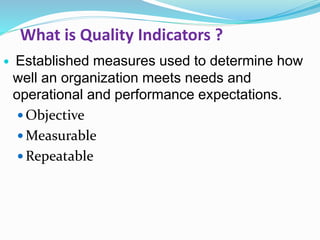
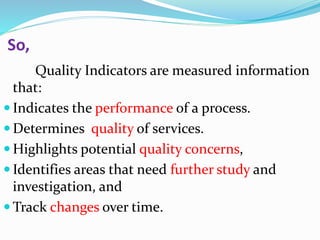
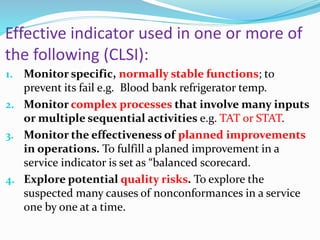


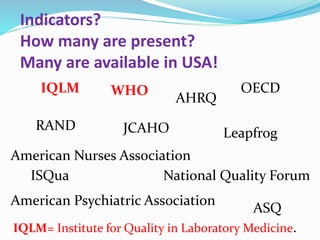

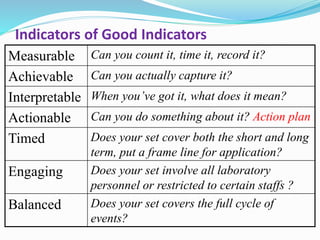
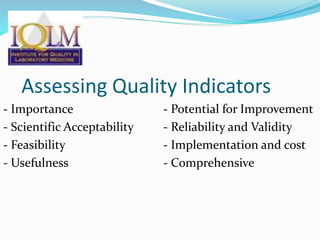
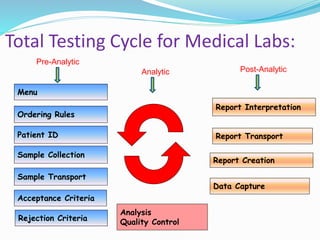
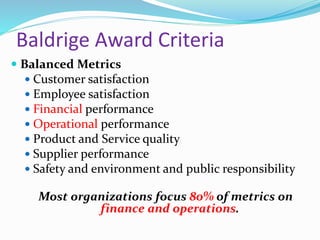
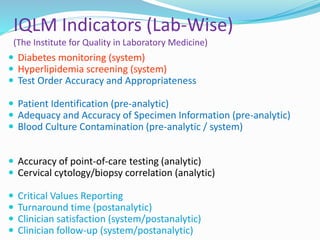
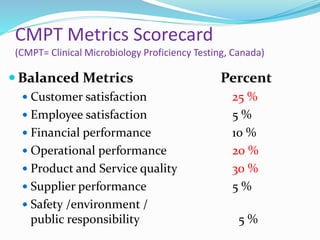


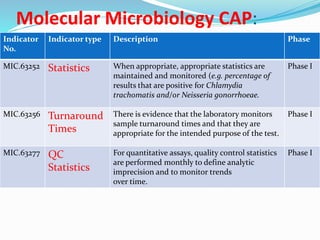
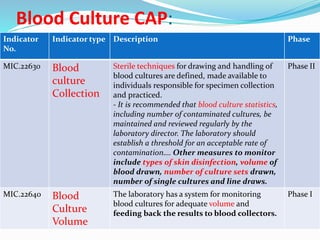
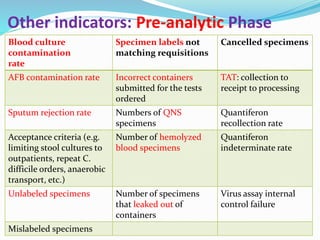
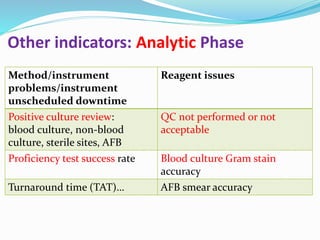
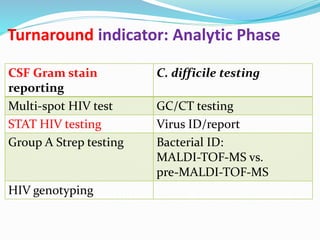
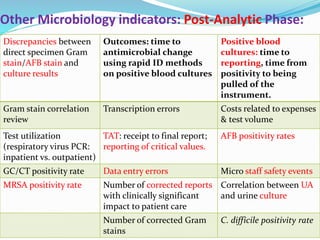
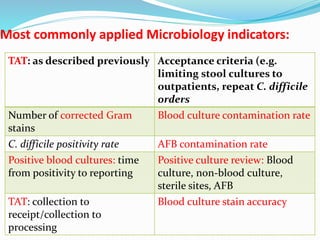
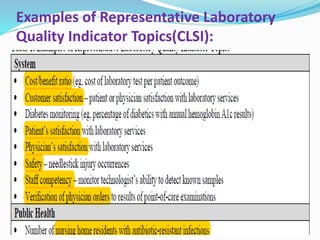
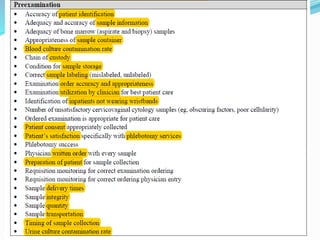
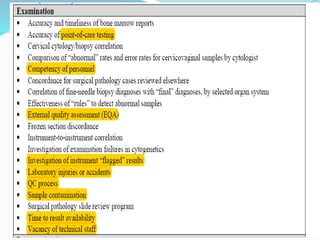
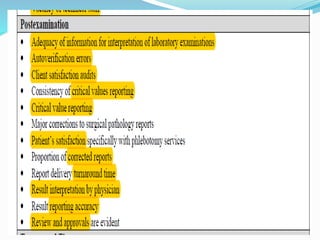

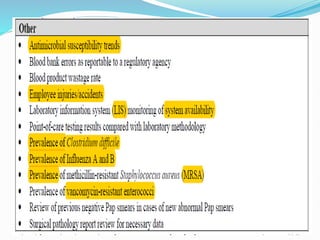


The document outlines the principles and processes involved in quality management systems for medical laboratories, emphasizing the importance of quality indicators in assessing and improving laboratory performance. It discusses various types of quality indicators, their significance, and methodologies for developing and implementing them to ensure high standards in laboratory services. Additionally, it highlights characteristics of effective metrics and provides insights into key performance indicators specific to microbiology.


