Downloaded 373 times


![Scope of applications of ABG:
1- Staff working in analysis and presentation of AST data
(e.g. clinical microbiologists, pharmacists, physicians).
2- Staff utilizing cumulative AST data to make clinical
decisions (e.g. clinical microbiologists, infectious
disease specialists and other clinicians, infection
control practitioners, pharmacists, epidemiologists,
other health care personnel, and public health
officials).
3- For designing information systems for the storage and
analysis of AST data (e.g. laboratory information system
[LIS] vendors, manufacturers of diagnostic products
that include epidemiology software packages).](https://image.slidesharecdn.com/antibiogrammypresention-170404064431/75/Antibiogram-CLSI-Recommendations-10-2048.jpg)


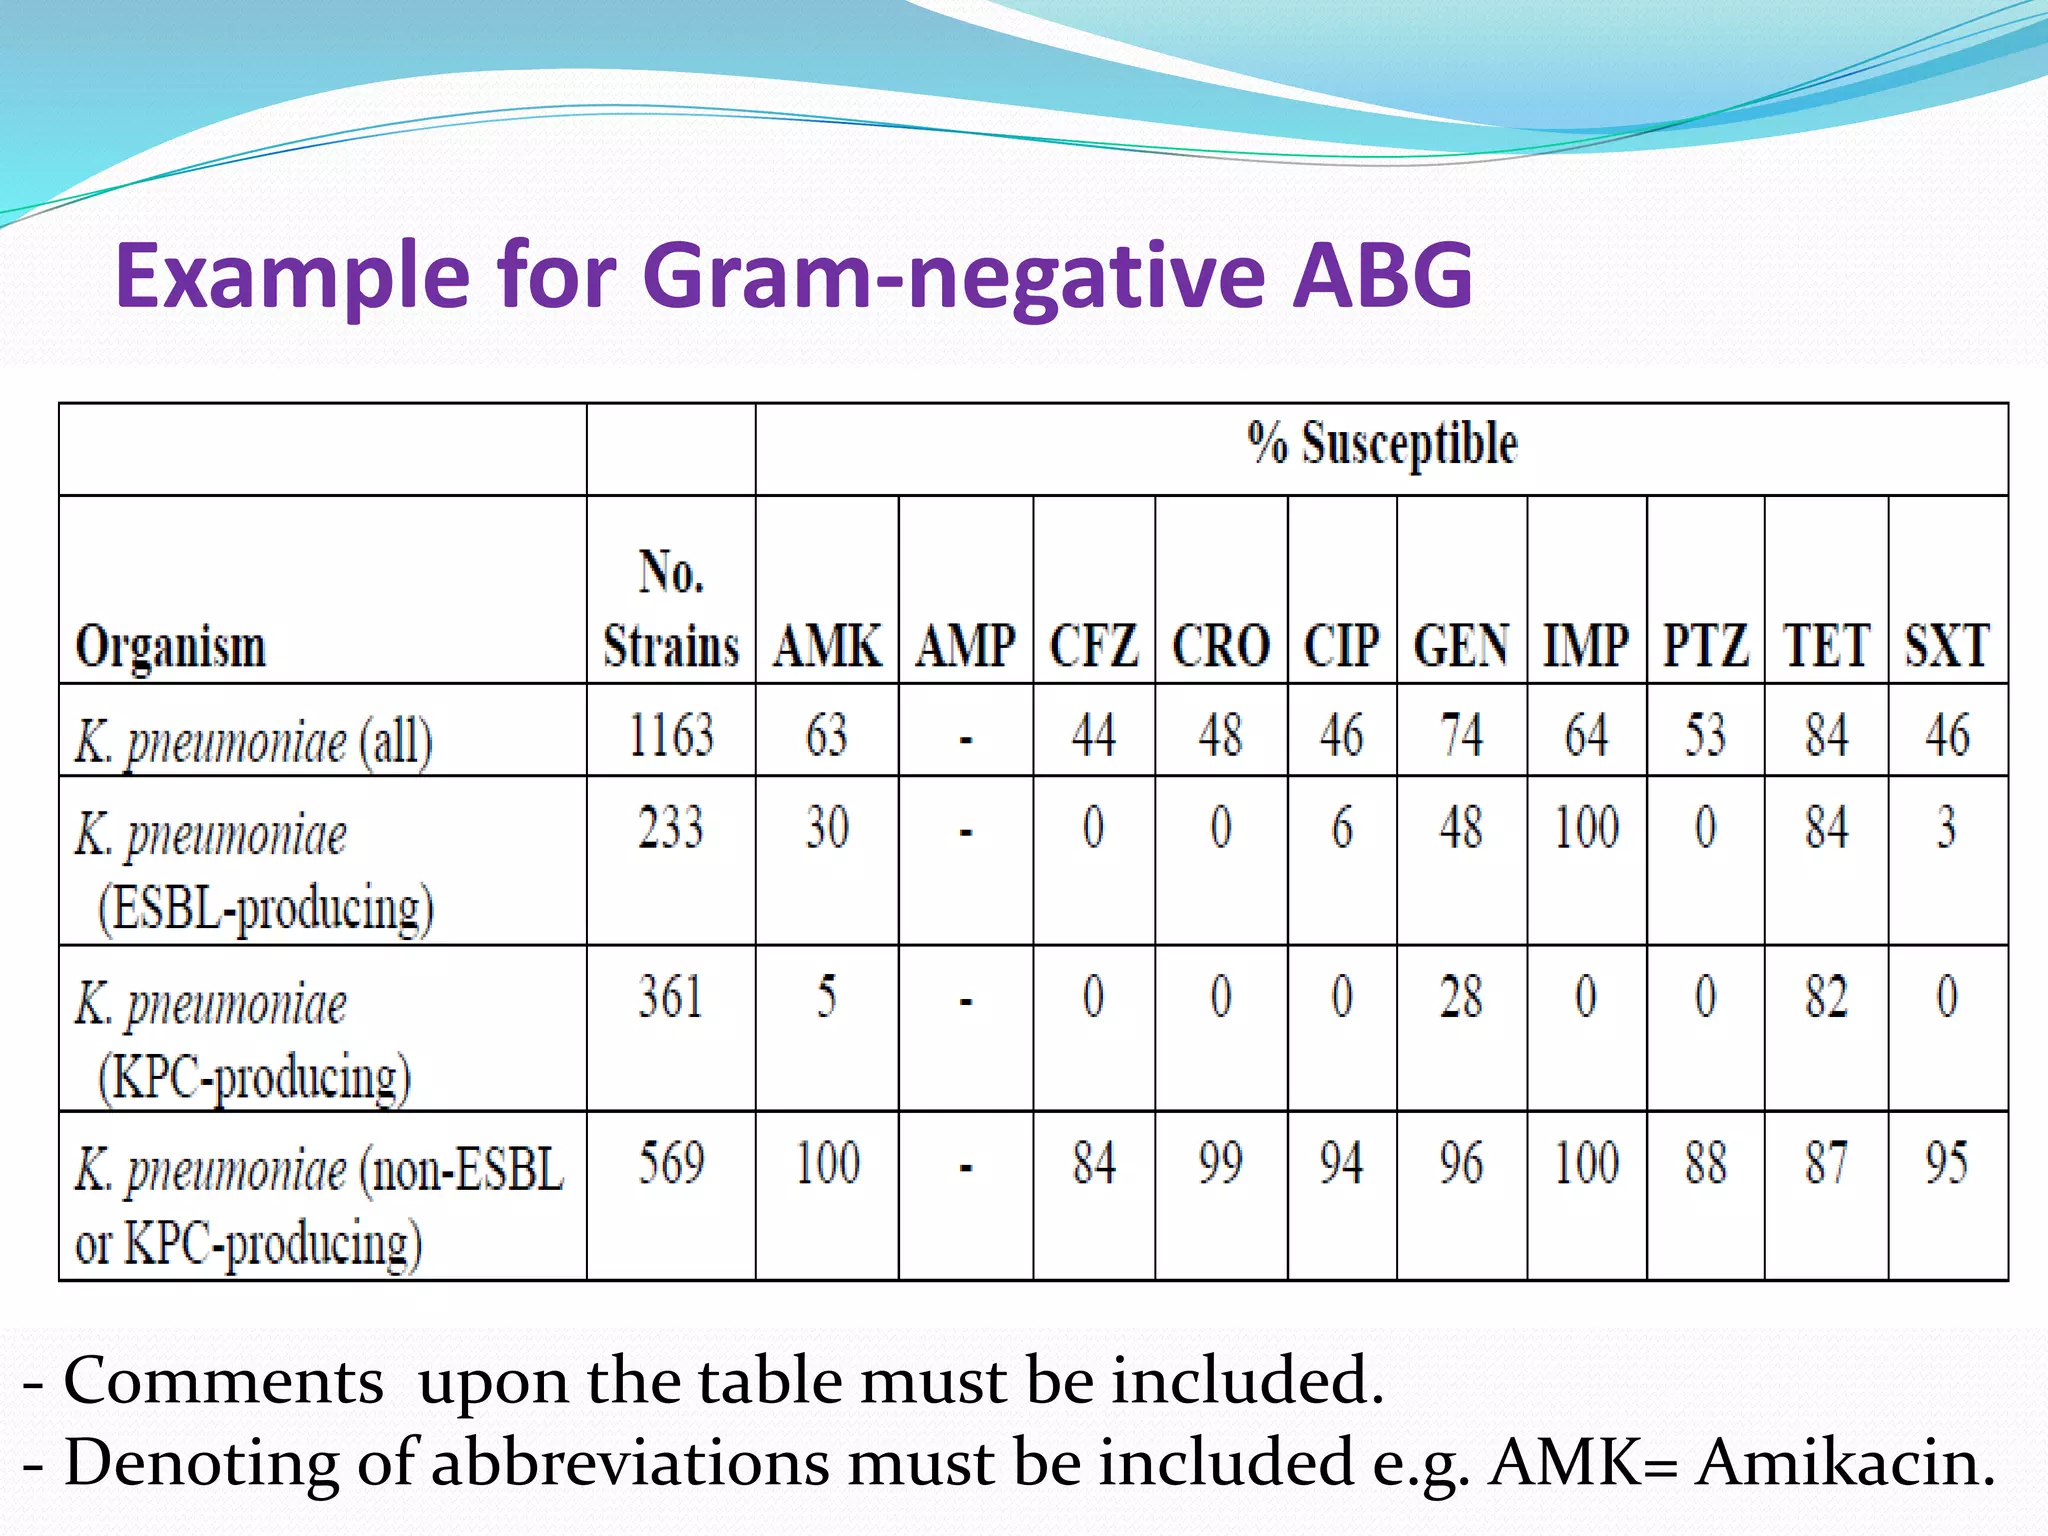


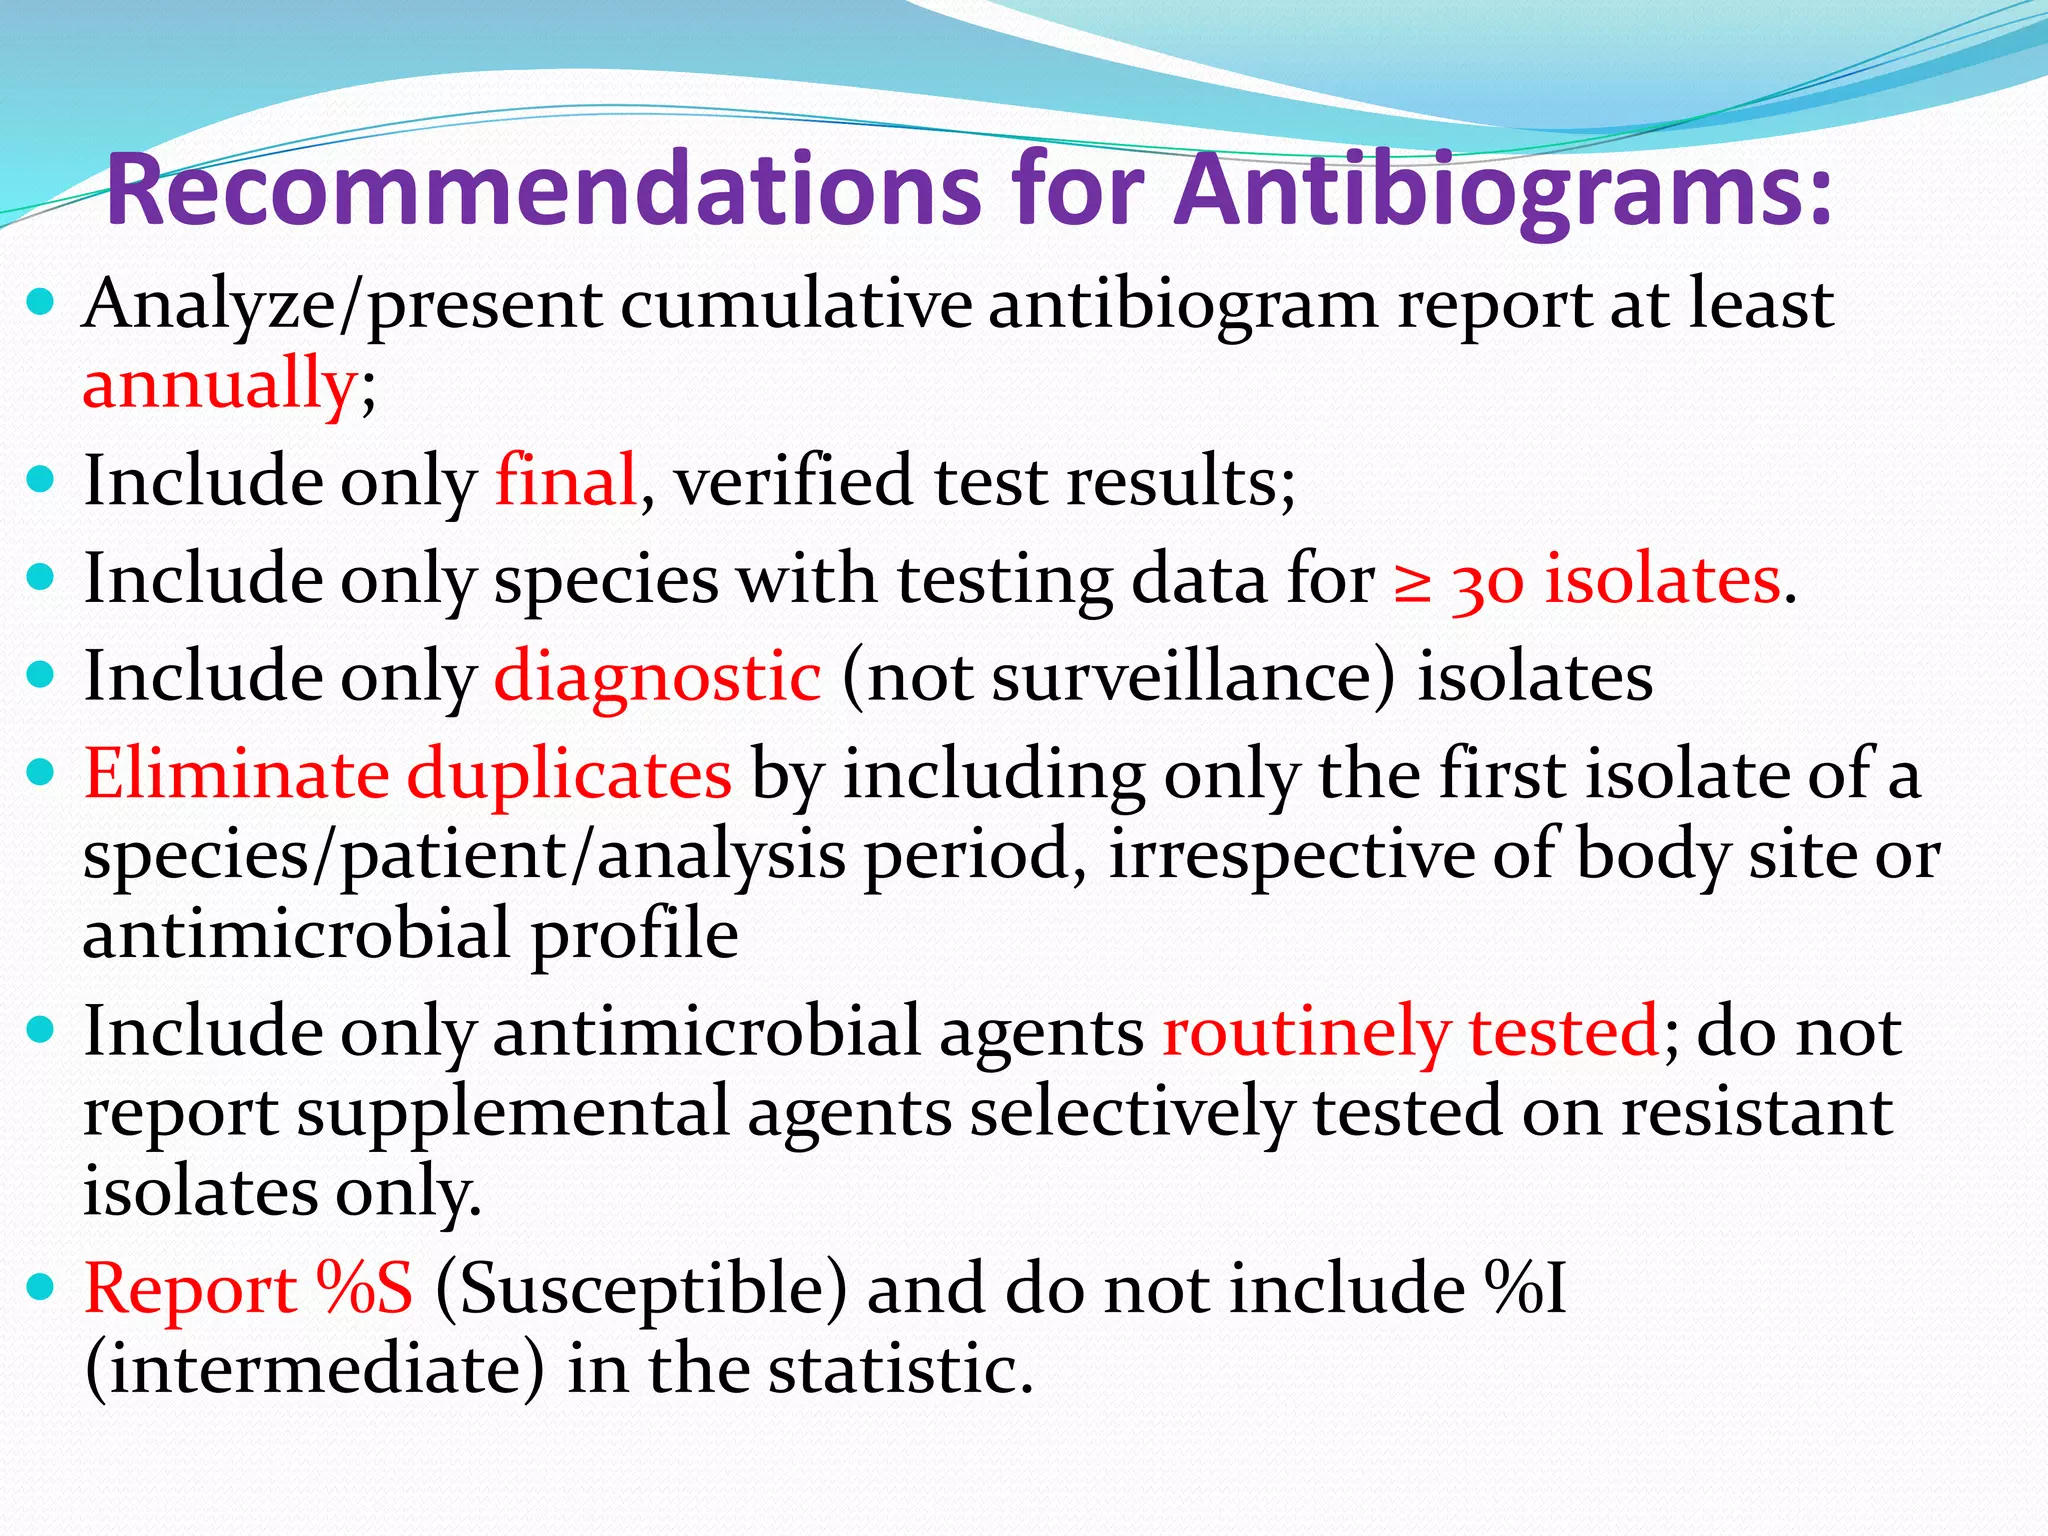
This document provides guidance on antibiograms, which are profiles of antimicrobial susceptibility testing results that summarize percentages of microorganisms susceptible to various drugs. It discusses generating antibiograms from aggregate laboratory data and including only clinically useful drugs. Methods for measuring susceptibility like disc diffusion and broth dilution are outlined. Recommendations include analyzing data annually and only including common species and diagnostic isolates. Antibiograms help guide empirical treatment and detect resistance trends. Limitations include potential biases and small isolate numbers reducing significance.


