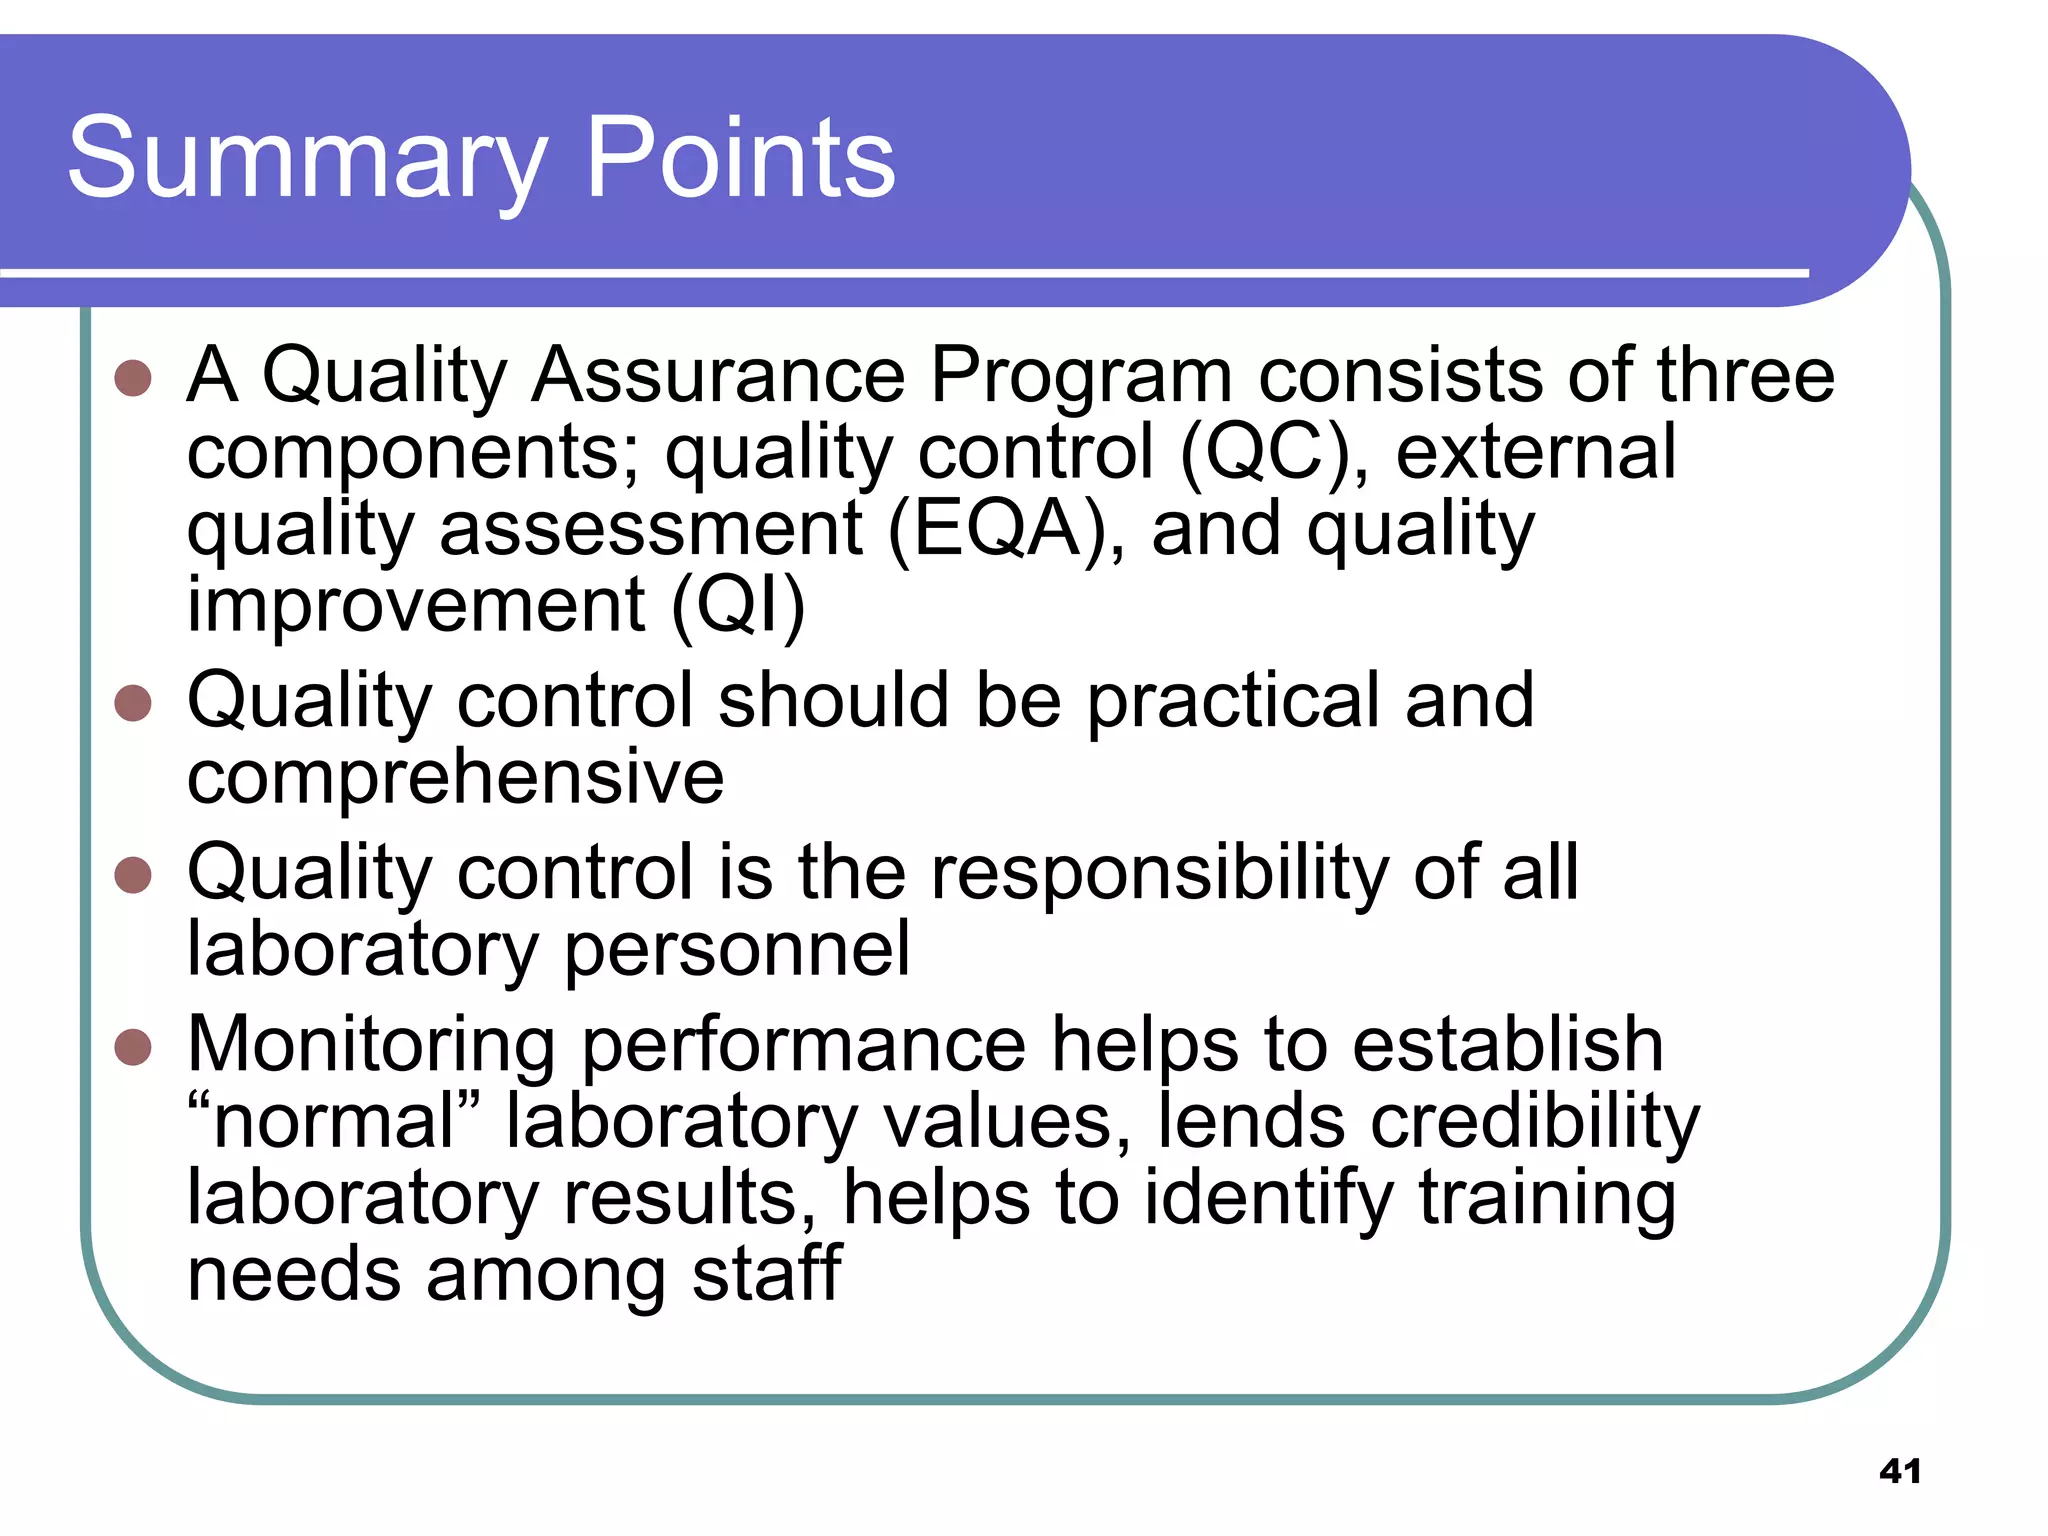
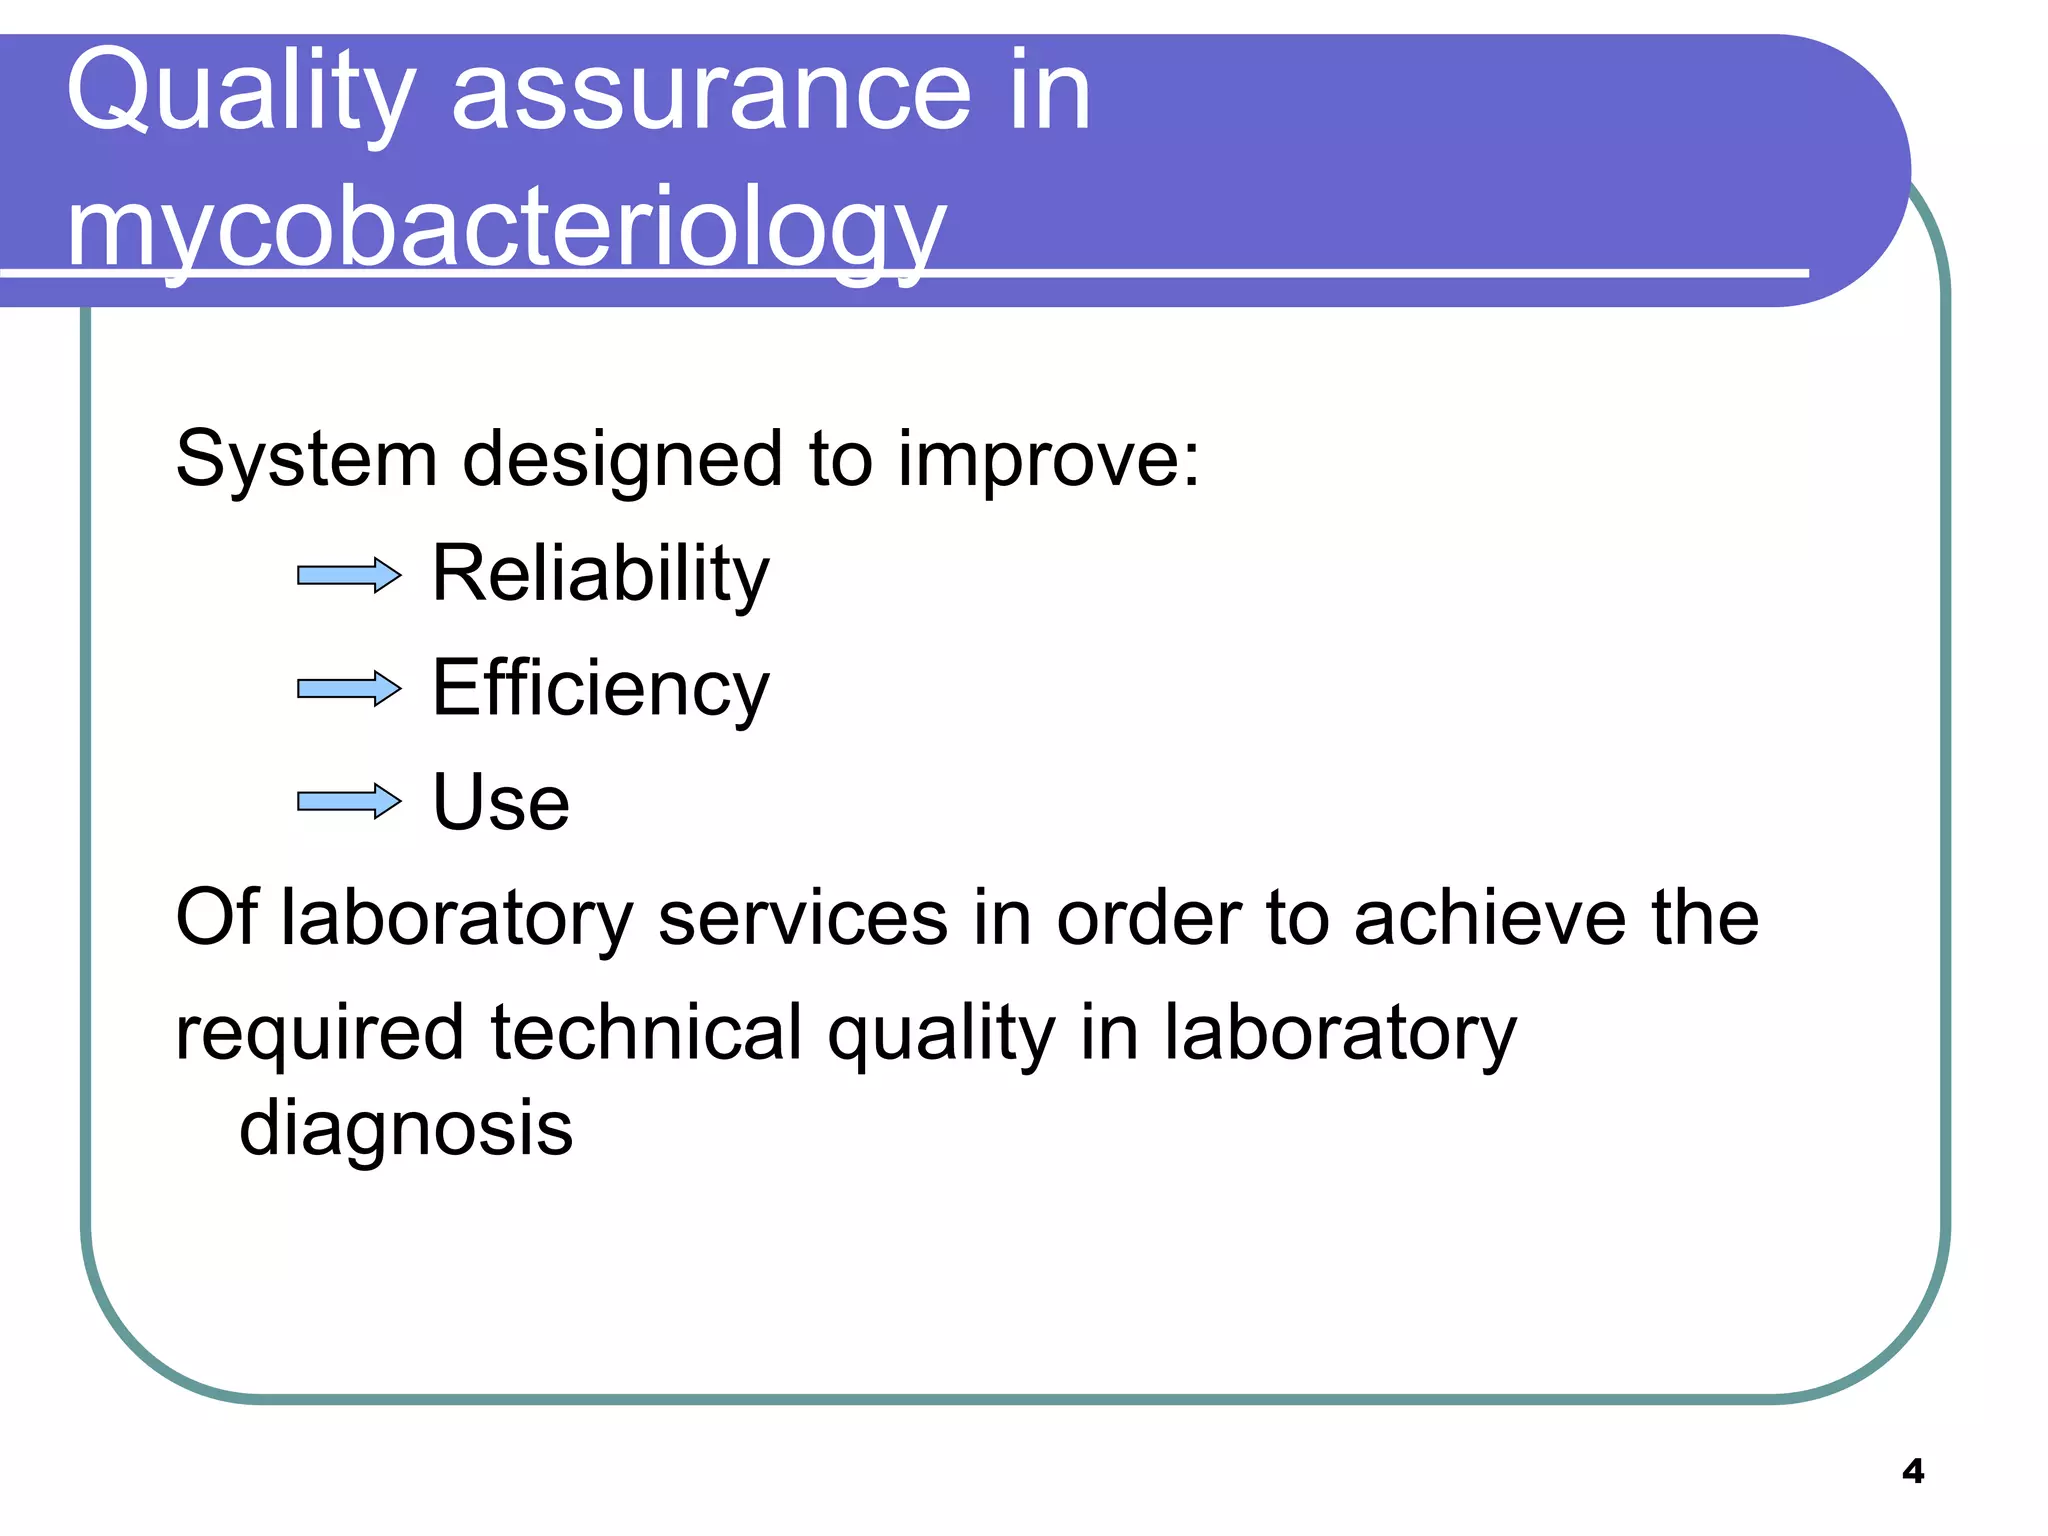
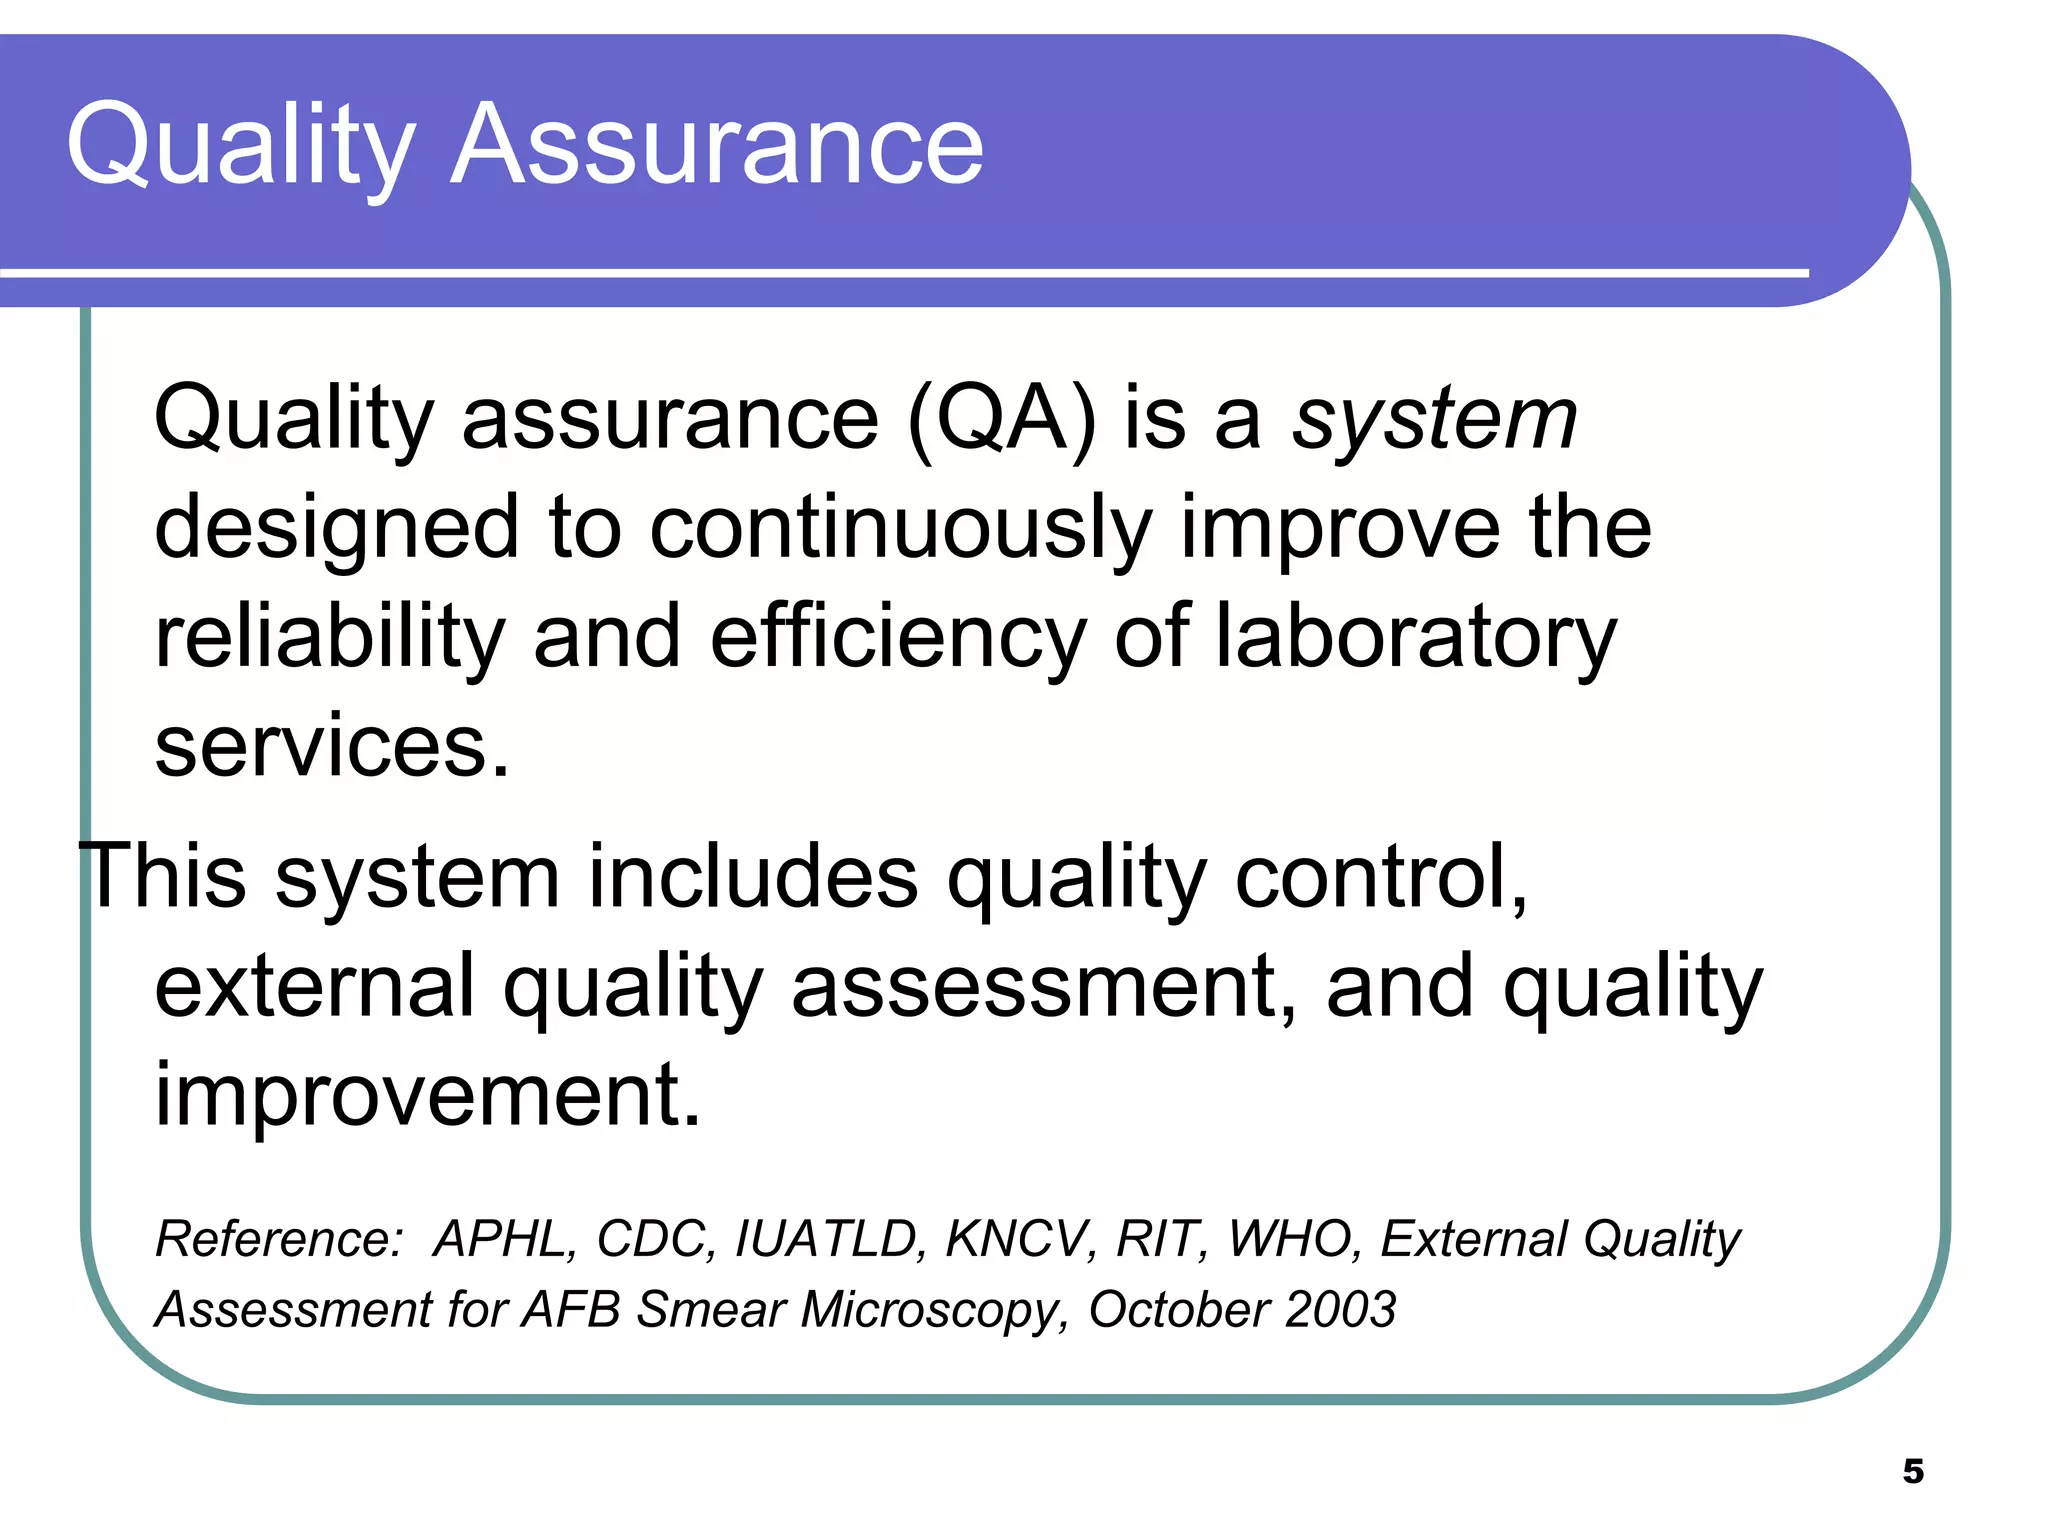
Quality Assurance/Quality Indicators
Content adapted from standardized WHO, GLI, CDC and NHLS Training Materials for
use by the African Centre for Integrated Laboratory Training, 2010
1
Content Outline
 The 3 main components of a QA
system and their importance
 Adhere to the QC and EQA
procedures
 Quality Indicators
2
Developing a Quality Assurance plan
 Practical
 Specific procedures are available for specific
components of the plan
 Ensure the following are addressed:
 General laboratory systems
 Pre-analytical phase of testing
 Analytical phase of testing
 Post-analytical phase of testing
3
System designed to improve:
Reliability
Efficiency
Use
Of laboratory services in order to achieve the
required technical quality in laboratory
diagnosis
Quality assurance in
mycobacteriology
4
Quality Assurance
Quality assurance (QA) is a system
designed to continuously improve the
reliability and efficiency of laboratory
services.
This system includes quality control,
external quality assessment, and quality
improvement.
Reference: APHL, CDC, IUATLD, KNCV, RIT, WHO, External Quality
Assessment for AFB Smear Microscopy, October 2003
5
I- Quality Control
 Quality control (QC)
 A systematic internal monitoring of working
practices, technical procedures, equipment,
and materials, including quality of stains.
Reference: APHL, CDC, IUATLD, KNCV, RIT, WHO, External Quality
Assessment for AFB Smear Microscopy, October 2003
6
Quality Control should be:
 Practical
 Workable
 Comprehensive
7
Quality Control
 Process of effective and systematic
monitoring of all laboratory activities
 Establish limits of acceptable standard of
test performance
 Laboratory data should be accurate,
reliable, reproducible, comparable
QC is the responsibility of all laboratory
personnel
8
QC-General Laboratory Systems
 Laboratory arrangement
 Human resources (training health control)
 Laboratory Equipment
 Collection and transport of specimens
 Handling of specimens
 Reagents and media
 Culture procedures
 Reporting of results
9
QC - Laboratory arrangement
 Ensure that doors in the laboratory
are always closed.
 Work areas, equipment and supplies
arranged for logical and efficient work
flow.
 Work areas should be clean
 Benches swabbed after each use with
an appropriate disinfectant
10
QC - Laboratory Arrangement and
Administration
 Schedule of tests
 Every procedure is written
 Keep written procedures in the laboratory for easy
reference
 Any changes must be dated and initialised by the
laboratory supervisor
 Records retained for two years
 Management of procurements
 Equipment/ consumables acceptance
 Laboratory procedures used routinely should be SOPs,
published in reputable microbiological books, manuals
or journals
11
Human Resources
 Documented credentials for staff
 Organisational flow chart/organogram
 Orientation
 Training
 New staff: at initial hire, again at 6 months
 Existing staff: once per year
 All training should be documented
 Sufficient staff to support workload
12
Pre-analytical systems
 Instructions to submitters
 Appropriate specimens
 Collection, transport procedures
 Specimen monitoring requirements
 Documentation of specimen quality
 Specimen rejection policy
 Test requests
 Essential documentation (patient name, specimen
source, diagnostic vs. follow-up, collection date)
 Compared to specimen for consistency
13
Analytical systems
 Standardized operating procedures
 Updated annually and/or more often as
needed
 Reviewed and initialed by staff annually
 Retired procedures removed, labeled as
“retired”, initialed and dated
 Equipment calibration
 Thermometers
 Pipettes
 Timers
14
Analytical systems
 Quality control procedures and corrective actions
 Test procedures
 Microscopy
 Processing and culture methods
 Identification/susceptibility testing
 Media and reagents
 Sterility checks/performance characteristics
 Labeling/storage (name, conc., temp.)
 Dated (received/prepared, in use, expired)
 Equipment (also includes preventive maintenance)
 Centrifuge
 Incubator, waterbaths, etc.
 Safety cabinets
 Refrigerators/freezers
 Culture instruments
15
Analytical systems
 Validation of new methods/procedures
 All new methods are evaluated against the
reference/gold standard for
 Sensitivity-proportion of true positives
correctly identified by the test
 Specificity – proportion of true negatives
correctly identified by the test
 Positive predictive value
 Negative predictive value
 Turn around time
16
Corrective actions
 Identify (potential) problem
 Analyze the (potential) problem
 Identify the (potential) solution
 Select and plan solution
 Implement solution
 Evaluate solution
 Maintain and/or improve solution
Reference: Corrective and preventive action document. SANAS
(South African National Accreditation System)
17
Corrective actions: example
 Identify (potential) problem: suboptimal or poor quality media [LJ]
 Analyze the (potential) problem: poor quality media may impact the
yield/recovery of MTBC, lack of media may impact turn around time
 Identify the (potential) solution: potential solutions include
purchasing commercially prepared media, or asking for assistance
from the NRL
 Select and plan solution: gather catalog and vendor information or
contact NRL to establish relationship and determine the feasibility of
this option
 Implement solution
 Evaluate solution: determine the cost effectiveness of the solution,
the amount of lead time required to receive the media
 Maintain and/or improve solution
Reference: Corrective and preventive action document. SANAS (South African
National Accreditation System)
18
Post-analytical systems
 Validation of test results
 Review of positive and/or negative results by
supervisor/lead microbiologist
 Routine monitoring of performance
(performance indicators)
 Results audit
 Monitoring of turn around time for smear,
culture, drug susceptibility results
 Procedure for the delivery of timely positive
results
19
Keys to Successful Quality Control
 Adequately trained, interested and
committed staff
 Common-sense use of practical
procedures
 A willingness to admit and rectify
mistakes
 Effective communication
20
External Quality Assurance
 External Quality Assurance (EQA)
 A process which allows participant laboratories to assess their
capabilities by comparing their results with those in other
laboratories in the network (intermediate and central laboratory)
through panel testing and blinded rechecking. EQA also includes
on-site evaluation of the laboratory to review quality of
performance and should include on-site re-reading of smears.
EQA is an expansion of the proficiency testing as described by
IUATLD.
Reference: APHL, CDC, IUATLD, KNCV, RIT, WHO, External Quality Assessment for AFB Smear
Microscopy, October 2003
21
Proficiency Performance Indicators
Evaluate proficiency testing
performance
AFB smear microscopy
Culture
Drug Susceptibility Testing
22
Importance of Monitoring EQA and PT
Performance
 EQA and PT programs should ideally
address AFB microscopy, specimen
processing, identification methods,
susceptibility testing
 Lends credibility to lab results
 Identifies training needs within the staff
23
EQA and Proficiency Testing
Performance
 Expectation: Predetermined by the testing
authority
 Unsatisfactory scores may be due to:
-Recent changes in staff
-Need for re-training staff
-Problems with equipment, reagents,
procedures
-Problems with the proficiency panel
24
Quality improvement
 Quality improvement (QI)
 A process by which the components of diagnostic
services are analyzed with the aim of looking for
ways to permanently remove obstacles to success.
Data collection, data analysis, and creative problem
solving are the key components of this process. It
involves continued monitoring, identifying defects,
followed by remedial action including retraining when
needed, to prevent recurrence of problems. QI often
relies on effective on-site evaluation visits.
Reference: APHL, CDC, IUATLD, KNCV, RIT, WHO, External Quality Assessment for
AFB Smear Microscopy, October 2003
25
Importance of Performance
Indicators
 Establishes “normal” laboratory values/baseline
for a given population or geographic region
 Identifies potential problems with pre-analytical,
analytical, post-analytical phase of testing
 Lends credibility to laboratory results
 Ensures optimization of laboratory methods
 Identifies potential training needs
26
Approach to Evaluating
Performance Indicators
 Direct observation of microbiologists
 Review of the following
 Laboratory Information System (LIMS)
 AFB microscopy register
 Culture worksheets
 Final results
 EQA or other PT results
 Procedure manuals
27
Performance Indicators
 Recovery rate of MTB
 Percentage of MTB / total number of specimens
 Percentage of specimens reported as smear positive
 distribution of smear grades (actual/scanty, 1+,2+, 3+)
 Correlation between positive smears and positive
cultures
 Percentage of negative smears resulting in positive
cultures
 Contamination rate (specimen, solid, liquid)
 Turn around time of AFB smear, culture and DST
results
 Proficiency testing performance (AFB microscopy,
culture, drug susceptibility testing)
28
Importance of Monitoring MTB
Recovery Rate
 Establishes a baseline for a given
population or geographic area
 Assists in identifying potential false
positive or false negative cultures (MTB)
29
Percentage of cultures reported as
MTBC (recovery rate Indicator)
 Collect 12 -14 months of data
 Number of MTBC isolates in 1 month /
Total number of cultures reported in 1
month
 Calculate each month
 Collect data from TB lab notebook / LIS
 Establish an acceptable recovery rate of
MTBC with in a given province/ district
 Trigger to investigate problems if significantly higher or lower
than usual
30
Importance of Monitoring Smear Positivity Rate,
Distribution of Smear Positivity Grade, and Smear and
Culture Correlation
 Establishes a baseline for a given facility,
population, or geographic region
 Represents the type of specimens submitted
(diagnostic vs. follow up)
 Identifies potential problems with microscopy
 Smear grades 2+ or 3+
 No or very few actual or 1+ grades
 Identifies potential problems with specimen
processing/culture methods
31
Correlation Between Positive
Smear and Positive Culture
 Expectation: Majority correlate
 Less than 95% may be due to:
-Specimens submitted from patients on
treatment (initial vs. follow-up)
-Reporting of false positive smears
-Excessive decontamination procedures
-Stringent reagents
-Problems with media
-Problems with equipment
-Excessive contamination
32
Proportion of
Smear Negative / Culture Positives
 Expectation: Population/geographic
region/facility dependent
 Increases may be due to:
-Shift in patient population
-Suboptimal staining reagents
-Inadequate smear reading by staff
-Reporting of false positive cultures
33
Importance of Monitoring MTBC Recovery rates, Smear Positivity Rate,
Distribution of Smear Positivity Grade, and Smear and Culture Correlation
 Expectation: Population/geographic region/facility
dependent/seasonal
 Increases may be due to:
-Shift in patient population
-Cross contamination/false positives
-Contaminated reagents
-Specimens contaminated during collection
 Decreases may be due to:
-Shift in patient population
-Problems with specimen quality
-Problems with specimen processing/use of incompatible
processing methods
-Problems with equipment/media
-Increase in contamination
Importance of Monitoring Contamination
Rates
 May reflect problems with pre-analytical
phase of testing
 May reflect the technical proficiency of
the laboratory
 May identify training needs (field and
laboratory)
 Should ideally be stratified by media
type and by specimen
 Liquid
 Solid
35
Contamination rate calculations
Solid media and specimens
 Calculate monthly
 Collect data from TB lab notebook
or LIMS
 # contaminated LJ tubes / total #
inoculated LJ tubes
 Specimen contamination rate= all
media inoculated on specimen is
contaminated and reported as
contaminated
 Both LJ and specimen
contamination rates between 3-
5% are acceptable
Liquid media
 Calculate monthly
 Collect data from TB lab
notebook or LIMS
 # contaminated MGIT tubes /
total # inoculated MGIT tubes
 Acceptable contamination rate
is 5-10%
36
Contamination Rate
 Expectation: 3-5% for solid media and specimens, 5-10 % liquid
medium
 Increases (>5% LJ; >10% liquid medium) may be due to:
-Incomplete decontamination
-Suboptimal reagents
-Improper use of antibiotics (liquid)
-Improper collection, storage and transport
-Equipment (BSC, incubators, centrifuge)
-Need for re-training staff
-Changes in season
 Decreases (<3%) may be due to:
-Harsh decontamination procedures
-Stringent reagents
Importance of Monitoring Turn
Around Time
 Critical to patient management
 Breaks the chain of transmission
 Ensures laboratory procedures are
optimized
 Assists in identifying challenges with
laboratory workflow algorithms,
information systems and reporting
systems
38
Turn Around Time of Results
 Expectation:
 AFB smears: within 48 hours of specimen receipt of 80% of
specimens
 ID: laboratory/method dependent
 DST: laboratory/method dependent
 Delays may be attributed to:
 Batching specimens or isolates
 Use of conventional ID and DST methods
 Suboptimal use of technology
 Use of National or other Reference laboratory
 Transport delays
 Inadequate provision of supplies
 Lack of communication between client and lab
39
Limitations to Monitoring
Performance
 Difficult to evaluate “real time” performance
 Delays in specimen or isolate transport
 Lengthy incubation periods
 Conventional methods used for identification and
susceptibility testing
 Human resource constraints
 Paper based laboratory records
 Communication hurdles
 PT-bias
40
Summary Points
 A Quality Assurance Program consists of three
components; quality control (QC), external
quality assessment (EQA), and quality
improvement (QI)
 Quality control should be practical and
comprehensive
 Quality control is the responsibility of all
laboratory personnel
 Monitoring performance helps to establish
“normal” laboratory values, lends credibility
laboratory results, helps to identify training
needs among staff
41

Quality Assurance Qual Indicators.ppt

  • 1.
    Quality Assurance/Quality Indicators Contentadapted from standardized WHO, GLI, CDC and NHLS Training Materials for use by the African Centre for Integrated Laboratory Training, 2010 1
  • 2.
    Content Outline  The3 main components of a QA system and their importance  Adhere to the QC and EQA procedures  Quality Indicators 2
  • 3.
    Developing a QualityAssurance plan  Practical  Specific procedures are available for specific components of the plan  Ensure the following are addressed:  General laboratory systems  Pre-analytical phase of testing  Analytical phase of testing  Post-analytical phase of testing 3
  • 4.
    System designed toimprove: Reliability Efficiency Use Of laboratory services in order to achieve the required technical quality in laboratory diagnosis Quality assurance in mycobacteriology 4
  • 5.
    Quality Assurance Quality assurance(QA) is a system designed to continuously improve the reliability and efficiency of laboratory services. This system includes quality control, external quality assessment, and quality improvement. Reference: APHL, CDC, IUATLD, KNCV, RIT, WHO, External Quality Assessment for AFB Smear Microscopy, October 2003 5
  • 6.
    I- Quality Control Quality control (QC)  A systematic internal monitoring of working practices, technical procedures, equipment, and materials, including quality of stains. Reference: APHL, CDC, IUATLD, KNCV, RIT, WHO, External Quality Assessment for AFB Smear Microscopy, October 2003 6
  • 7.
    Quality Control shouldbe:  Practical  Workable  Comprehensive 7
  • 8.
    Quality Control  Processof effective and systematic monitoring of all laboratory activities  Establish limits of acceptable standard of test performance  Laboratory data should be accurate, reliable, reproducible, comparable QC is the responsibility of all laboratory personnel 8
  • 9.
    QC-General Laboratory Systems Laboratory arrangement  Human resources (training health control)  Laboratory Equipment  Collection and transport of specimens  Handling of specimens  Reagents and media  Culture procedures  Reporting of results 9
  • 10.
    QC - Laboratoryarrangement  Ensure that doors in the laboratory are always closed.  Work areas, equipment and supplies arranged for logical and efficient work flow.  Work areas should be clean  Benches swabbed after each use with an appropriate disinfectant 10
  • 11.
    QC - LaboratoryArrangement and Administration  Schedule of tests  Every procedure is written  Keep written procedures in the laboratory for easy reference  Any changes must be dated and initialised by the laboratory supervisor  Records retained for two years  Management of procurements  Equipment/ consumables acceptance  Laboratory procedures used routinely should be SOPs, published in reputable microbiological books, manuals or journals 11
  • 12.
    Human Resources  Documentedcredentials for staff  Organisational flow chart/organogram  Orientation  Training  New staff: at initial hire, again at 6 months  Existing staff: once per year  All training should be documented  Sufficient staff to support workload 12
  • 13.
    Pre-analytical systems  Instructionsto submitters  Appropriate specimens  Collection, transport procedures  Specimen monitoring requirements  Documentation of specimen quality  Specimen rejection policy  Test requests  Essential documentation (patient name, specimen source, diagnostic vs. follow-up, collection date)  Compared to specimen for consistency 13
  • 14.
    Analytical systems  Standardizedoperating procedures  Updated annually and/or more often as needed  Reviewed and initialed by staff annually  Retired procedures removed, labeled as “retired”, initialed and dated  Equipment calibration  Thermometers  Pipettes  Timers 14
  • 15.
    Analytical systems  Qualitycontrol procedures and corrective actions  Test procedures  Microscopy  Processing and culture methods  Identification/susceptibility testing  Media and reagents  Sterility checks/performance characteristics  Labeling/storage (name, conc., temp.)  Dated (received/prepared, in use, expired)  Equipment (also includes preventive maintenance)  Centrifuge  Incubator, waterbaths, etc.  Safety cabinets  Refrigerators/freezers  Culture instruments 15
  • 16.
    Analytical systems  Validationof new methods/procedures  All new methods are evaluated against the reference/gold standard for  Sensitivity-proportion of true positives correctly identified by the test  Specificity – proportion of true negatives correctly identified by the test  Positive predictive value  Negative predictive value  Turn around time 16
  • 17.
    Corrective actions  Identify(potential) problem  Analyze the (potential) problem  Identify the (potential) solution  Select and plan solution  Implement solution  Evaluate solution  Maintain and/or improve solution Reference: Corrective and preventive action document. SANAS (South African National Accreditation System) 17
  • 18.
    Corrective actions: example Identify (potential) problem: suboptimal or poor quality media [LJ]  Analyze the (potential) problem: poor quality media may impact the yield/recovery of MTBC, lack of media may impact turn around time  Identify the (potential) solution: potential solutions include purchasing commercially prepared media, or asking for assistance from the NRL  Select and plan solution: gather catalog and vendor information or contact NRL to establish relationship and determine the feasibility of this option  Implement solution  Evaluate solution: determine the cost effectiveness of the solution, the amount of lead time required to receive the media  Maintain and/or improve solution Reference: Corrective and preventive action document. SANAS (South African National Accreditation System) 18
  • 19.
    Post-analytical systems  Validationof test results  Review of positive and/or negative results by supervisor/lead microbiologist  Routine monitoring of performance (performance indicators)  Results audit  Monitoring of turn around time for smear, culture, drug susceptibility results  Procedure for the delivery of timely positive results 19
  • 20.
    Keys to SuccessfulQuality Control  Adequately trained, interested and committed staff  Common-sense use of practical procedures  A willingness to admit and rectify mistakes  Effective communication 20
  • 21.
    External Quality Assurance External Quality Assurance (EQA)  A process which allows participant laboratories to assess their capabilities by comparing their results with those in other laboratories in the network (intermediate and central laboratory) through panel testing and blinded rechecking. EQA also includes on-site evaluation of the laboratory to review quality of performance and should include on-site re-reading of smears. EQA is an expansion of the proficiency testing as described by IUATLD. Reference: APHL, CDC, IUATLD, KNCV, RIT, WHO, External Quality Assessment for AFB Smear Microscopy, October 2003 21
  • 22.
    Proficiency Performance Indicators Evaluateproficiency testing performance AFB smear microscopy Culture Drug Susceptibility Testing 22
  • 23.
    Importance of MonitoringEQA and PT Performance  EQA and PT programs should ideally address AFB microscopy, specimen processing, identification methods, susceptibility testing  Lends credibility to lab results  Identifies training needs within the staff 23
  • 24.
    EQA and ProficiencyTesting Performance  Expectation: Predetermined by the testing authority  Unsatisfactory scores may be due to: -Recent changes in staff -Need for re-training staff -Problems with equipment, reagents, procedures -Problems with the proficiency panel 24
  • 25.
    Quality improvement  Qualityimprovement (QI)  A process by which the components of diagnostic services are analyzed with the aim of looking for ways to permanently remove obstacles to success. Data collection, data analysis, and creative problem solving are the key components of this process. It involves continued monitoring, identifying defects, followed by remedial action including retraining when needed, to prevent recurrence of problems. QI often relies on effective on-site evaluation visits. Reference: APHL, CDC, IUATLD, KNCV, RIT, WHO, External Quality Assessment for AFB Smear Microscopy, October 2003 25
  • 26.
    Importance of Performance Indicators Establishes “normal” laboratory values/baseline for a given population or geographic region  Identifies potential problems with pre-analytical, analytical, post-analytical phase of testing  Lends credibility to laboratory results  Ensures optimization of laboratory methods  Identifies potential training needs 26
  • 27.
    Approach to Evaluating PerformanceIndicators  Direct observation of microbiologists  Review of the following  Laboratory Information System (LIMS)  AFB microscopy register  Culture worksheets  Final results  EQA or other PT results  Procedure manuals 27
  • 28.
    Performance Indicators  Recoveryrate of MTB  Percentage of MTB / total number of specimens  Percentage of specimens reported as smear positive  distribution of smear grades (actual/scanty, 1+,2+, 3+)  Correlation between positive smears and positive cultures  Percentage of negative smears resulting in positive cultures  Contamination rate (specimen, solid, liquid)  Turn around time of AFB smear, culture and DST results  Proficiency testing performance (AFB microscopy, culture, drug susceptibility testing) 28
  • 29.
    Importance of MonitoringMTB Recovery Rate  Establishes a baseline for a given population or geographic area  Assists in identifying potential false positive or false negative cultures (MTB) 29
  • 30.
    Percentage of culturesreported as MTBC (recovery rate Indicator)  Collect 12 -14 months of data  Number of MTBC isolates in 1 month / Total number of cultures reported in 1 month  Calculate each month  Collect data from TB lab notebook / LIS  Establish an acceptable recovery rate of MTBC with in a given province/ district  Trigger to investigate problems if significantly higher or lower than usual 30
  • 31.
    Importance of MonitoringSmear Positivity Rate, Distribution of Smear Positivity Grade, and Smear and Culture Correlation  Establishes a baseline for a given facility, population, or geographic region  Represents the type of specimens submitted (diagnostic vs. follow up)  Identifies potential problems with microscopy  Smear grades 2+ or 3+  No or very few actual or 1+ grades  Identifies potential problems with specimen processing/culture methods 31
  • 32.
    Correlation Between Positive Smearand Positive Culture  Expectation: Majority correlate  Less than 95% may be due to: -Specimens submitted from patients on treatment (initial vs. follow-up) -Reporting of false positive smears -Excessive decontamination procedures -Stringent reagents -Problems with media -Problems with equipment -Excessive contamination 32
  • 33.
    Proportion of Smear Negative/ Culture Positives  Expectation: Population/geographic region/facility dependent  Increases may be due to: -Shift in patient population -Suboptimal staining reagents -Inadequate smear reading by staff -Reporting of false positive cultures 33
  • 34.
    Importance of MonitoringMTBC Recovery rates, Smear Positivity Rate, Distribution of Smear Positivity Grade, and Smear and Culture Correlation  Expectation: Population/geographic region/facility dependent/seasonal  Increases may be due to: -Shift in patient population -Cross contamination/false positives -Contaminated reagents -Specimens contaminated during collection  Decreases may be due to: -Shift in patient population -Problems with specimen quality -Problems with specimen processing/use of incompatible processing methods -Problems with equipment/media -Increase in contamination
  • 35.
    Importance of MonitoringContamination Rates  May reflect problems with pre-analytical phase of testing  May reflect the technical proficiency of the laboratory  May identify training needs (field and laboratory)  Should ideally be stratified by media type and by specimen  Liquid  Solid 35
  • 36.
    Contamination rate calculations Solidmedia and specimens  Calculate monthly  Collect data from TB lab notebook or LIMS  # contaminated LJ tubes / total # inoculated LJ tubes  Specimen contamination rate= all media inoculated on specimen is contaminated and reported as contaminated  Both LJ and specimen contamination rates between 3- 5% are acceptable Liquid media  Calculate monthly  Collect data from TB lab notebook or LIMS  # contaminated MGIT tubes / total # inoculated MGIT tubes  Acceptable contamination rate is 5-10% 36
  • 37.
    Contamination Rate  Expectation:3-5% for solid media and specimens, 5-10 % liquid medium  Increases (>5% LJ; >10% liquid medium) may be due to: -Incomplete decontamination -Suboptimal reagents -Improper use of antibiotics (liquid) -Improper collection, storage and transport -Equipment (BSC, incubators, centrifuge) -Need for re-training staff -Changes in season  Decreases (<3%) may be due to: -Harsh decontamination procedures -Stringent reagents
  • 38.
    Importance of MonitoringTurn Around Time  Critical to patient management  Breaks the chain of transmission  Ensures laboratory procedures are optimized  Assists in identifying challenges with laboratory workflow algorithms, information systems and reporting systems 38
  • 39.
    Turn Around Timeof Results  Expectation:  AFB smears: within 48 hours of specimen receipt of 80% of specimens  ID: laboratory/method dependent  DST: laboratory/method dependent  Delays may be attributed to:  Batching specimens or isolates  Use of conventional ID and DST methods  Suboptimal use of technology  Use of National or other Reference laboratory  Transport delays  Inadequate provision of supplies  Lack of communication between client and lab 39
  • 40.
    Limitations to Monitoring Performance Difficult to evaluate “real time” performance  Delays in specimen or isolate transport  Lengthy incubation periods  Conventional methods used for identification and susceptibility testing  Human resource constraints  Paper based laboratory records  Communication hurdles  PT-bias 40
  • 41.
    Summary Points  AQuality Assurance Program consists of three components; quality control (QC), external quality assessment (EQA), and quality improvement (QI)  Quality control should be practical and comprehensive  Quality control is the responsibility of all laboratory personnel  Monitoring performance helps to establish “normal” laboratory values, lends credibility laboratory results, helps to identify training needs among staff 41