Downloaded 650 times
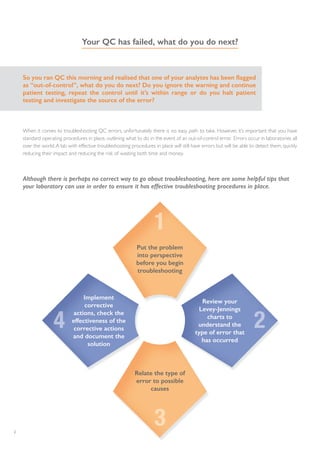
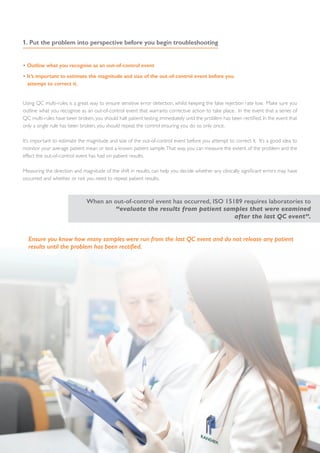

The document outlines essential steps for troubleshooting quality control (QC) errors in laboratory settings, emphasizing the need for standard operating procedures to effectively manage out-of-control events. It details the importance of analyzing Levey-Jennings charts to identify types of errors, implementing corrective actions based on identified causes, and documenting the outcomes to prevent future errors. Additionally, it recommends using QC multi-rules for sensitive error detection and highlights continuous monitoring practices to maintain laboratory performance.


