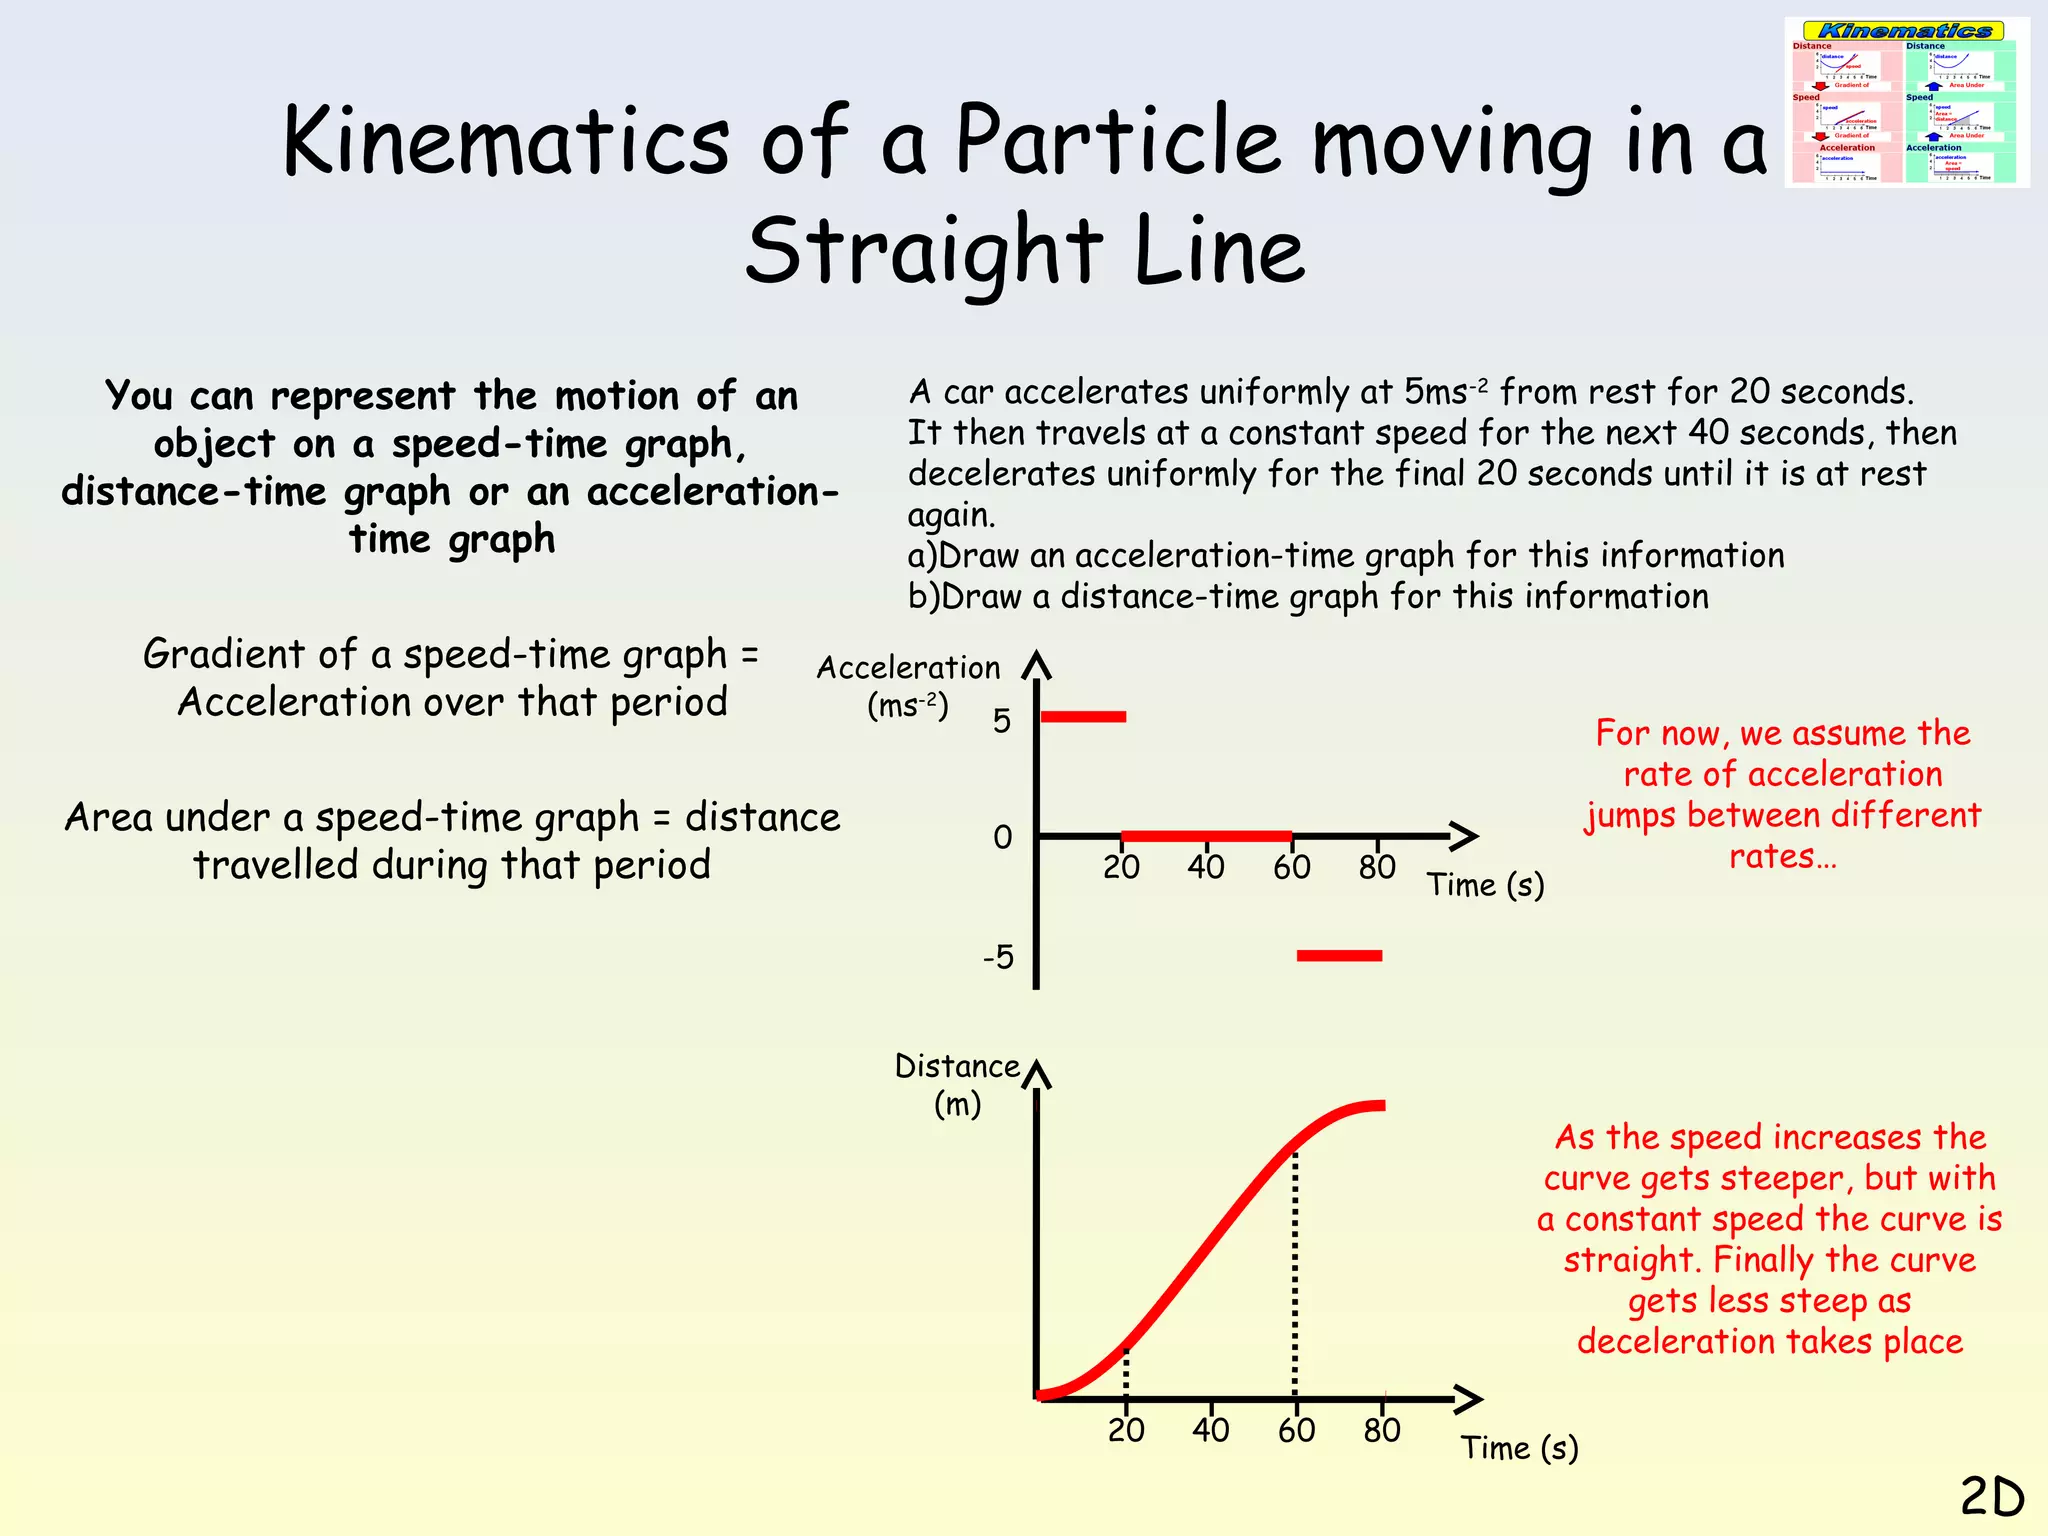
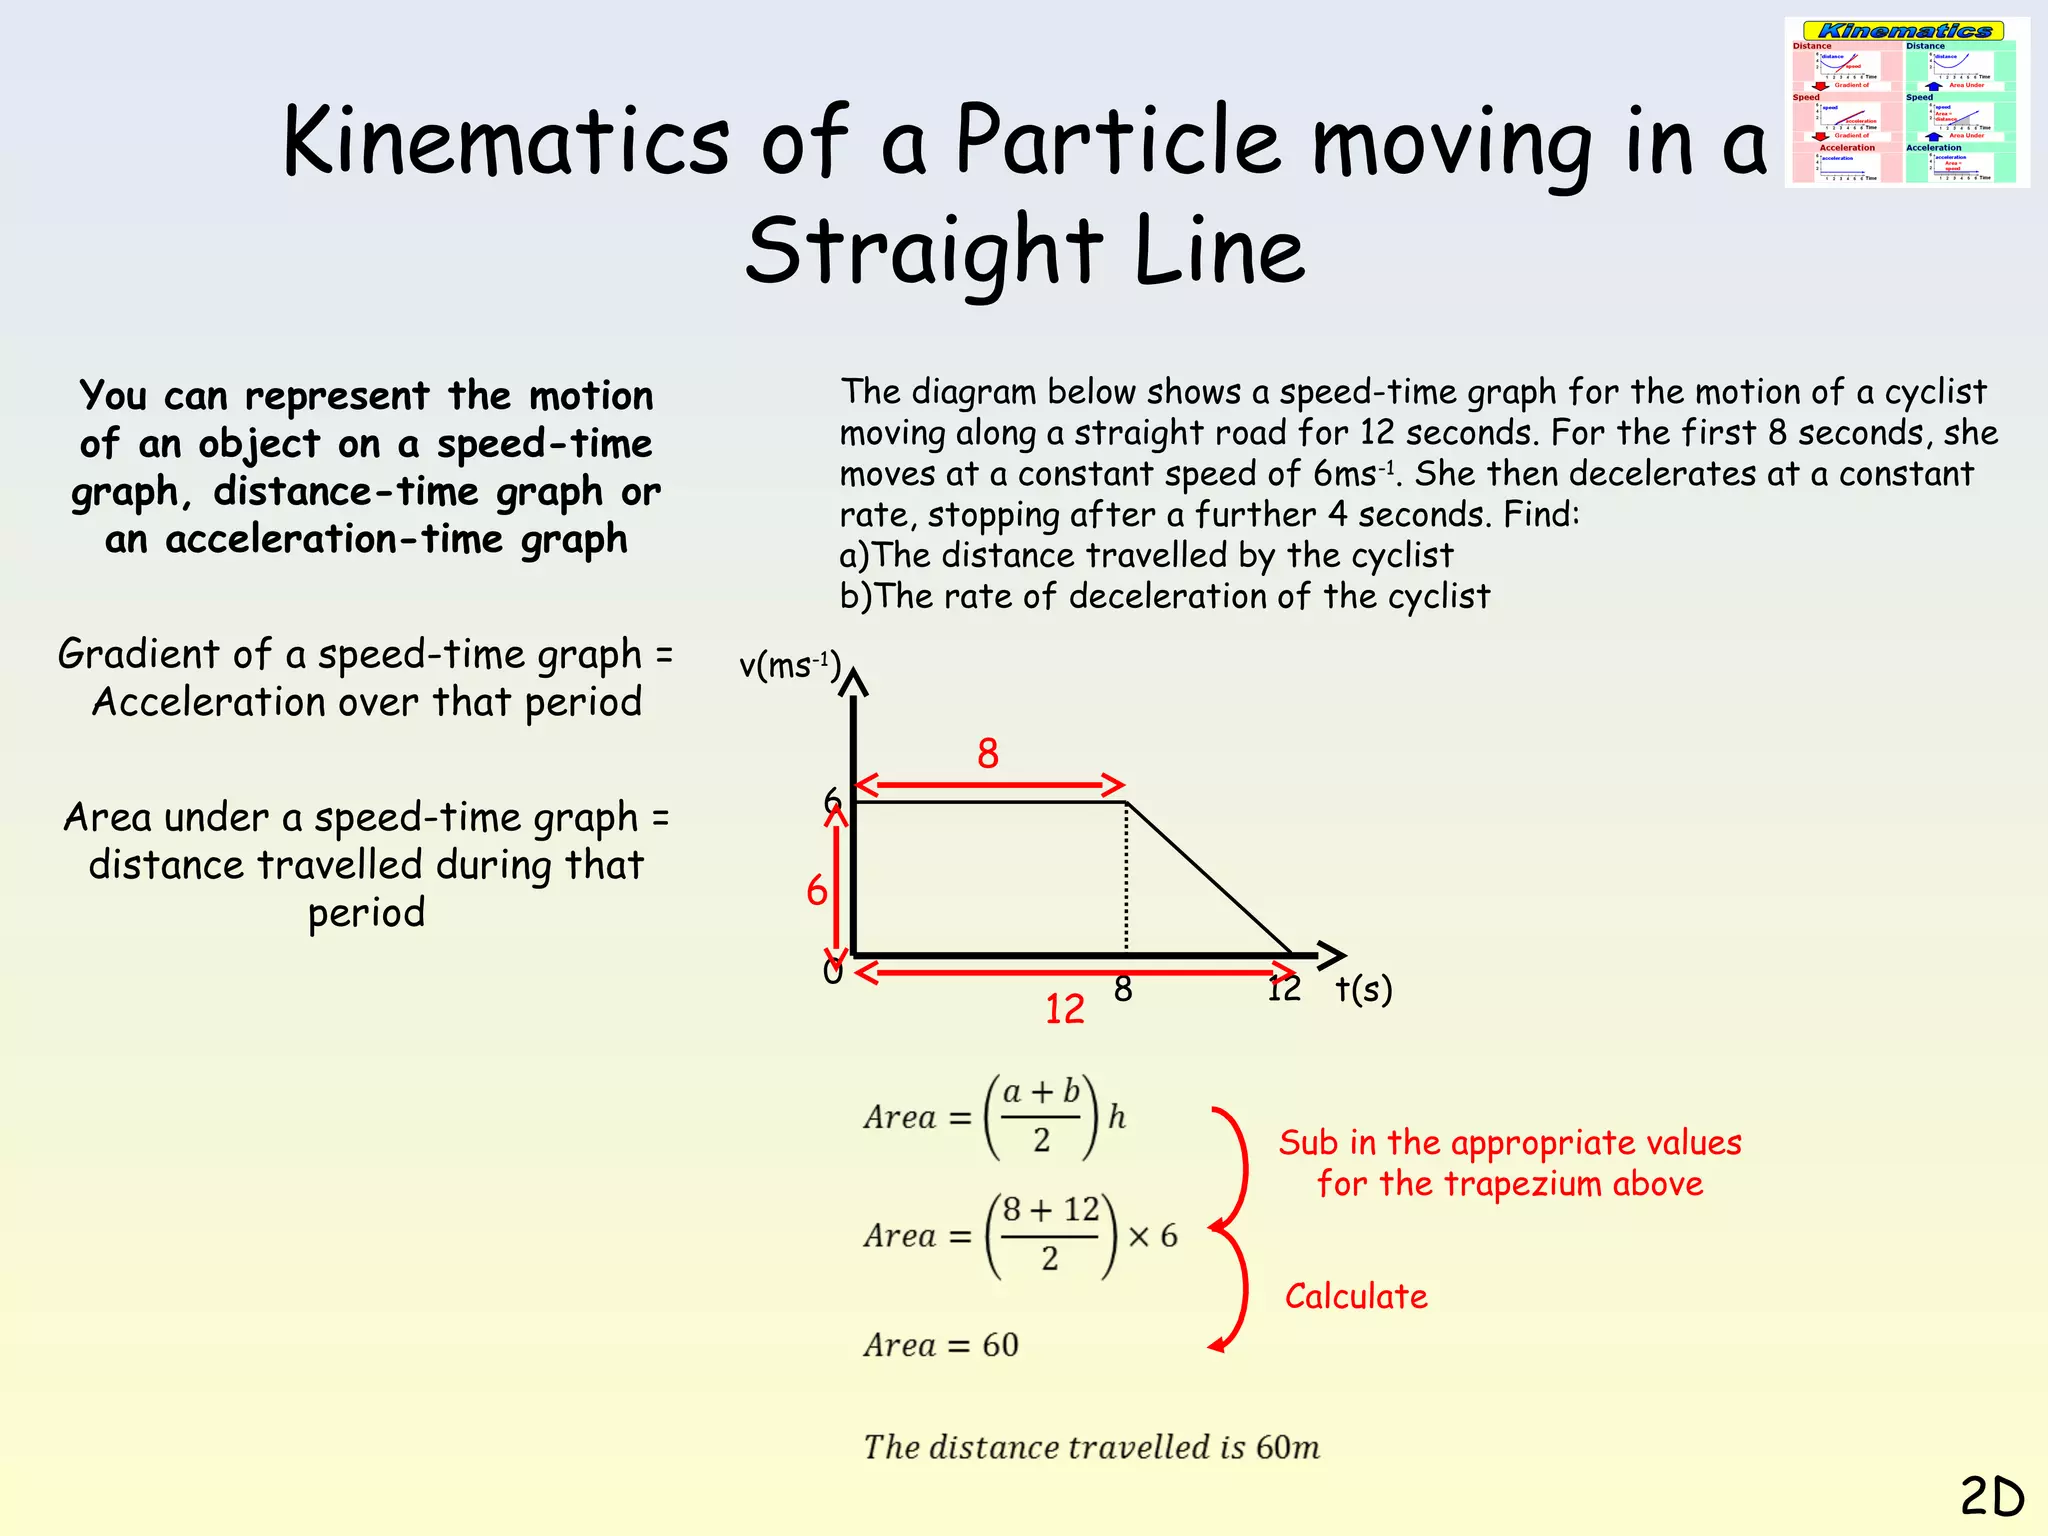
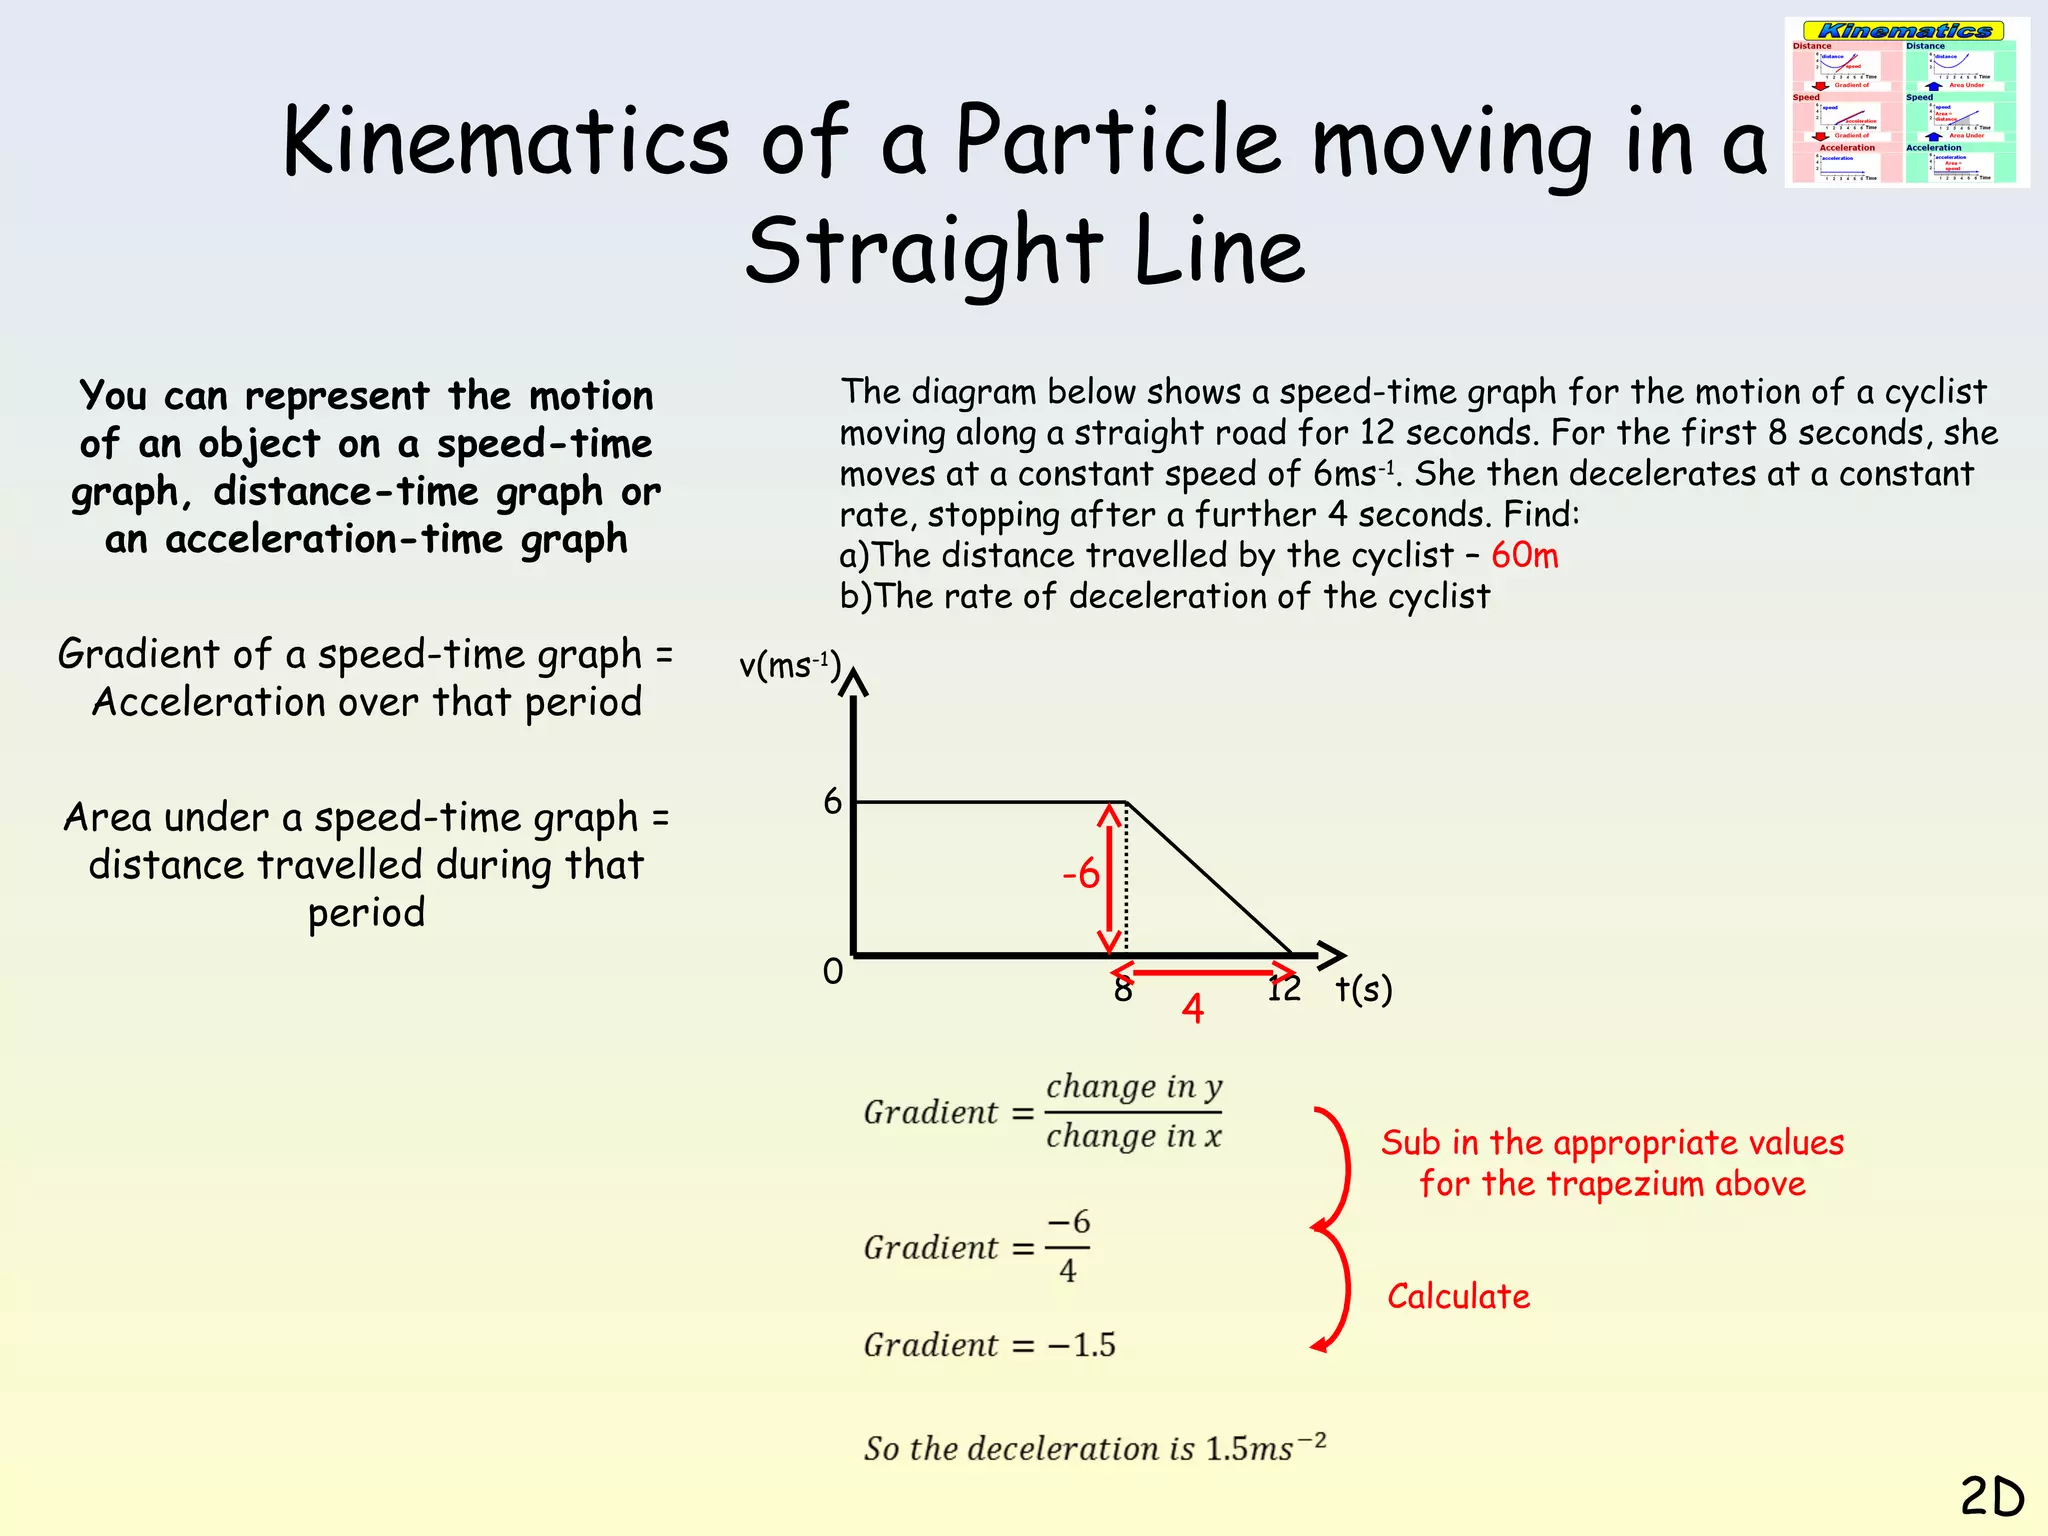
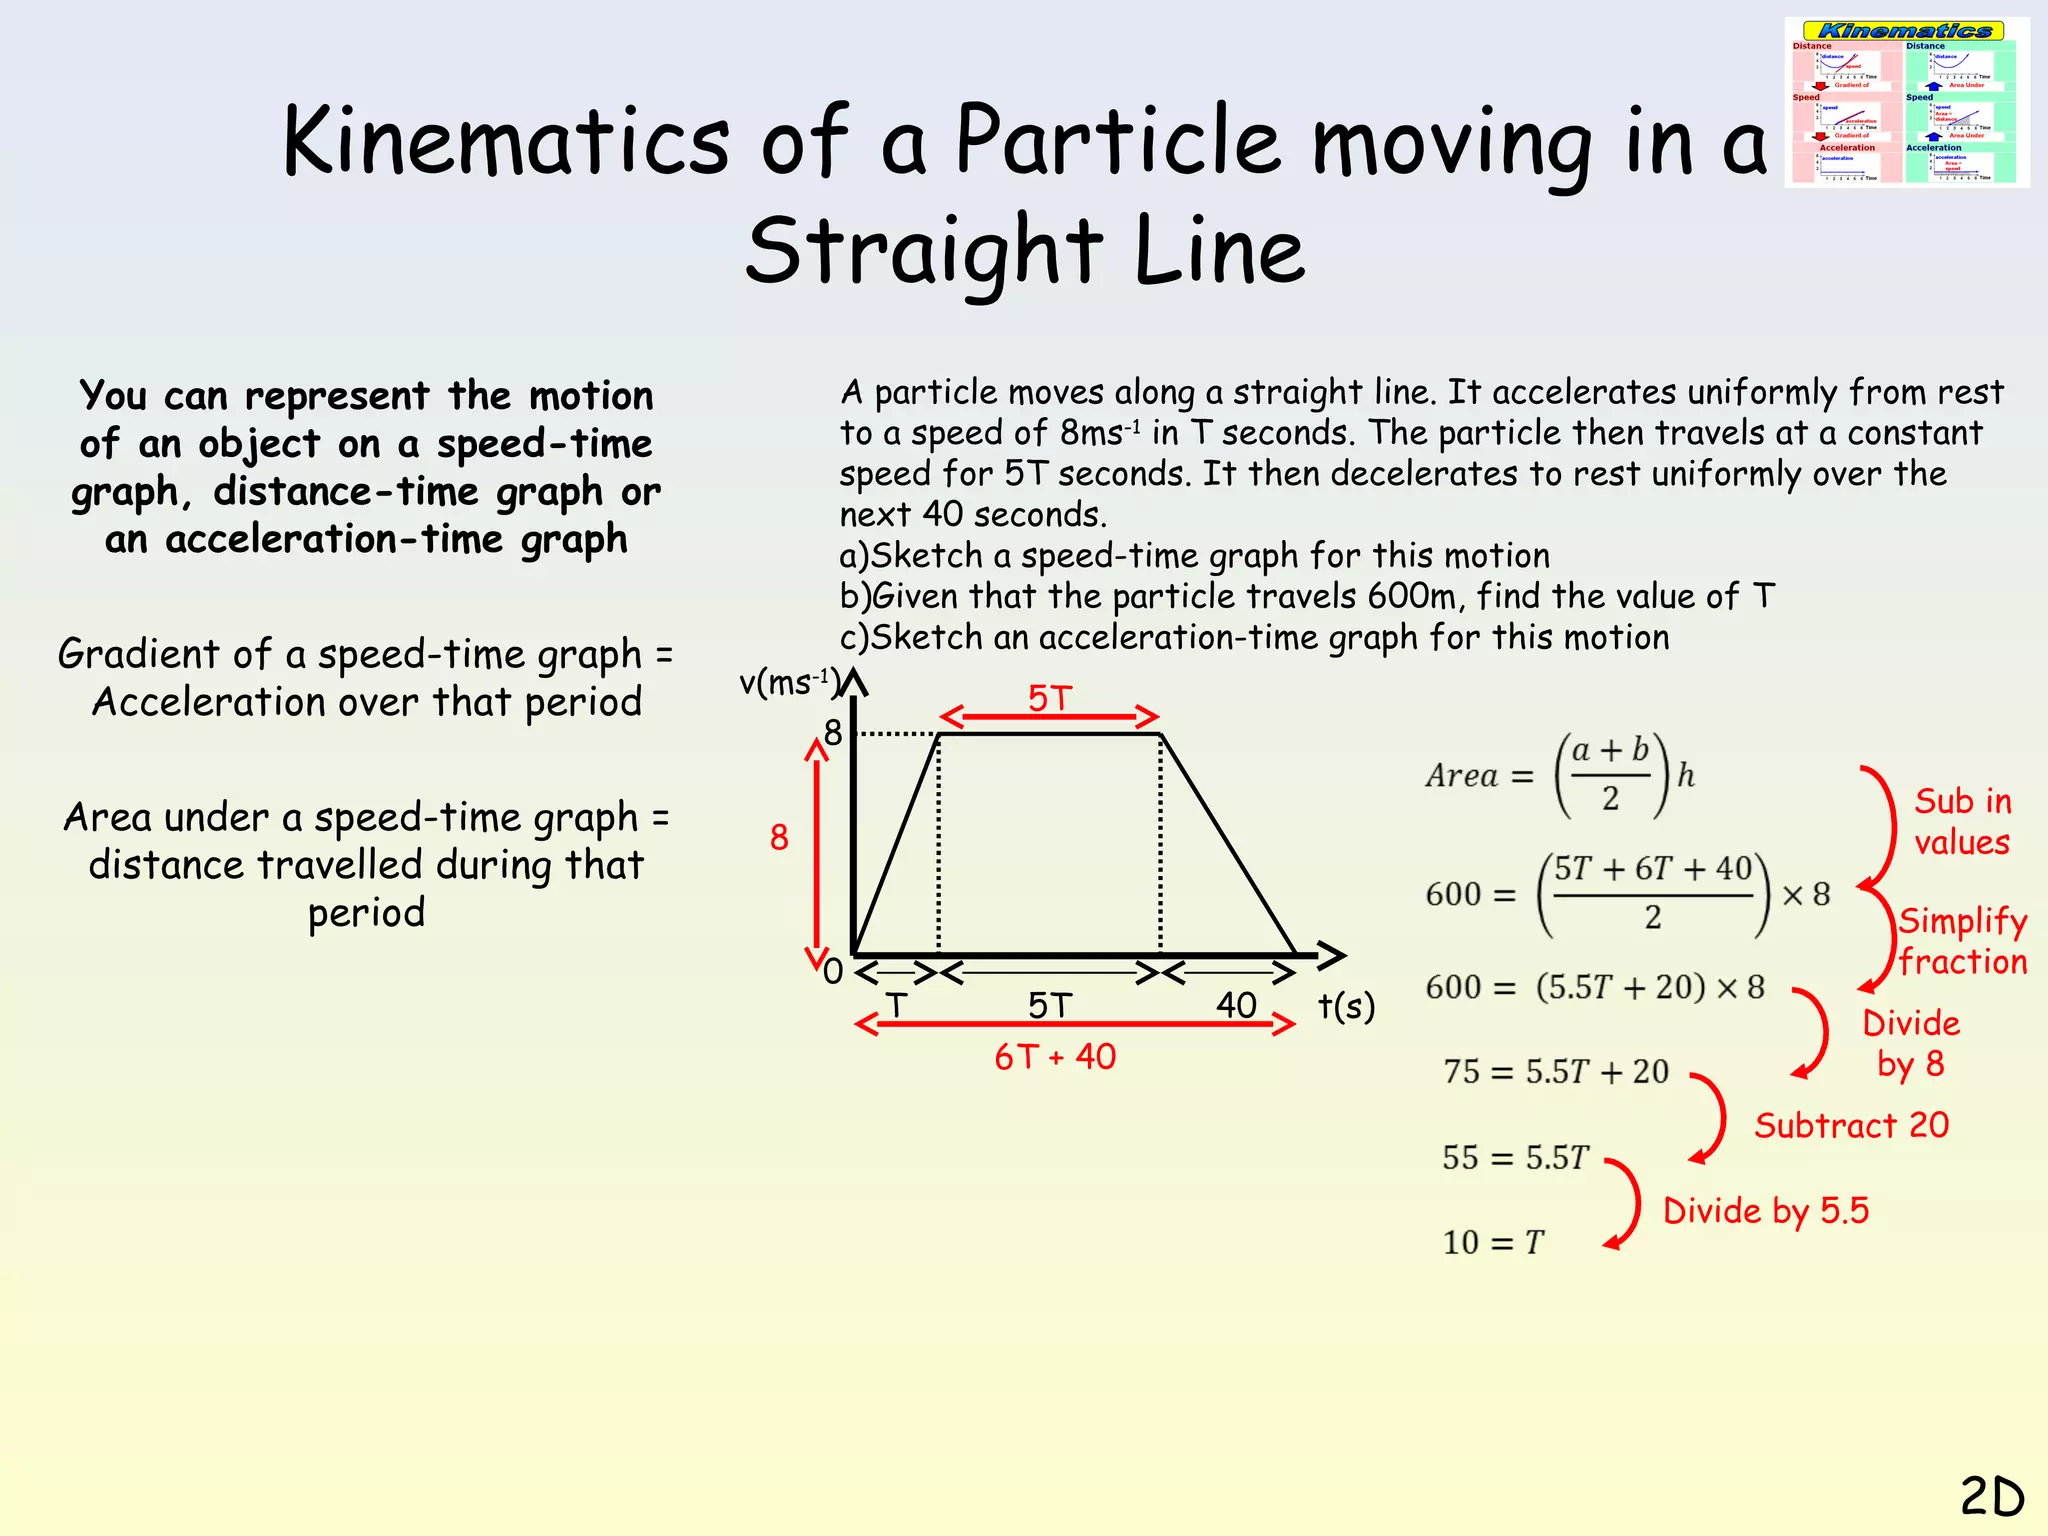
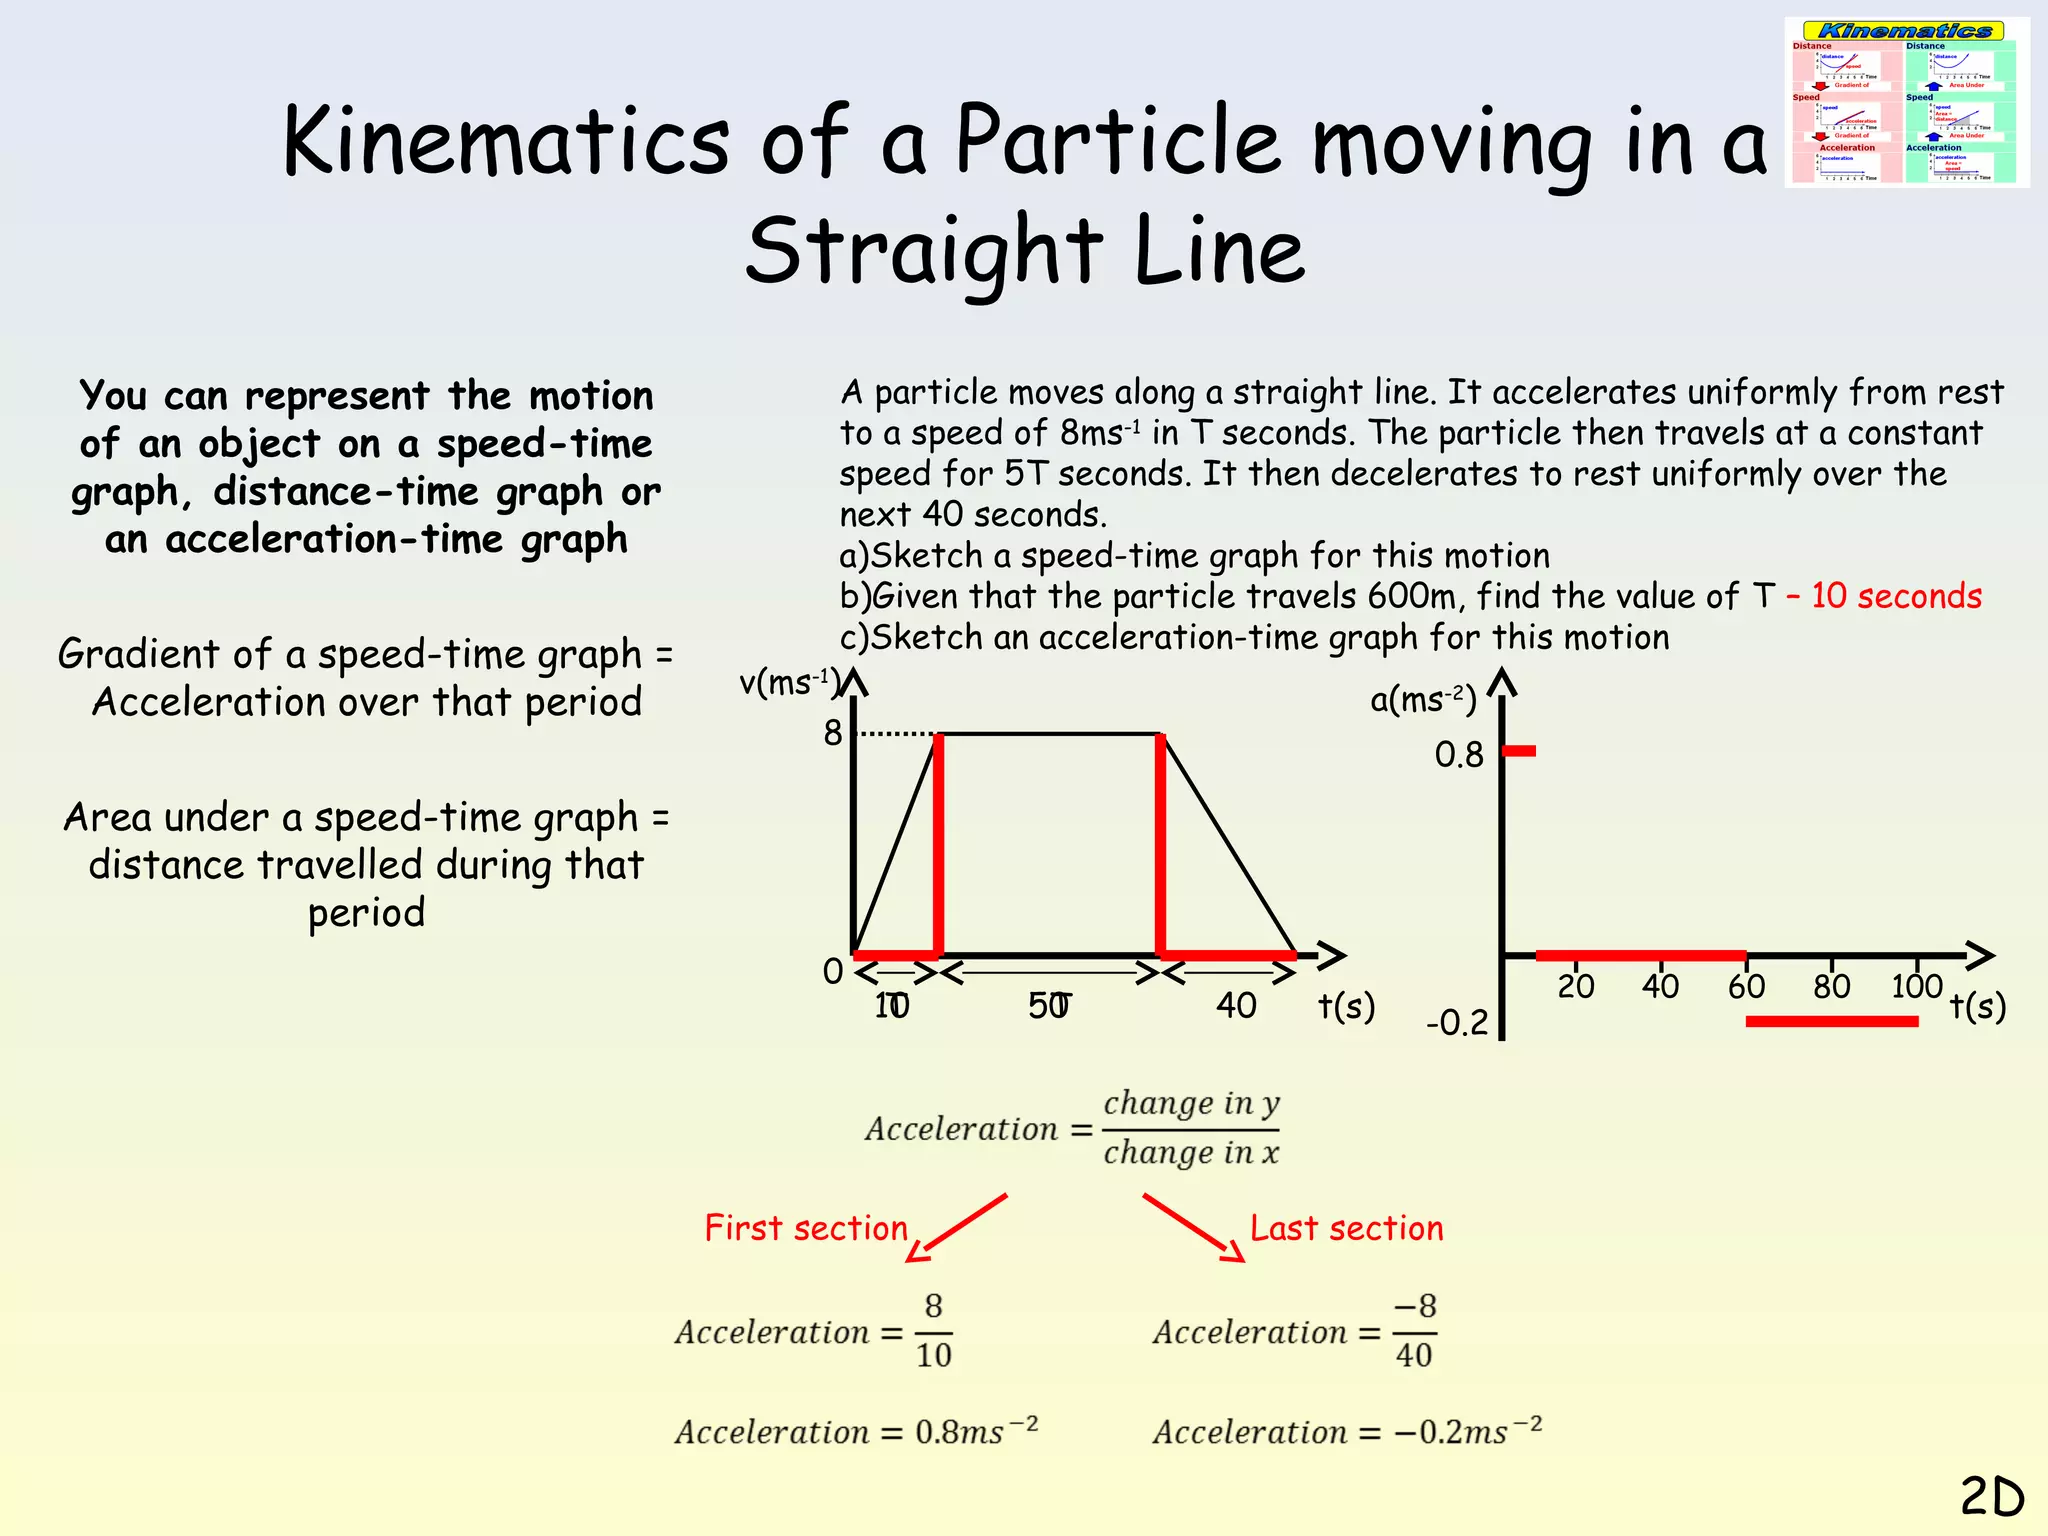
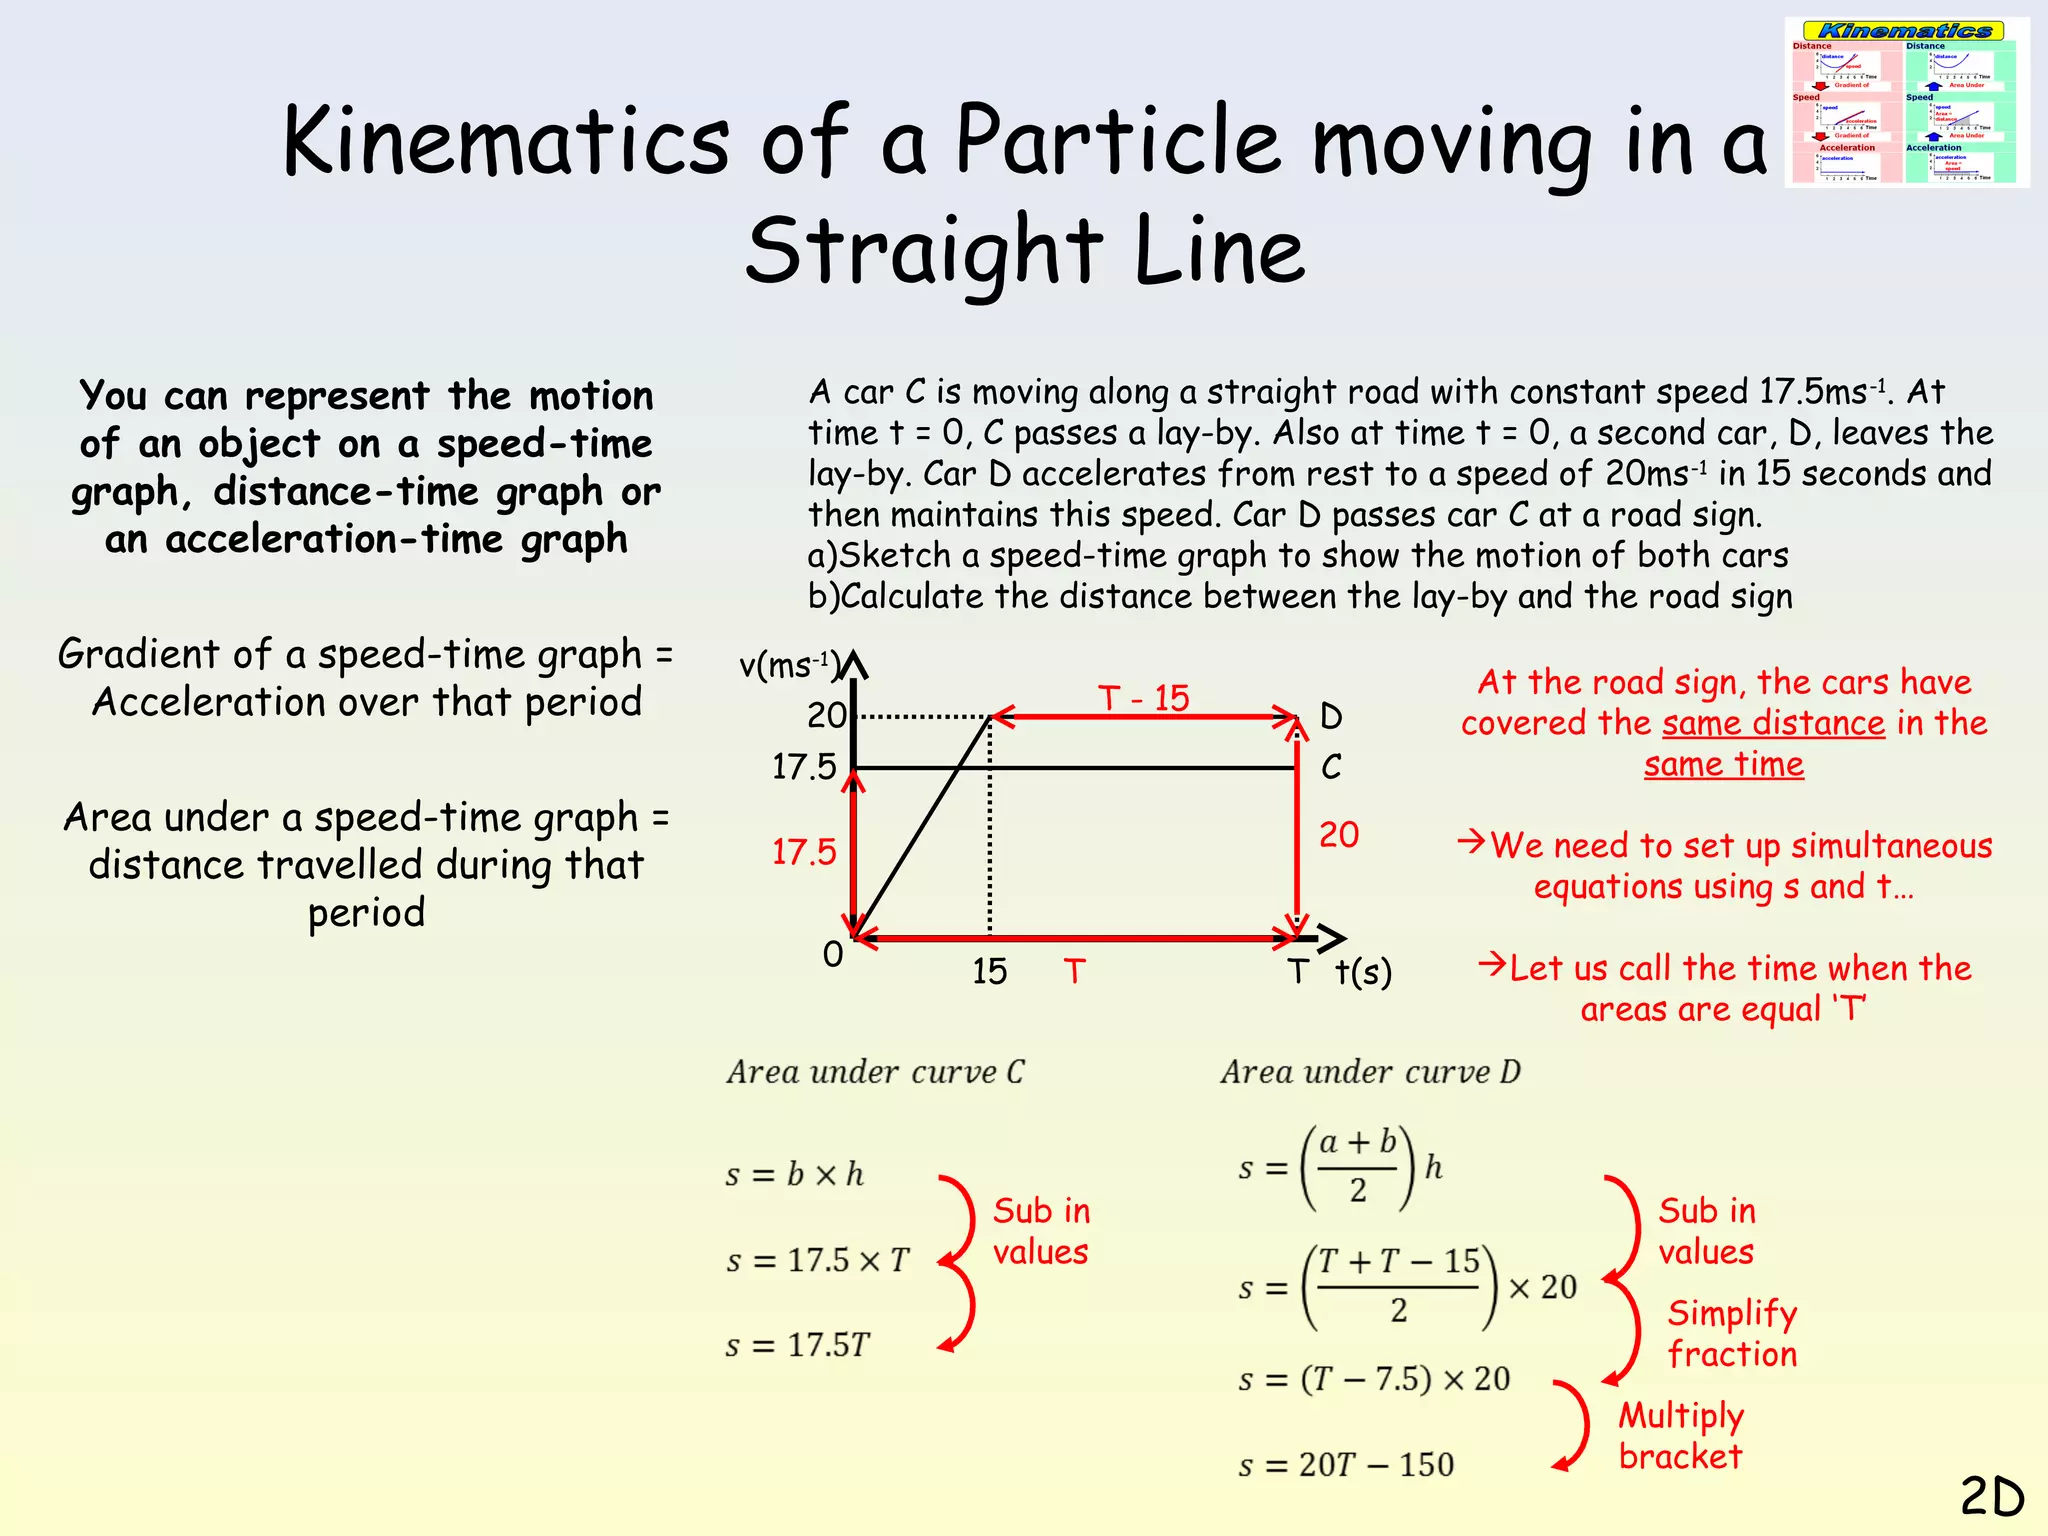
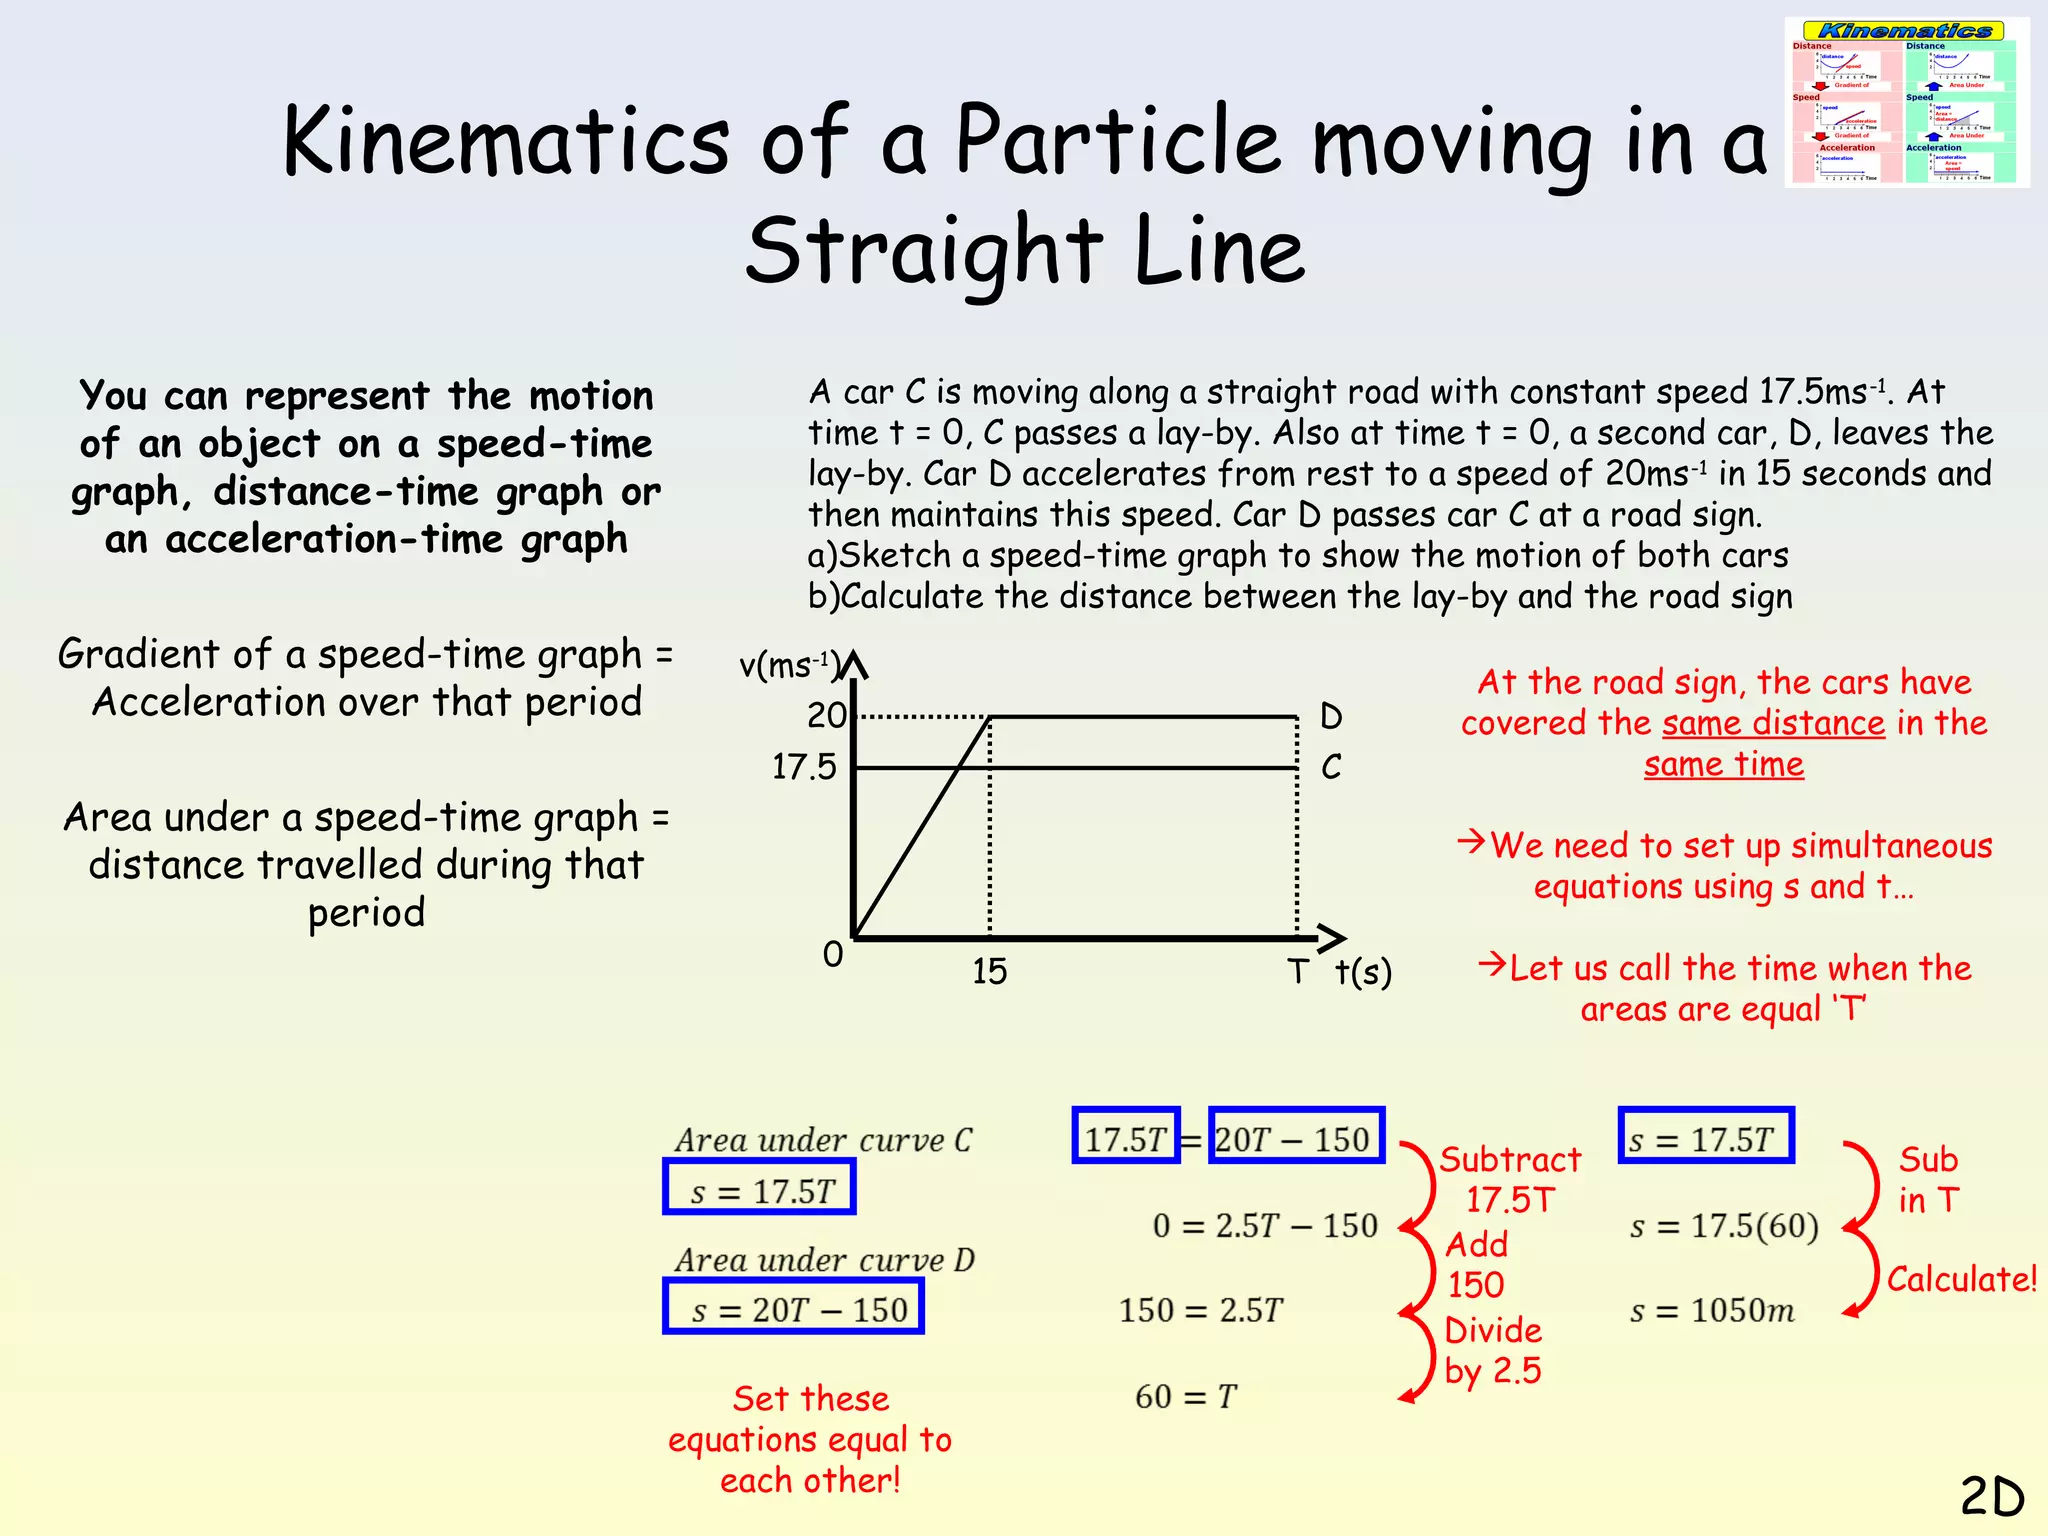
Kinematics of a Particle moving in a
Straight Line
You can represent the motion of an
object on a speed-time graph,
distance-time graph or an accelerationtime graph
Final velocity v
v-u
u

Initial velocity

v

t
u

O

On a speed-time graph,
the gradient of a section
is its acceleration!

t

On a speed-time graph,
the Area beneath it is
the distance covered!

t
Time taken

2D
Kinematics of a Particle moving in a
Straight Line
You can represent the motion of an
object on a speed-time graph,
distance-time graph or an accelerationtime graph
Gradient of a speed-time graph =
Acceleration over that period

A car accelerates uniformly at 5ms-2 from rest for 20 seconds.
It then travels at a constant speed for the next 40 seconds, then
decelerates uniformly for the final 20 seconds until it is at rest
again.
a)Draw an acceleration-time graph for this information
b)Draw a distance-time graph for this information

Acceleration
(ms-2)
5

Area under a speed-time graph = distance
travelled during that period

0

20

40

60

80

Time (s)

For now, we assume the
rate of acceleration
jumps between different
rates…

-5
Distance
(m)

As the speed increases the
curve gets steeper, but with
a constant speed the curve is
straight. Finally the curve
gets less steep as
deceleration takes place
20

40

60

80

Time (s)

2D
Kinematics of a Particle moving in a
Straight Line
You can represent the motion
of an object on a speed-time
graph, distance-time graph or
an acceleration-time graph

The diagram below shows a speed-time graph for the motion of a cyclist
moving along a straight road for 12 seconds. For the first 8 seconds, she
moves at a constant speed of 6ms-1. She then decelerates at a constant
rate, stopping after a further 4 seconds. Find:
a)The distance travelled by the cyclist
b)The rate of deceleration of the cyclist

Gradient of a speed-time graph =
Acceleration over that period

v(ms-1)

Area under a speed-time graph =
distance travelled during that
period

6

8

6
0

12

8

12 t(s)

Sub in the appropriate values
for the trapezium above
Calculate

2D
Kinematics of a Particle moving in a
Straight Line
You can represent the motion
of an object on a speed-time
graph, distance-time graph or
an acceleration-time graph

The diagram below shows a speed-time graph for the motion of a cyclist
moving along a straight road for 12 seconds. For the first 8 seconds, she
moves at a constant speed of 6ms-1. She then decelerates at a constant
rate, stopping after a further 4 seconds. Find:
a)The distance travelled by the cyclist – 60m
b)The rate of deceleration of the cyclist

Gradient of a speed-time graph =
Acceleration over that period

v(ms-1)

Area under a speed-time graph =
distance travelled during that
period

6

-6
0

8

4

12 t(s)

Sub in the appropriate values
for the trapezium above
Calculate

2D
Kinematics of a Particle moving in a
Straight Line
You can represent the motion
of an object on a speed-time
graph, distance-time graph or
an acceleration-time graph
Gradient of a speed-time graph =
Acceleration over that period
Area under a speed-time graph =
distance travelled during that
period

A particle moves along a straight line. It accelerates uniformly from rest
to a speed of 8ms-1 in T seconds. The particle then travels at a constant
speed for 5T seconds. It then decelerates to rest uniformly over the
next 40 seconds.
a)Sketch a speed-time graph for this motion
b)Given that the particle travels 600m, find the value of T
c)Sketch an acceleration-time graph for this motion
v(ms-1)
5T
8
Sub in
values

8

0

T

5T
6T + 40

40

t(s)

Simplify
fraction
Divide
by 8
Subtract 20
Divide by 5.5

2D
Kinematics of a Particle moving in a
Straight Line
You can represent the motion
of an object on a speed-time
graph, distance-time graph or
an acceleration-time graph
Gradient of a speed-time graph =
Acceleration over that period

A particle moves along a straight line. It accelerates uniformly from rest
to a speed of 8ms-1 in T seconds. The particle then travels at a constant
speed for 5T seconds. It then decelerates to rest uniformly over the
next 40 seconds.
a)Sketch a speed-time graph for this motion
b)Given that the particle travels 600m, find the value of T – 10 seconds
c)Sketch an acceleration-time graph for this motion
v(ms-1)
a(ms-2)
8
0.8

Area under a speed-time graph =
distance travelled during that
period
0

10
T

First section

50
5T

40

t(s)

-0.2

20

40

60

80

100

t(s)

Last section

2D
Kinematics of a Particle moving in a
Straight Line
You can represent the motion
of an object on a speed-time
graph, distance-time graph or
an acceleration-time graph
Gradient of a speed-time graph =
Acceleration over that period
Area under a speed-time graph =
distance travelled during that
period

A car C is moving along a straight road with constant speed 17.5ms -1. At
time t = 0, C passes a lay-by. Also at time t = 0, a second car, D, leaves the
lay-by. Car D accelerates from rest to a speed of 20ms -1 in 15 seconds and
then maintains this speed. Car D passes car C at a road sign.
a)Sketch a speed-time graph to show the motion of both cars
b)Calculate the distance between the lay-by and the road sign
v(ms-1)
20
17.5

T - 15

At the road sign, the cars have
covered the same distance in the
same time

20

17.5
0

D
C

15

T

Sub in
values

We need to set up simultaneous
equations using s and t…

T t(s)

Let us call the time when the
areas are equal ‘T’

Sub in
values
Simplify
fraction
Multiply
bracket

2D
Kinematics of a Particle moving in a
Straight Line
You can represent the motion
of an object on a speed-time
graph, distance-time graph or
an acceleration-time graph

A car C is moving along a straight road with constant speed 17.5ms -1. At
time t = 0, C passes a lay-by. Also at time t = 0, a second car, D, leaves the
lay-by. Car D accelerates from rest to a speed of 20ms -1 in 15 seconds and
then maintains this speed. Car D passes car C at a road sign.
a)Sketch a speed-time graph to show the motion of both cars
b)Calculate the distance between the lay-by and the road sign

Gradient of a speed-time graph =
Acceleration over that period
Area under a speed-time graph =
distance travelled during that
period

v(ms-1)
20
17.5

D
C

At the road sign, the cars have
covered the same distance in the
same time
We need to set up simultaneous
equations using s and t…

0

Set these
equations equal to
each other!

15

T t(s)

Let us call the time when the
areas are equal ‘T’

Subtract
17.5T
Add
150
Divide
by 2.5

Sub
in T
Calculate!

2D

Kinematics displacement velocity graphs

  • 2.
    Kinematics of aParticle moving in a Straight Line You can represent the motion of an object on a speed-time graph, distance-time graph or an accelerationtime graph Final velocity v v-u u Initial velocity v t u O On a speed-time graph, the gradient of a section is its acceleration! t On a speed-time graph, the Area beneath it is the distance covered! t Time taken 2D
  • 3.
    Kinematics of aParticle moving in a Straight Line You can represent the motion of an object on a speed-time graph, distance-time graph or an accelerationtime graph Gradient of a speed-time graph = Acceleration over that period A car accelerates uniformly at 5ms-2 from rest for 20 seconds. It then travels at a constant speed for the next 40 seconds, then decelerates uniformly for the final 20 seconds until it is at rest again. a)Draw an acceleration-time graph for this information b)Draw a distance-time graph for this information Acceleration (ms-2) 5 Area under a speed-time graph = distance travelled during that period 0 20 40 60 80 Time (s) For now, we assume the rate of acceleration jumps between different rates… -5 Distance (m) As the speed increases the curve gets steeper, but with a constant speed the curve is straight. Finally the curve gets less steep as deceleration takes place 20 40 60 80 Time (s) 2D
  • 4.
    Kinematics of aParticle moving in a Straight Line You can represent the motion of an object on a speed-time graph, distance-time graph or an acceleration-time graph The diagram below shows a speed-time graph for the motion of a cyclist moving along a straight road for 12 seconds. For the first 8 seconds, she moves at a constant speed of 6ms-1. She then decelerates at a constant rate, stopping after a further 4 seconds. Find: a)The distance travelled by the cyclist b)The rate of deceleration of the cyclist Gradient of a speed-time graph = Acceleration over that period v(ms-1) Area under a speed-time graph = distance travelled during that period 6 8 6 0 12 8 12 t(s) Sub in the appropriate values for the trapezium above Calculate 2D
  • 5.
    Kinematics of aParticle moving in a Straight Line You can represent the motion of an object on a speed-time graph, distance-time graph or an acceleration-time graph The diagram below shows a speed-time graph for the motion of a cyclist moving along a straight road for 12 seconds. For the first 8 seconds, she moves at a constant speed of 6ms-1. She then decelerates at a constant rate, stopping after a further 4 seconds. Find: a)The distance travelled by the cyclist – 60m b)The rate of deceleration of the cyclist Gradient of a speed-time graph = Acceleration over that period v(ms-1) Area under a speed-time graph = distance travelled during that period 6 -6 0 8 4 12 t(s) Sub in the appropriate values for the trapezium above Calculate 2D
  • 6.
    Kinematics of aParticle moving in a Straight Line You can represent the motion of an object on a speed-time graph, distance-time graph or an acceleration-time graph Gradient of a speed-time graph = Acceleration over that period Area under a speed-time graph = distance travelled during that period A particle moves along a straight line. It accelerates uniformly from rest to a speed of 8ms-1 in T seconds. The particle then travels at a constant speed for 5T seconds. It then decelerates to rest uniformly over the next 40 seconds. a)Sketch a speed-time graph for this motion b)Given that the particle travels 600m, find the value of T c)Sketch an acceleration-time graph for this motion v(ms-1) 5T 8 Sub in values 8 0 T 5T 6T + 40 40 t(s) Simplify fraction Divide by 8 Subtract 20 Divide by 5.5 2D
  • 7.
    Kinematics of aParticle moving in a Straight Line You can represent the motion of an object on a speed-time graph, distance-time graph or an acceleration-time graph Gradient of a speed-time graph = Acceleration over that period A particle moves along a straight line. It accelerates uniformly from rest to a speed of 8ms-1 in T seconds. The particle then travels at a constant speed for 5T seconds. It then decelerates to rest uniformly over the next 40 seconds. a)Sketch a speed-time graph for this motion b)Given that the particle travels 600m, find the value of T – 10 seconds c)Sketch an acceleration-time graph for this motion v(ms-1) a(ms-2) 8 0.8 Area under a speed-time graph = distance travelled during that period 0 10 T First section 50 5T 40 t(s) -0.2 20 40 60 80 100 t(s) Last section 2D
  • 8.
    Kinematics of aParticle moving in a Straight Line You can represent the motion of an object on a speed-time graph, distance-time graph or an acceleration-time graph Gradient of a speed-time graph = Acceleration over that period Area under a speed-time graph = distance travelled during that period A car C is moving along a straight road with constant speed 17.5ms -1. At time t = 0, C passes a lay-by. Also at time t = 0, a second car, D, leaves the lay-by. Car D accelerates from rest to a speed of 20ms -1 in 15 seconds and then maintains this speed. Car D passes car C at a road sign. a)Sketch a speed-time graph to show the motion of both cars b)Calculate the distance between the lay-by and the road sign v(ms-1) 20 17.5 T - 15 At the road sign, the cars have covered the same distance in the same time 20 17.5 0 D C 15 T Sub in values We need to set up simultaneous equations using s and t… T t(s) Let us call the time when the areas are equal ‘T’ Sub in values Simplify fraction Multiply bracket 2D
  • 9.
    Kinematics of aParticle moving in a Straight Line You can represent the motion of an object on a speed-time graph, distance-time graph or an acceleration-time graph A car C is moving along a straight road with constant speed 17.5ms -1. At time t = 0, C passes a lay-by. Also at time t = 0, a second car, D, leaves the lay-by. Car D accelerates from rest to a speed of 20ms -1 in 15 seconds and then maintains this speed. Car D passes car C at a road sign. a)Sketch a speed-time graph to show the motion of both cars b)Calculate the distance between the lay-by and the road sign Gradient of a speed-time graph = Acceleration over that period Area under a speed-time graph = distance travelled during that period v(ms-1) 20 17.5 D C At the road sign, the cars have covered the same distance in the same time We need to set up simultaneous equations using s and t… 0 Set these equations equal to each other! 15 T t(s) Let us call the time when the areas are equal ‘T’ Subtract 17.5T Add 150 Divide by 2.5 Sub in T Calculate! 2D
  • 10.
    Kinematics of aParticle moving in a Straight Line You can represent the motion of an object on a speed-time graph, distance-time graph or an acceleration-time graph A car C is moving along a straight road with constant speed 17.5ms -1. At time t = 0, C passes a lay-by. Also at time t = 0, a second car, D, leaves the lay-by. Car D accelerates from rest to a speed of 20ms -1 in 15 seconds and then maintains this speed. Car D passes car C at a road sign. a)Sketch a speed-time graph to show the motion of both cars b)Calculate the distance between the lay-by and the road sign Gradient of a speed-time graph = Acceleration over that period Area under a speed-time graph = distance travelled during that period v(ms-1) 20 17.5 D C At the road sign, the cars have covered the same distance in the same time We need to set up simultaneous equations using s and t… 0 Set these equations equal to each other! 15 T t(s) Let us call the time when the areas are equal ‘T’ Subtract 17.5T Add 150 Divide by 2.5 Sub in T Calculate! 2D