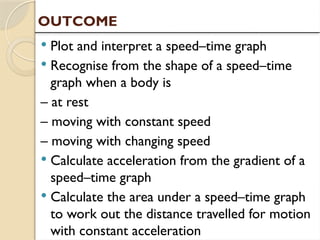
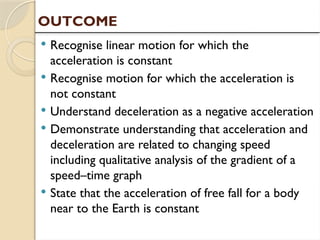
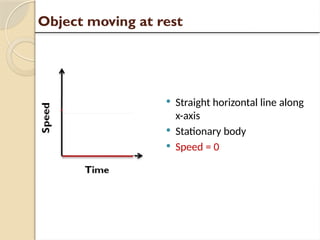
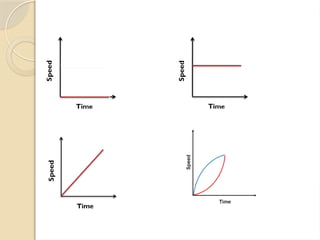
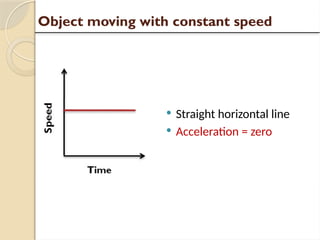
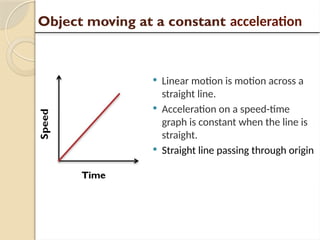
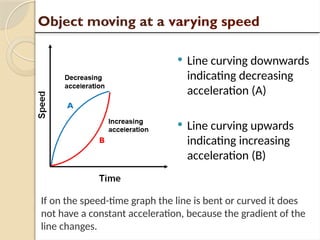
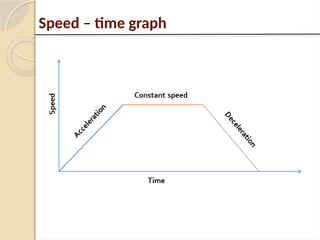
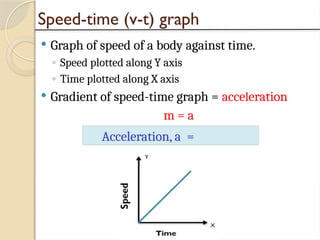
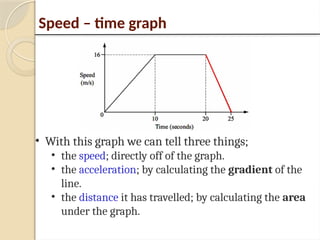
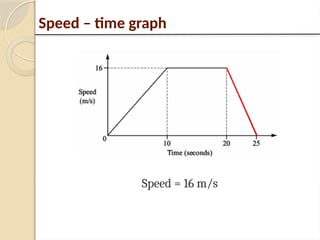
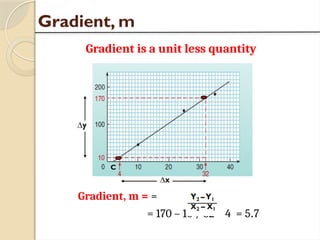
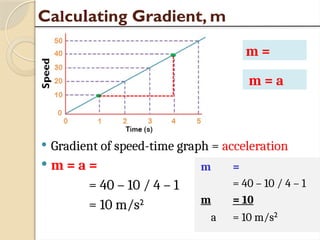
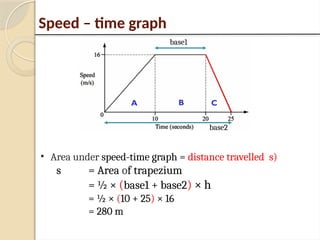
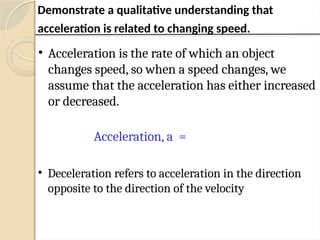
MOTION
SPEED-TIME GRAPH
 Plot and interpret a speed–time graph
 Recognise from the shape of a speed–time
graph when a body is
– at rest
– moving with constant speed
– moving with changing speed
 Calculate acceleration from the gradient of a
speed–time graph
 Calculate the area under a speed–time graph
to work out the distance travelled for motion
with constant acceleration
OUTCOME
 Recognise linear motion for which the
acceleration is constant
 Recognise motion for which the acceleration is
not constant
 Understand deceleration as a negative acceleration
 Demonstrate understanding that acceleration and
deceleration are related to changing speed
including qualitative analysis of the gradient of a
speed–time graph
 State that the acceleration of free fall for a body
near to the Earth is constant
OUTCOME
 Straight horizontal line along
x-axis
 Stationary body
 Speed = 0
Object moving at rest
 Straight horizontal line
 Acceleration = zero
Object moving with constant speed
 Linear motion is motion across a
straight line.
 Acceleration on a speed-time
graph is constant when the line is
straight.
 Straight line passing through origin
Object moving at a constant acceleration
 Line curving downwards
indicating decreasing
acceleration (A)
 Line curving upwards
indicating increasing
acceleration (B)
Object moving at a varying speed
A
B
If on the speed-time graph the line is bent or curved it does
not have a constant acceleration, because the gradient of the
line changes.
Speed – time graph
 Graph of speed of a body against time.
◦ Speed plotted along Y axis
◦ Time plotted along X axis
 Gradient of speed-time graph = acceleration
m = a
Speed-time (v-t) graph
Acceleration, a =
Speed – time graph
• With this graph we can tell three things;
• the speed; directly off of the graph.
• the acceleration; by calculating the gradient of the
line.
• the distance it has travelled; by calculating the area
under the graph.
Speed – time graph
Speed = 16 m/s
Gradient, m
Gradient is a unit less quantity
Gradient, m = =
= 170 – 10 / 32 – 4 = 5.7
Calculating Gradient, m
 Gradient of speed-time graph = acceleration
 m = a =
= 40 – 10 / 4 – 1
= 10 m/s2
m =
m =
= 40 – 10 / 4 – 1
m = 10
a = 10 m/s2
m = a
Distance travelled from Speed – time graph
• Area under speed-time graph = distance travelled (s)
s = A
= (½ × b × h) + (l × b) + (½ × b × h)
= (½ × 10 × 16) + (10 × 16) + (½ × 5 × 16)
= 80 + 160 + 40
= 280 m
A B C
Speed – time graph
• Area under speed-time graph = distance travelled s)
s = Area of trapezium
= ½ × (base1 + base2) × h
= ½ × (10 + 25) × 16
= 280 m
A B C
base1
base2
Demonstrate a qualitative understanding that
acceleration is related to changing speed.
• Acceleration is the rate of which an object
changes speed, so when a speed changes, we
assume that the acceleration has either increased
or decreased.
Acceleration, a =
• Deceleration refers to acceleration in the direction
opposite to the direction of the velocity
State that the acceleration of free fall for a body
near to the Earth is constant
• Acceleration is the rate of which an object
changes speed, so when a speed changes, we
assume that the acceleration has either increased
or decreased.
UNIT-1 Motion-Speed-time and distance - time graph.pptx

UNIT-1 Motion-Speed-time and distance - time graph.pptx

  • 1.
  • 2.
     Plot andinterpret a speed–time graph  Recognise from the shape of a speed–time graph when a body is – at rest – moving with constant speed – moving with changing speed  Calculate acceleration from the gradient of a speed–time graph  Calculate the area under a speed–time graph to work out the distance travelled for motion with constant acceleration OUTCOME
  • 3.
     Recognise linearmotion for which the acceleration is constant  Recognise motion for which the acceleration is not constant  Understand deceleration as a negative acceleration  Demonstrate understanding that acceleration and deceleration are related to changing speed including qualitative analysis of the gradient of a speed–time graph  State that the acceleration of free fall for a body near to the Earth is constant OUTCOME
  • 4.
     Straight horizontalline along x-axis  Stationary body  Speed = 0 Object moving at rest
  • 6.
     Straight horizontalline  Acceleration = zero Object moving with constant speed
  • 7.
     Linear motionis motion across a straight line.  Acceleration on a speed-time graph is constant when the line is straight.  Straight line passing through origin Object moving at a constant acceleration
  • 8.
     Line curvingdownwards indicating decreasing acceleration (A)  Line curving upwards indicating increasing acceleration (B) Object moving at a varying speed A B If on the speed-time graph the line is bent or curved it does not have a constant acceleration, because the gradient of the line changes.
  • 9.
  • 10.
     Graph ofspeed of a body against time. ◦ Speed plotted along Y axis ◦ Time plotted along X axis  Gradient of speed-time graph = acceleration m = a Speed-time (v-t) graph Acceleration, a =
  • 11.
    Speed – timegraph • With this graph we can tell three things; • the speed; directly off of the graph. • the acceleration; by calculating the gradient of the line. • the distance it has travelled; by calculating the area under the graph.
  • 12.
    Speed – timegraph Speed = 16 m/s
  • 13.
    Gradient, m Gradient isa unit less quantity Gradient, m = = = 170 – 10 / 32 – 4 = 5.7
  • 14.
    Calculating Gradient, m Gradient of speed-time graph = acceleration  m = a = = 40 – 10 / 4 – 1 = 10 m/s2 m = m = = 40 – 10 / 4 – 1 m = 10 a = 10 m/s2 m = a
  • 15.
    Distance travelled fromSpeed – time graph • Area under speed-time graph = distance travelled (s) s = A = (½ × b × h) + (l × b) + (½ × b × h) = (½ × 10 × 16) + (10 × 16) + (½ × 5 × 16) = 80 + 160 + 40 = 280 m A B C
  • 16.
    Speed – timegraph • Area under speed-time graph = distance travelled s) s = Area of trapezium = ½ × (base1 + base2) × h = ½ × (10 + 25) × 16 = 280 m A B C base1 base2
  • 17.
    Demonstrate a qualitativeunderstanding that acceleration is related to changing speed. • Acceleration is the rate of which an object changes speed, so when a speed changes, we assume that the acceleration has either increased or decreased. Acceleration, a = • Deceleration refers to acceleration in the direction opposite to the direction of the velocity
  • 18.
    State that theacceleration of free fall for a body near to the Earth is constant • Acceleration is the rate of which an object changes speed, so when a speed changes, we assume that the acceleration has either increased or decreased.