Downloaded 305 times
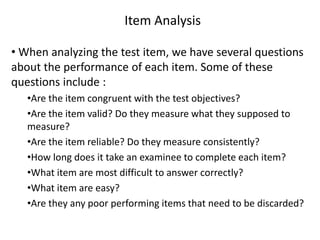
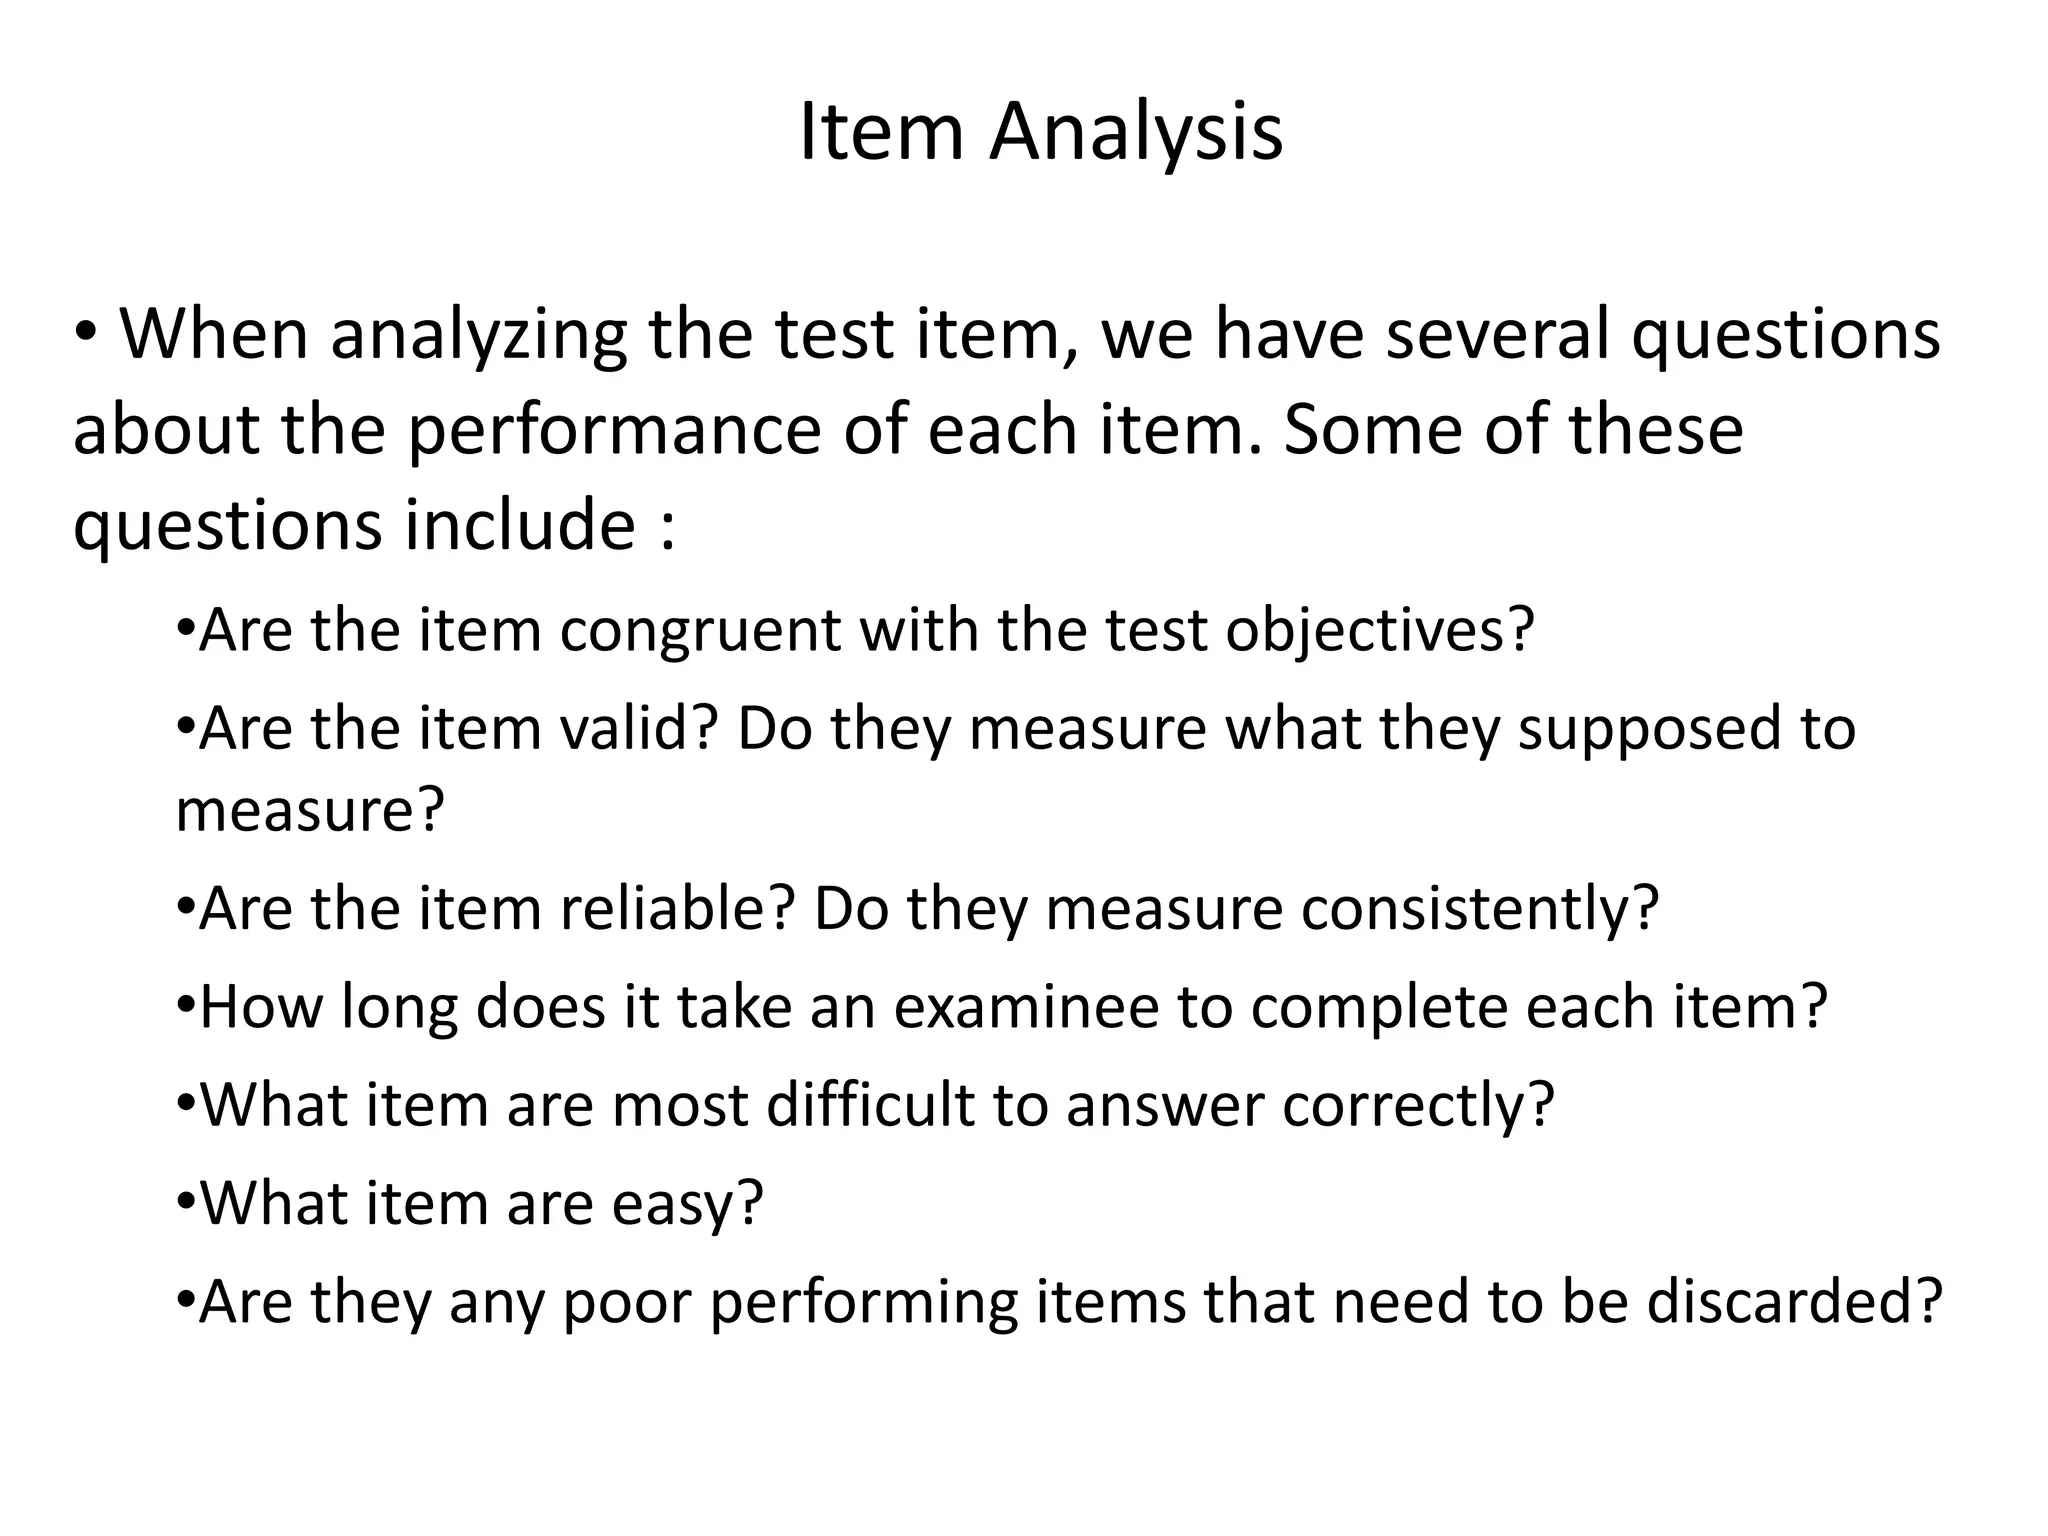
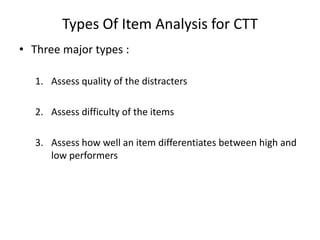
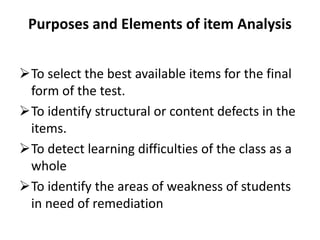
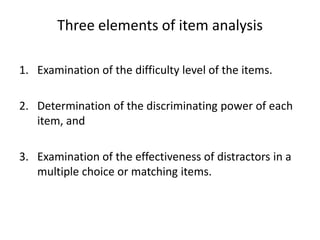
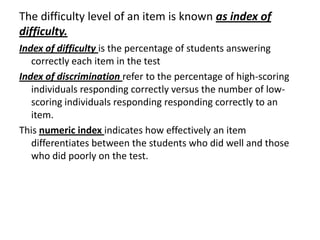
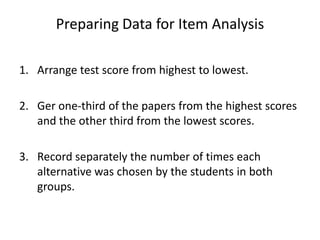
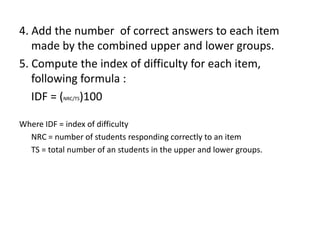
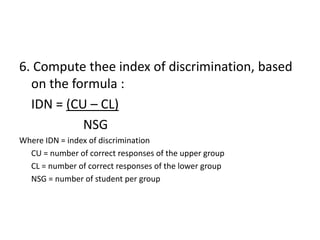

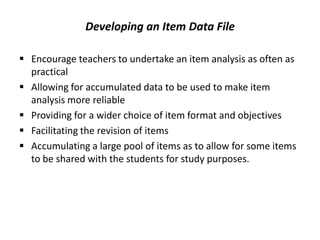
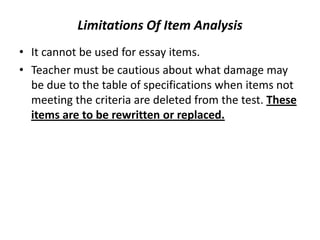
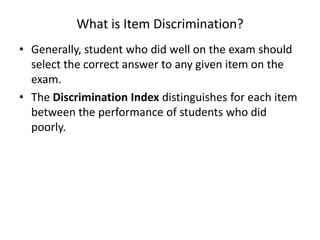
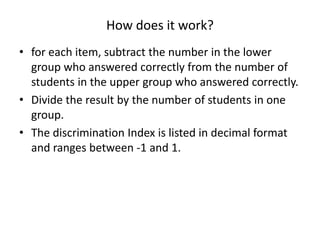
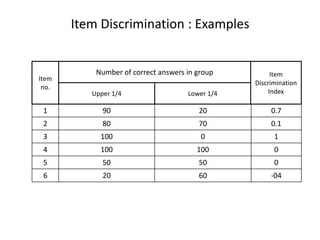
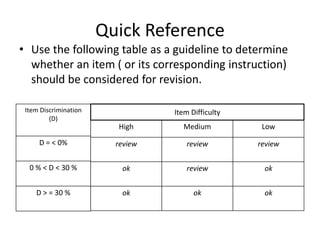
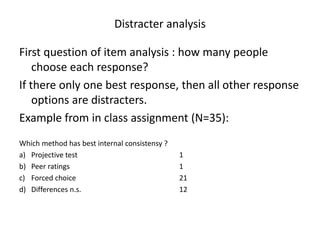

The document discusses item analysis which is used to evaluate the quality and performance of test items. It addresses several key aspects of item analysis including calculating the index of difficulty and discrimination for each item, examining distractors, and using the results to identify issues and determine if items should be retained, modified, or discarded. The purpose is to select the best items for the final test form and identify areas for improvement.