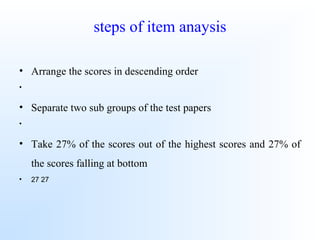
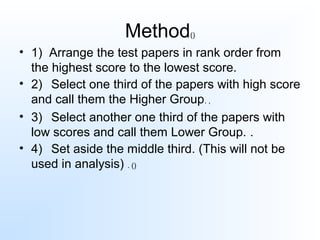
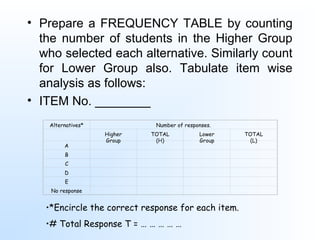
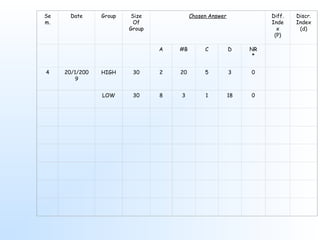
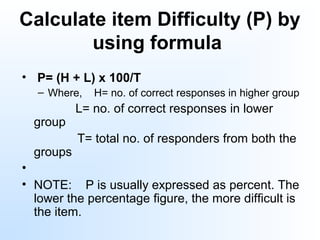
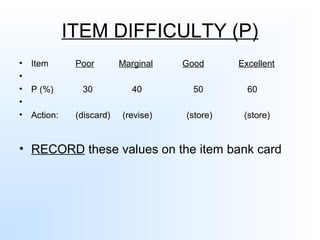
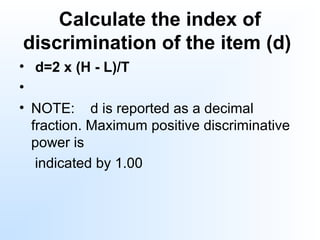
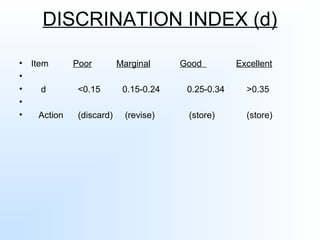
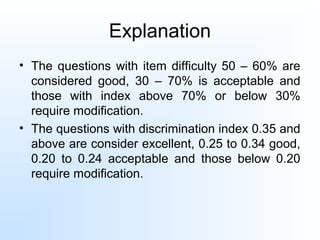
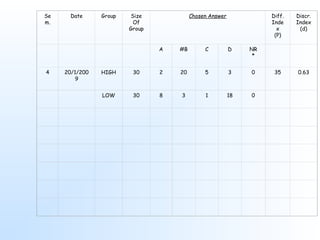
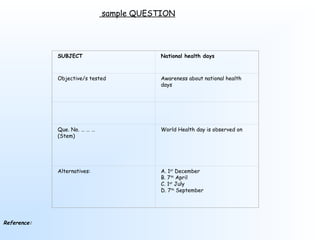
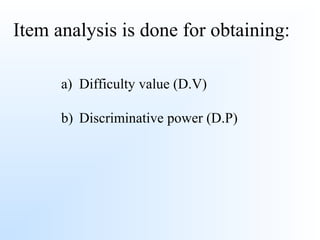
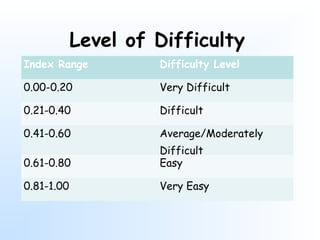
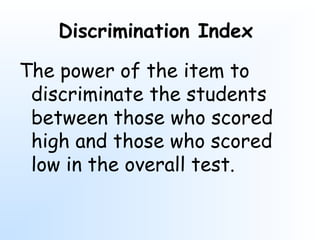
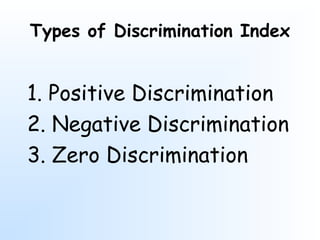
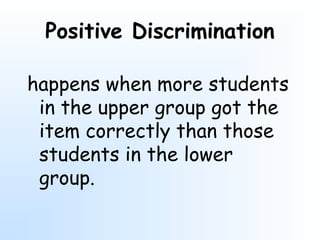
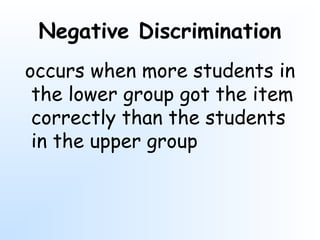
ITEM ANALYSIS
By
.
Introduction()
• It is the analysis of Item (MCQ).
(MCQ) .
• It is importance to evaluate the
effectiveness of the items.
.
• This is done by studying the student’s
response to each item.
.
OBJECTIVES OF ITEM ANALYSIS
• To select appropriate items for the final draft
•
• To obtain the information about the difficulty value(D.V) of
all the items
• (D.V)
• To provide discriminatory power (D.I) to differentiate
between capable and less capable examinees for the items
• (D.I)
• To provide modification to be made in some of the items
•
• To prepare the final draft properly ( easy to difficult items)
• ()
Objectives of lecture
• Understanding Item and why its required
to study.
•
• Tools of item analysis
•
• Method of analysis
•
• Record keeping of analysis results
•
Need for Item analysis
• Item analysis information can tell us
•
– if an item (i.e. the question) was too easy or
too difficult,
– ()
– how well it discriminated between high and
low scorers on the test and whether all of the
alternatives functioned as intended.
– .
steps of item anaysis
• Arrange the scores in descending order
•
• Separate two sub groups of the test papers
•
• Take 27% of the scores out of the highest scores and 27% of
the scores falling at bottom
• 27 27
• Count the number of right answer in highest
group (R.H) and count the no of right answer
in lowest group (R.L)
• (R.H) , (R.L)
• Count the non-response (N.R) examinees
•
Advantages of Item analysis
• It aids in detecting specific technical flaws and thus
provides information for improving test item.
• ,
• It provide useful information for class discussion of
the test, e.g. easy item can be skipped over and
treated lightly, answers to difficult items can be
explained in detail and items be pointed out to the
students rather than defended as fair.
, .. , .
• It provides data for helping the students to
improve their learning. The frequency with
which incorrect answer is chosen reveals
common errors and misconception which
provides a focus for remedial work. . , .
• It provides insight in skills which lead to
preparation of better test in future
•
Tools for analysis
• 1.      The difficulty of the item 
(Difficulty Index) ()
• 2.      The discriminating power 
(Discrimination Index) ()
• 3.      The effectiveness of each 
alternative (distracter effectiveness)
•
Method()
• 1) Arrange the test papers in rank order from
the highest score to the lowest score.
• 2) Select one third of the papers with high score
and call them the Higher Group. ,
• 3) Select another one third of the papers with
low scores and call them Lower Group. .
• 4) Set aside the middle third. (This will not be
used in analysis) . ()
• Prepare a FREQUENCY TABLE by counting
the number of students in the Higher Group
who selected each alternative. Similarly count
for Lower Group also. Tabulate item wise
analysis as follows:
• ITEM No. ________
  
Alternatives* Number of responses.
  Higher
Group
TOTAL
(H)
Lower
Group
TOTAL
(L)
A        
B        
C        
D        
E        
No response        
•*Encircle the correct response for each item.
•# Total Response T = … … … … …
Se
m.
Date Group Size
Of
Group
Chosen Answer Diff.
Inde
x
(P)
Discr.
Index
(d)
        A #B C D NR
*
   
4 20/1/200
9
HIGH 30 2 20 5 3 0
    LOW 30 8 3 1 18 0    


Calculate item Difficulty (P) by 
using formula
•  P= (H + L) x 100/T
– Where, H= no. of correct responses in higher group
L= no. of correct responses in lower
group
T= total no. of responders from both the
groups
•
• NOTE: P is usually expressed as percent. The
lower the percentage figure, the more difficult is
the item.
ITEM DIFFICULTY (P)
• Item Poor Marginal Good Excellent
•
• P (%) 30 40 50 60
•
• Action: (discard) (revise) (store) (store)
• RECORD these values on the item bank card
Calculate the index of
discrimination of the item (d)
• d=2 x (H - L)/T
•
• NOTE: d is reported as a decimal
fraction. Maximum positive discriminative
power is
indicated by 1.00
DISCRINATION INDEX (d)
• Item Poor Marginal Good Excellent
•
• d <0.15 0.15-0.24 0.25-0.34 >0.35
•
• Action (discard) (revise) (store) (store)
Explanation
• The questions with item difficulty 50 – 60% are
considered good, 30 – 70% is acceptable and
those with index above 70% or below 30%
require modification.
• The questions with discrimination index 0.35 and
above are consider excellent, 0.25 to 0.34 good,
0.20 to 0.24 acceptable and those below 0.20
require modification.
Se
m.
Date Group Size
Of
Group
Chosen Answer Diff.
Inde
x
(P)
Discr.
Index
(d)
        A #B C D NR
*
   
4 20/1/200
9
HIGH 30 2 20 5 3 0
    LOW 30 8 3 1 18 0    


Se
m.
Date Group Size
Of
Group
Chosen Answer Diff.
Inde
x
(P)
Discr.
Index
(d)
        A #B C D NR
*
   
4 20/1/200
9
HIGH 30 2 20 5 3 0 35 0.63
    LOW 30 8 3 1 18 0    


sample QUESTION
SUBJECT National health days
Objective/s tested Awareness about national health
days
   
Que. No. … … …
(Stem)
World Health day is observed on
Alternatives: A. 1st
December
B. 7th
April
C. 1st
July
D. 7th
September
Reference:
Item analysis is done for obtaining:
a) Difficulty value (D.V)
b) Discriminative power (D.P)
Level of Difficulty
Index Range Difficulty Level
0.00-0.20 Very Difficult
0.21-0.40 Difficult
0.41-0.60 Average/Moderately
Difficult
0.61-0.80 Easy
0.81-1.00 Very Easy
Discrimination Index
The power of the item to
discriminate the students
between those who scored
high and those who scored
low in the overall test.
Types of Discrimination Index
1. Positive Discrimination
2. Negative Discrimination
3. Zero Discrimination
Positive Discrimination
happens when more students
in the upper group got the
item correctly than those
students in the lower
group.
Negative Discrimination
occurs when more students in
the lower group got the item
correctly than the students
in the upper group
Zero Discrimination
happens when a number of
students in the upper
group and lower group who
answer the test correctly
are equal
Analysis of Response Options
Another way to evaluate the
performance of the entire test
item is through the analysis of the
response options. It is very
important to examine the
performance of each option in a
multiple-choice item.
• Link video
• Link video
• Link video
• Thank you

item analysics

  • 1.
  • 2.
    Introduction() • It isthe analysis of Item (MCQ). (MCQ) . • It is importance to evaluate the effectiveness of the items. . • This is done by studying the student’s response to each item. .
  • 3.
    OBJECTIVES OF ITEMANALYSIS • To select appropriate items for the final draft • • To obtain the information about the difficulty value(D.V) of all the items • (D.V) • To provide discriminatory power (D.I) to differentiate between capable and less capable examinees for the items • (D.I)
  • 4.
    • To providemodification to be made in some of the items • • To prepare the final draft properly ( easy to difficult items) • ()
  • 5.
    Objectives of lecture •Understanding Item and why its required to study. • • Tools of item analysis • • Method of analysis • • Record keeping of analysis results •
  • 6.
    Need for Itemanalysis • Item analysis information can tell us • – if an item (i.e. the question) was too easy or too difficult, – () – how well it discriminated between high and low scorers on the test and whether all of the alternatives functioned as intended. – .
  • 7.
    steps of itemanaysis • Arrange the scores in descending order • • Separate two sub groups of the test papers • • Take 27% of the scores out of the highest scores and 27% of the scores falling at bottom • 27 27
  • 8.
    • Count thenumber of right answer in highest group (R.H) and count the no of right answer in lowest group (R.L) • (R.H) , (R.L) • Count the non-response (N.R) examinees •
  • 9.
    Advantages of Itemanalysis • It aids in detecting specific technical flaws and thus provides information for improving test item. • , • It provide useful information for class discussion of the test, e.g. easy item can be skipped over and treated lightly, answers to difficult items can be explained in detail and items be pointed out to the students rather than defended as fair. , .. , .
  • 10.
    • It providesdata for helping the students to improve their learning. The frequency with which incorrect answer is chosen reveals common errors and misconception which provides a focus for remedial work. . , . • It provides insight in skills which lead to preparation of better test in future •
  • 11.
    Tools for analysis •1.      The difficulty of the item  (Difficulty Index) () • 2.      The discriminating power  (Discrimination Index) () • 3.      The effectiveness of each  alternative (distracter effectiveness) •
  • 12.
    Method() • 1) Arrangethe test papers in rank order from the highest score to the lowest score. • 2) Select one third of the papers with high score and call them the Higher Group. , • 3) Select another one third of the papers with low scores and call them Lower Group. . • 4) Set aside the middle third. (This will not be used in analysis) . ()
  • 13.
    • Prepare aFREQUENCY TABLE by counting the number of students in the Higher Group who selected each alternative. Similarly count for Lower Group also. Tabulate item wise analysis as follows: • ITEM No. ________    Alternatives* Number of responses.   Higher Group TOTAL (H) Lower Group TOTAL (L) A         B         C         D         E         No response         •*Encircle the correct response for each item. •# Total Response T = … … … … …
  • 14.
    Se m. Date Group Size Of Group ChosenAnswer Diff. Inde x (P) Discr. Index (d)         A #B C D NR *     4 20/1/200 9 HIGH 30 2 20 5 3 0     LOW 30 8 3 1 18 0                                                                                                                                        
  • 15.
    Calculate item Difficulty (P) by  using formula •  P= (H + L) x 100/T – Where,H= no. of correct responses in higher group L= no. of correct responses in lower group T= total no. of responders from both the groups • • NOTE: P is usually expressed as percent. The lower the percentage figure, the more difficult is the item.
  • 16.
    ITEM DIFFICULTY (P) •Item Poor Marginal Good Excellent • • P (%) 30 40 50 60 • • Action: (discard) (revise) (store) (store) • RECORD these values on the item bank card
  • 17.
    Calculate the indexof discrimination of the item (d) • d=2 x (H - L)/T • • NOTE: d is reported as a decimal fraction. Maximum positive discriminative power is indicated by 1.00
  • 18.
    DISCRINATION INDEX (d) •Item Poor Marginal Good Excellent • • d <0.15 0.15-0.24 0.25-0.34 >0.35 • • Action (discard) (revise) (store) (store)
  • 19.
    Explanation • The questionswith item difficulty 50 – 60% are considered good, 30 – 70% is acceptable and those with index above 70% or below 30% require modification. • The questions with discrimination index 0.35 and above are consider excellent, 0.25 to 0.34 good, 0.20 to 0.24 acceptable and those below 0.20 require modification.
  • 20.
    Se m. Date Group Size Of Group ChosenAnswer Diff. Inde x (P) Discr. Index (d)         A #B C D NR *     4 20/1/200 9 HIGH 30 2 20 5 3 0     LOW 30 8 3 1 18 0                                                                                                                                        
  • 21.
    Se m. Date Group Size Of Group ChosenAnswer Diff. Inde x (P) Discr. Index (d)         A #B C D NR *     4 20/1/200 9 HIGH 30 2 20 5 3 0 35 0.63     LOW 30 8 3 1 18 0                                                                                                                                        
  • 22.
      sample QUESTION SUBJECT Nationalhealth days Objective/s tested Awareness about national health days     Que. No. … … … (Stem) World Health day is observed on Alternatives: A. 1st December B. 7th April C. 1st July D. 7th September Reference:
  • 23.
    Item analysis isdone for obtaining: a) Difficulty value (D.V) b) Discriminative power (D.P)
  • 24.
    Level of Difficulty IndexRange Difficulty Level 0.00-0.20 Very Difficult 0.21-0.40 Difficult 0.41-0.60 Average/Moderately Difficult 0.61-0.80 Easy 0.81-1.00 Very Easy
  • 25.
    Discrimination Index The powerof the item to discriminate the students between those who scored high and those who scored low in the overall test.
  • 26.
    Types of DiscriminationIndex 1. Positive Discrimination 2. Negative Discrimination 3. Zero Discrimination
  • 27.
    Positive Discrimination happens whenmore students in the upper group got the item correctly than those students in the lower group.
  • 28.
    Negative Discrimination occurs whenmore students in the lower group got the item correctly than the students in the upper group
  • 29.
    Zero Discrimination happens whena number of students in the upper group and lower group who answer the test correctly are equal
  • 30.
    Analysis of ResponseOptions Another way to evaluate the performance of the entire test item is through the analysis of the response options. It is very important to examine the performance of each option in a multiple-choice item.
  • 31.
    • Link video •Link video • Link video • Thank you