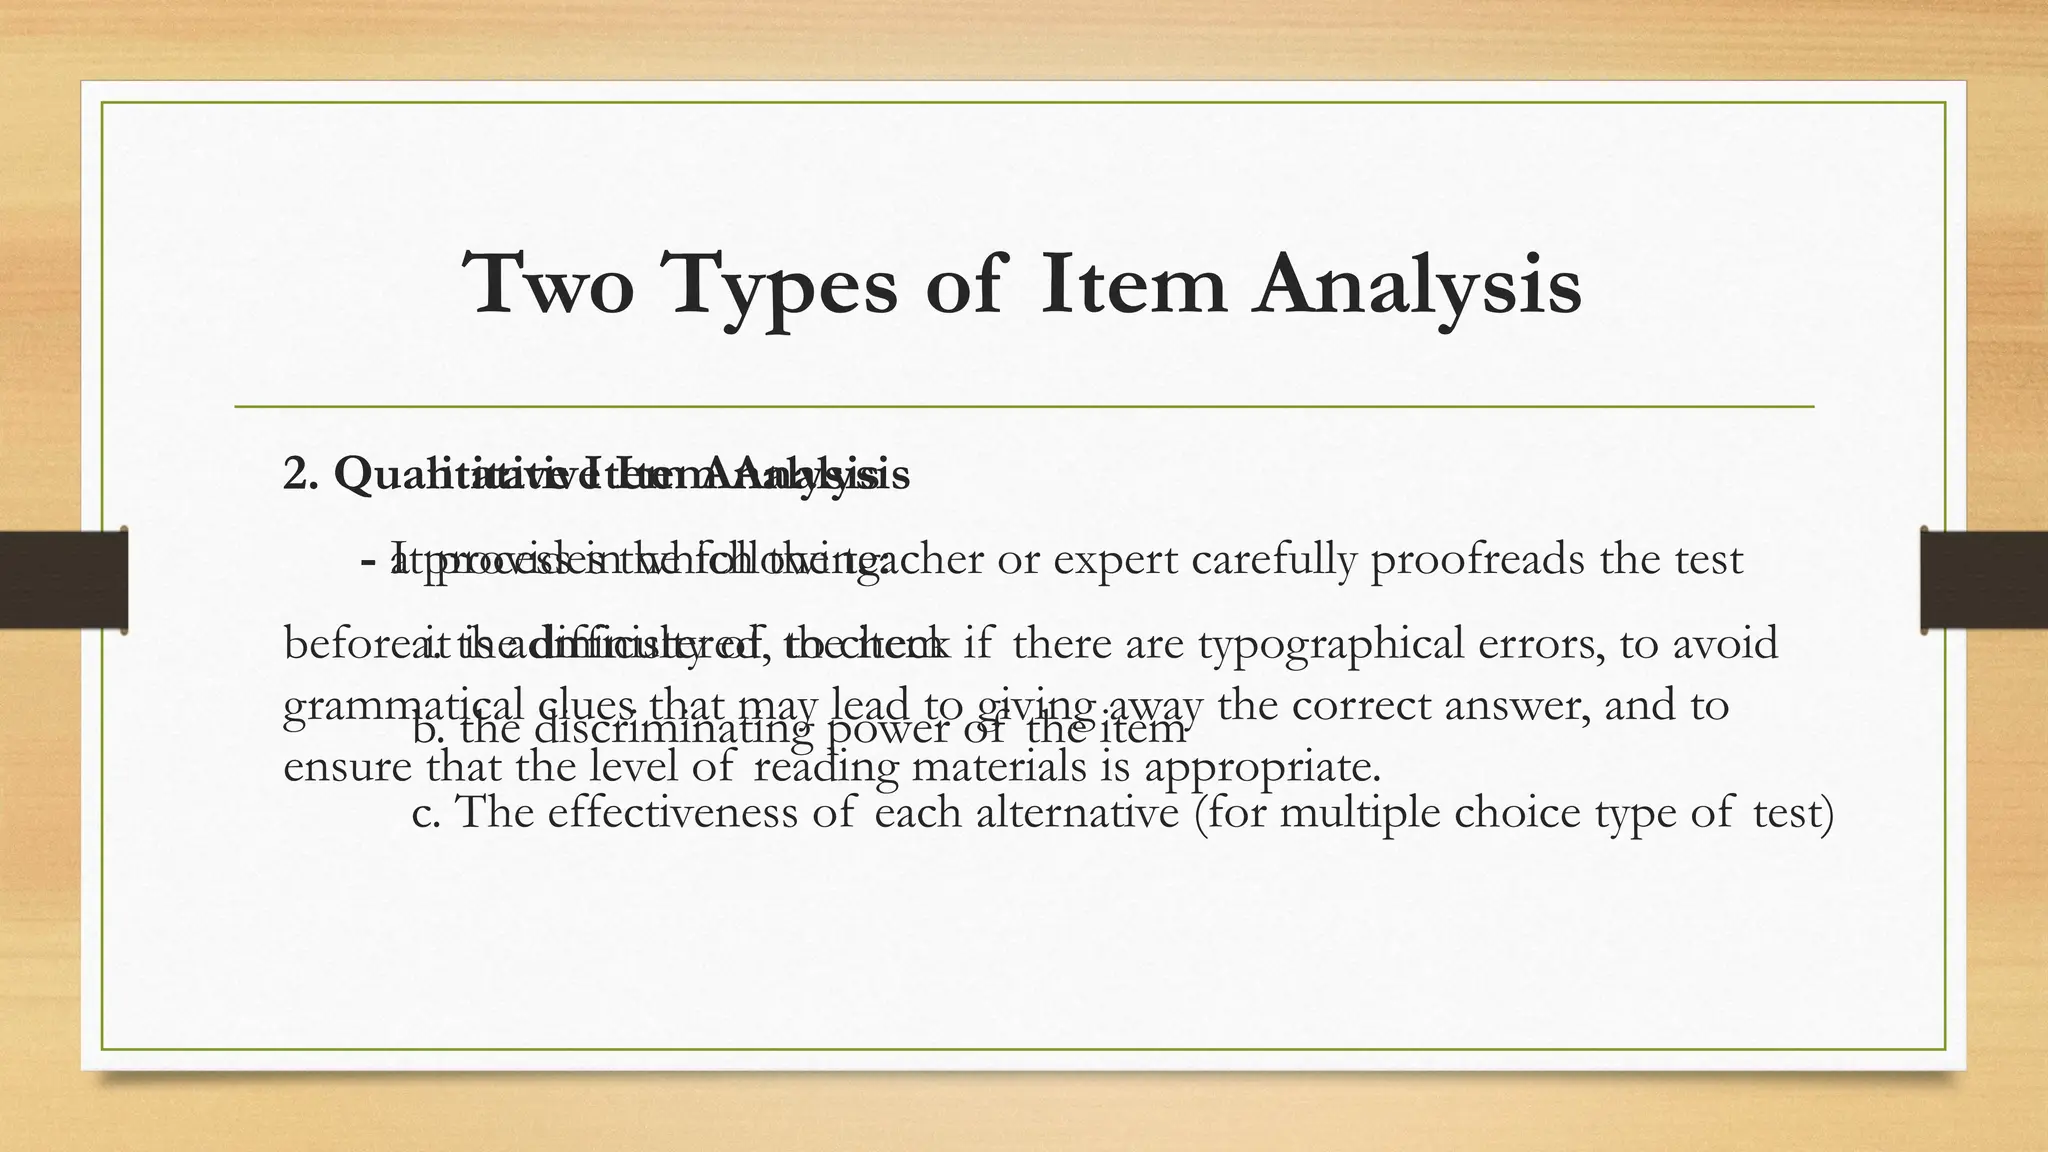
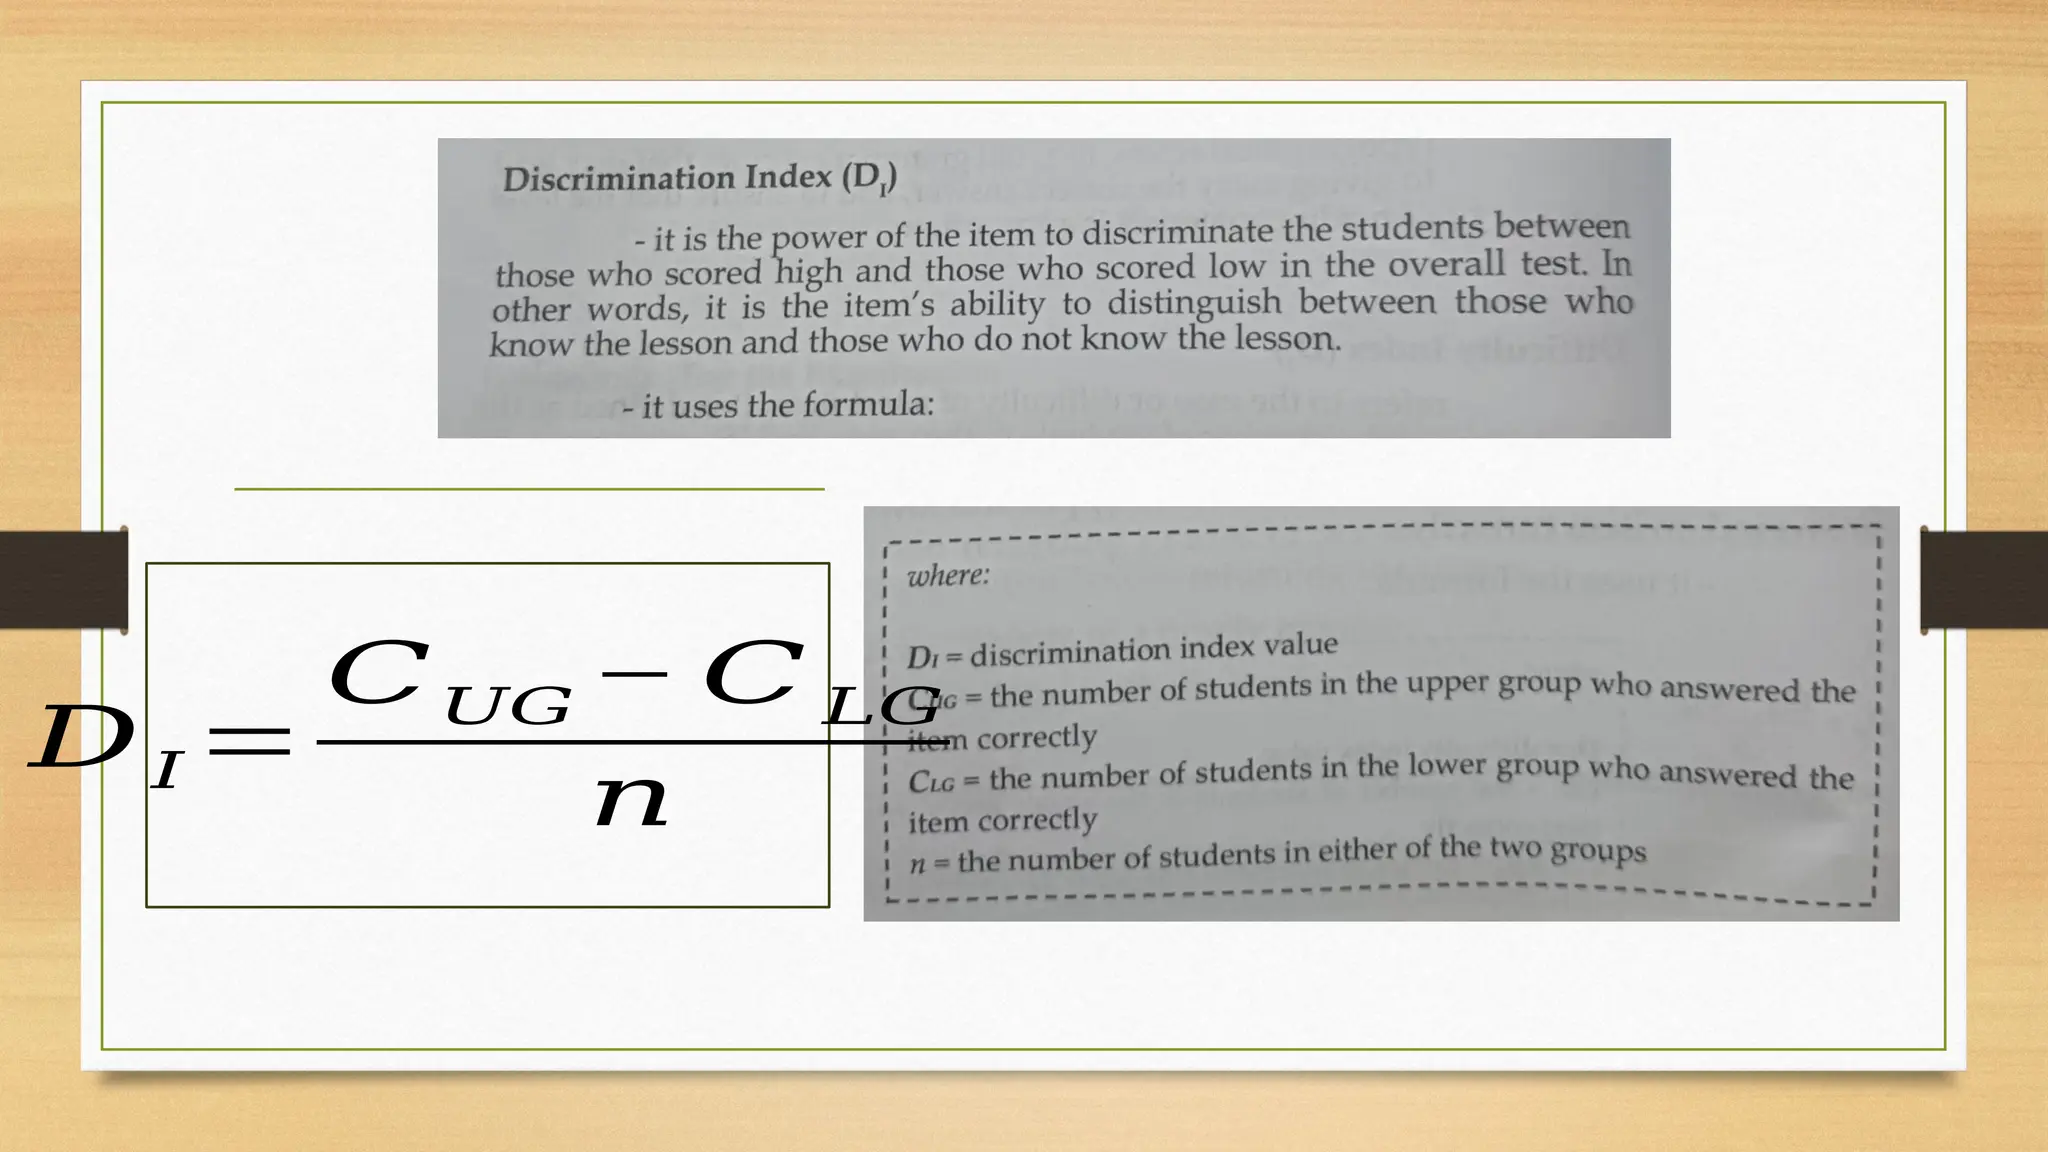
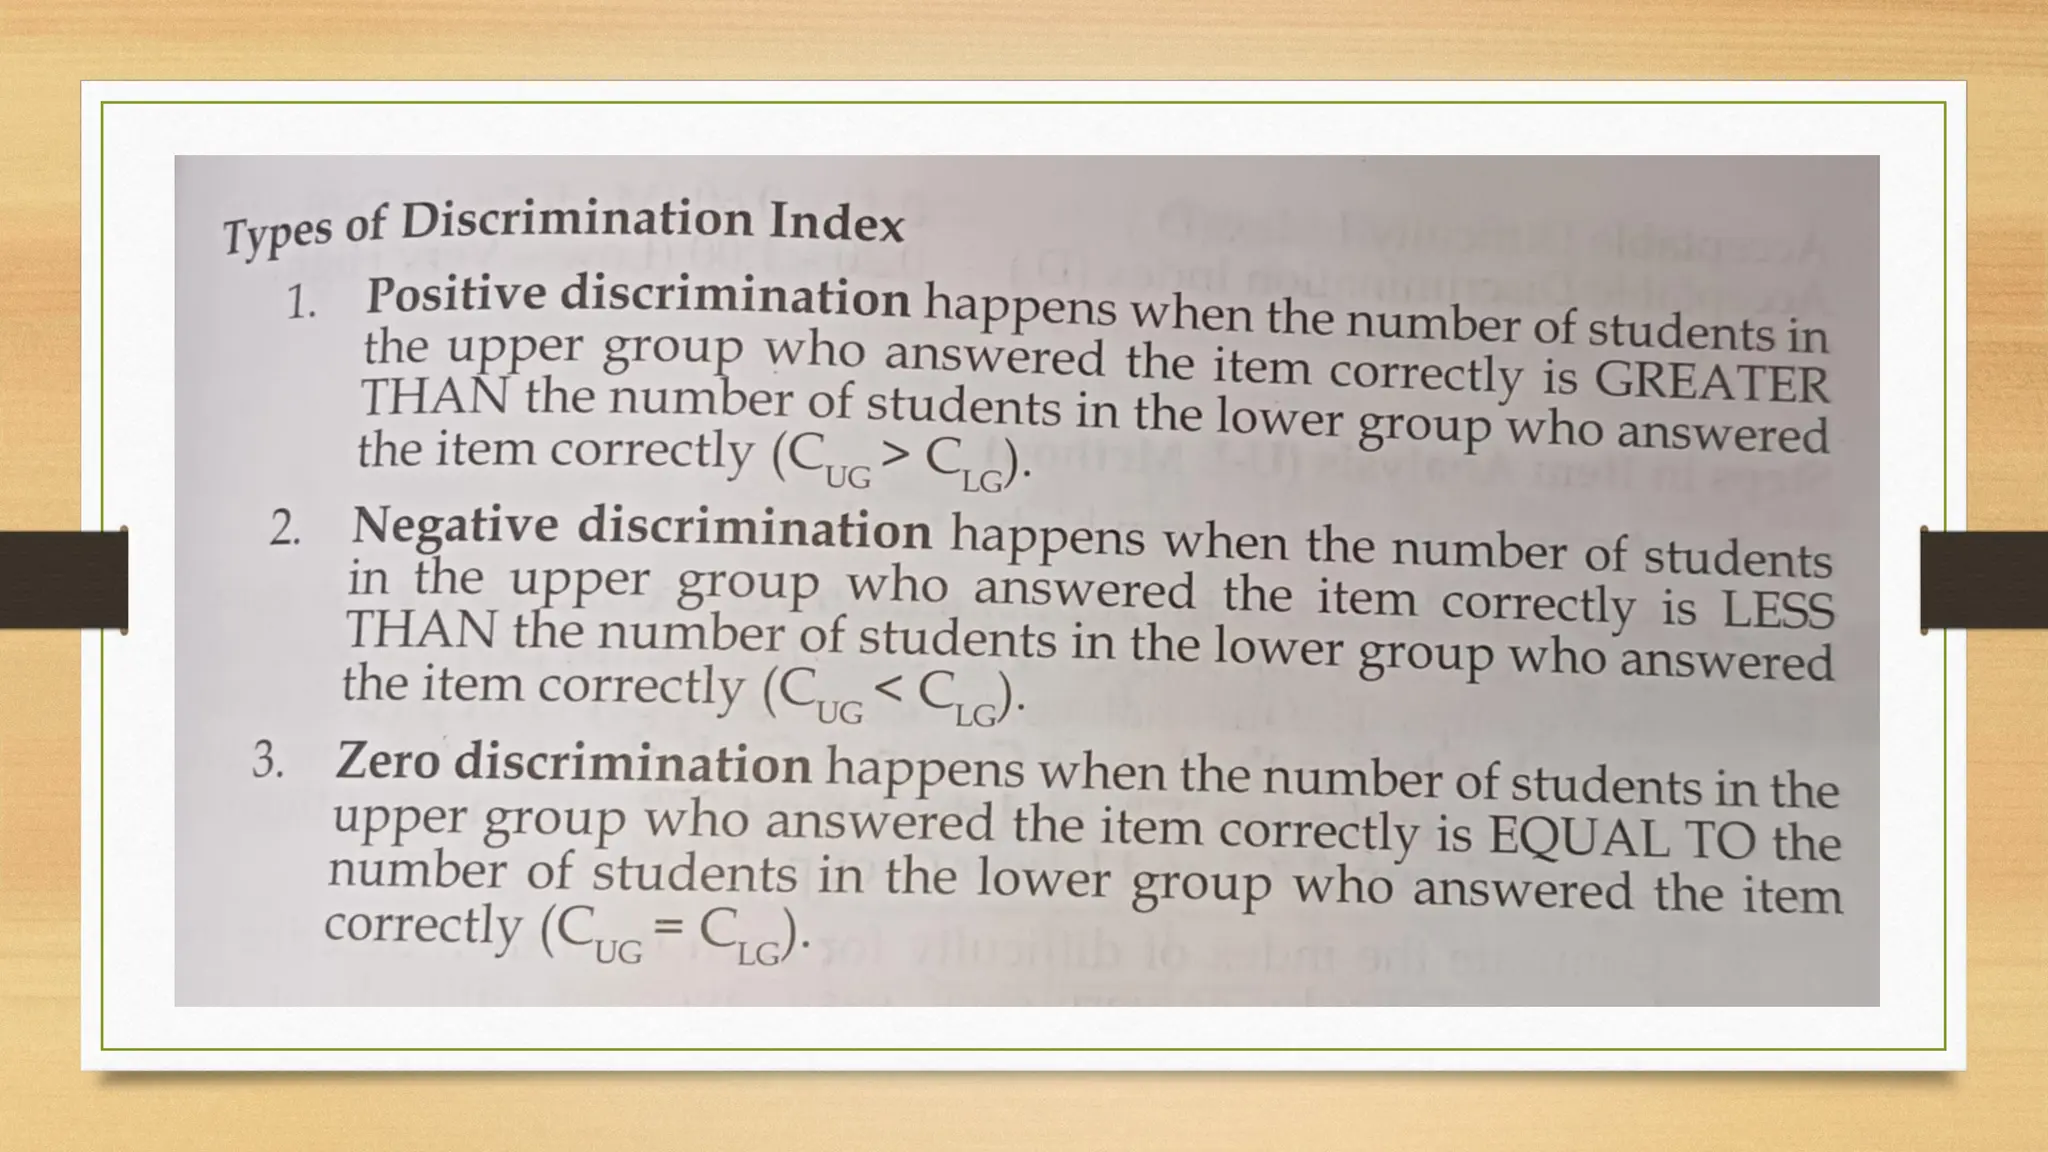
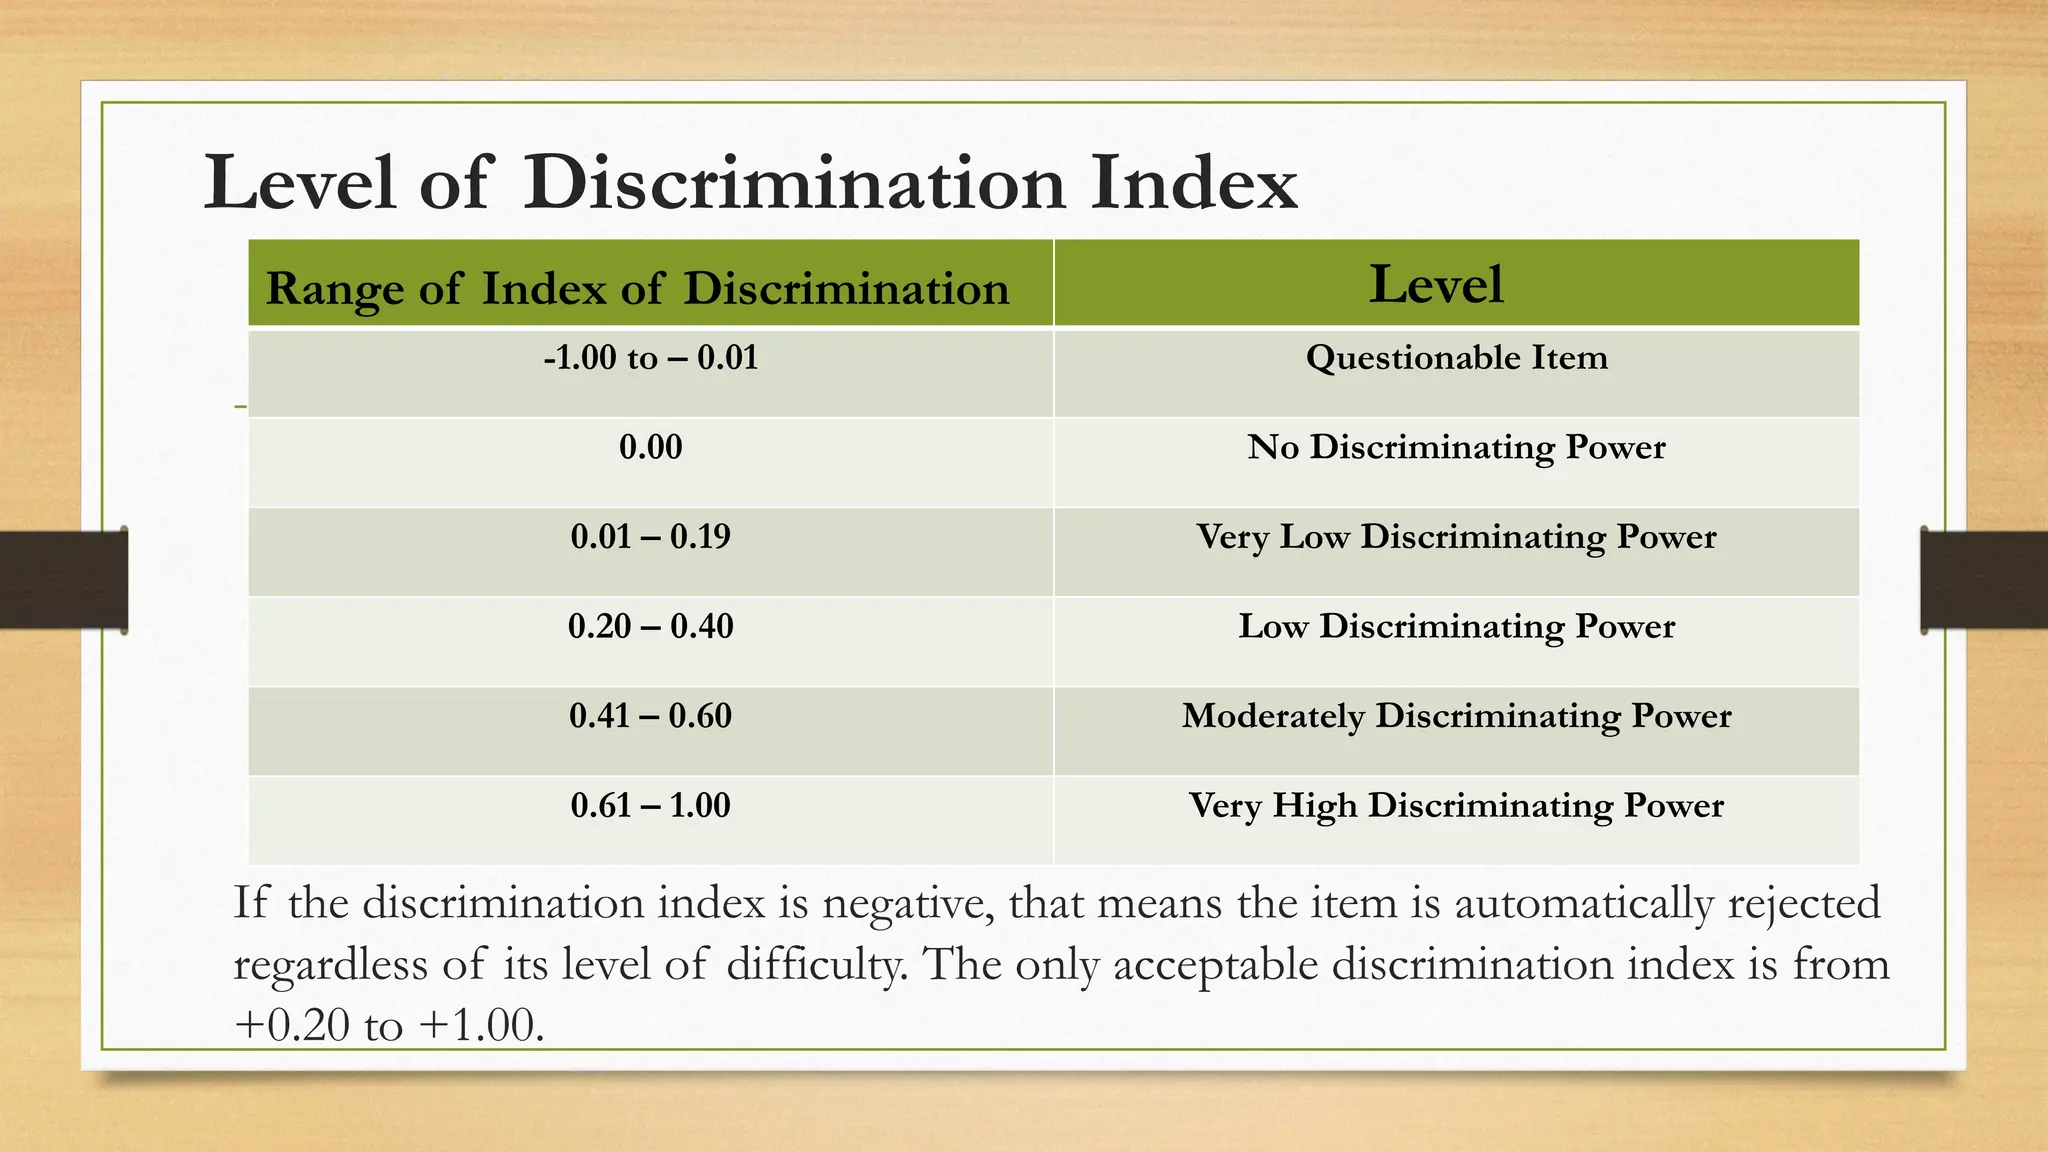
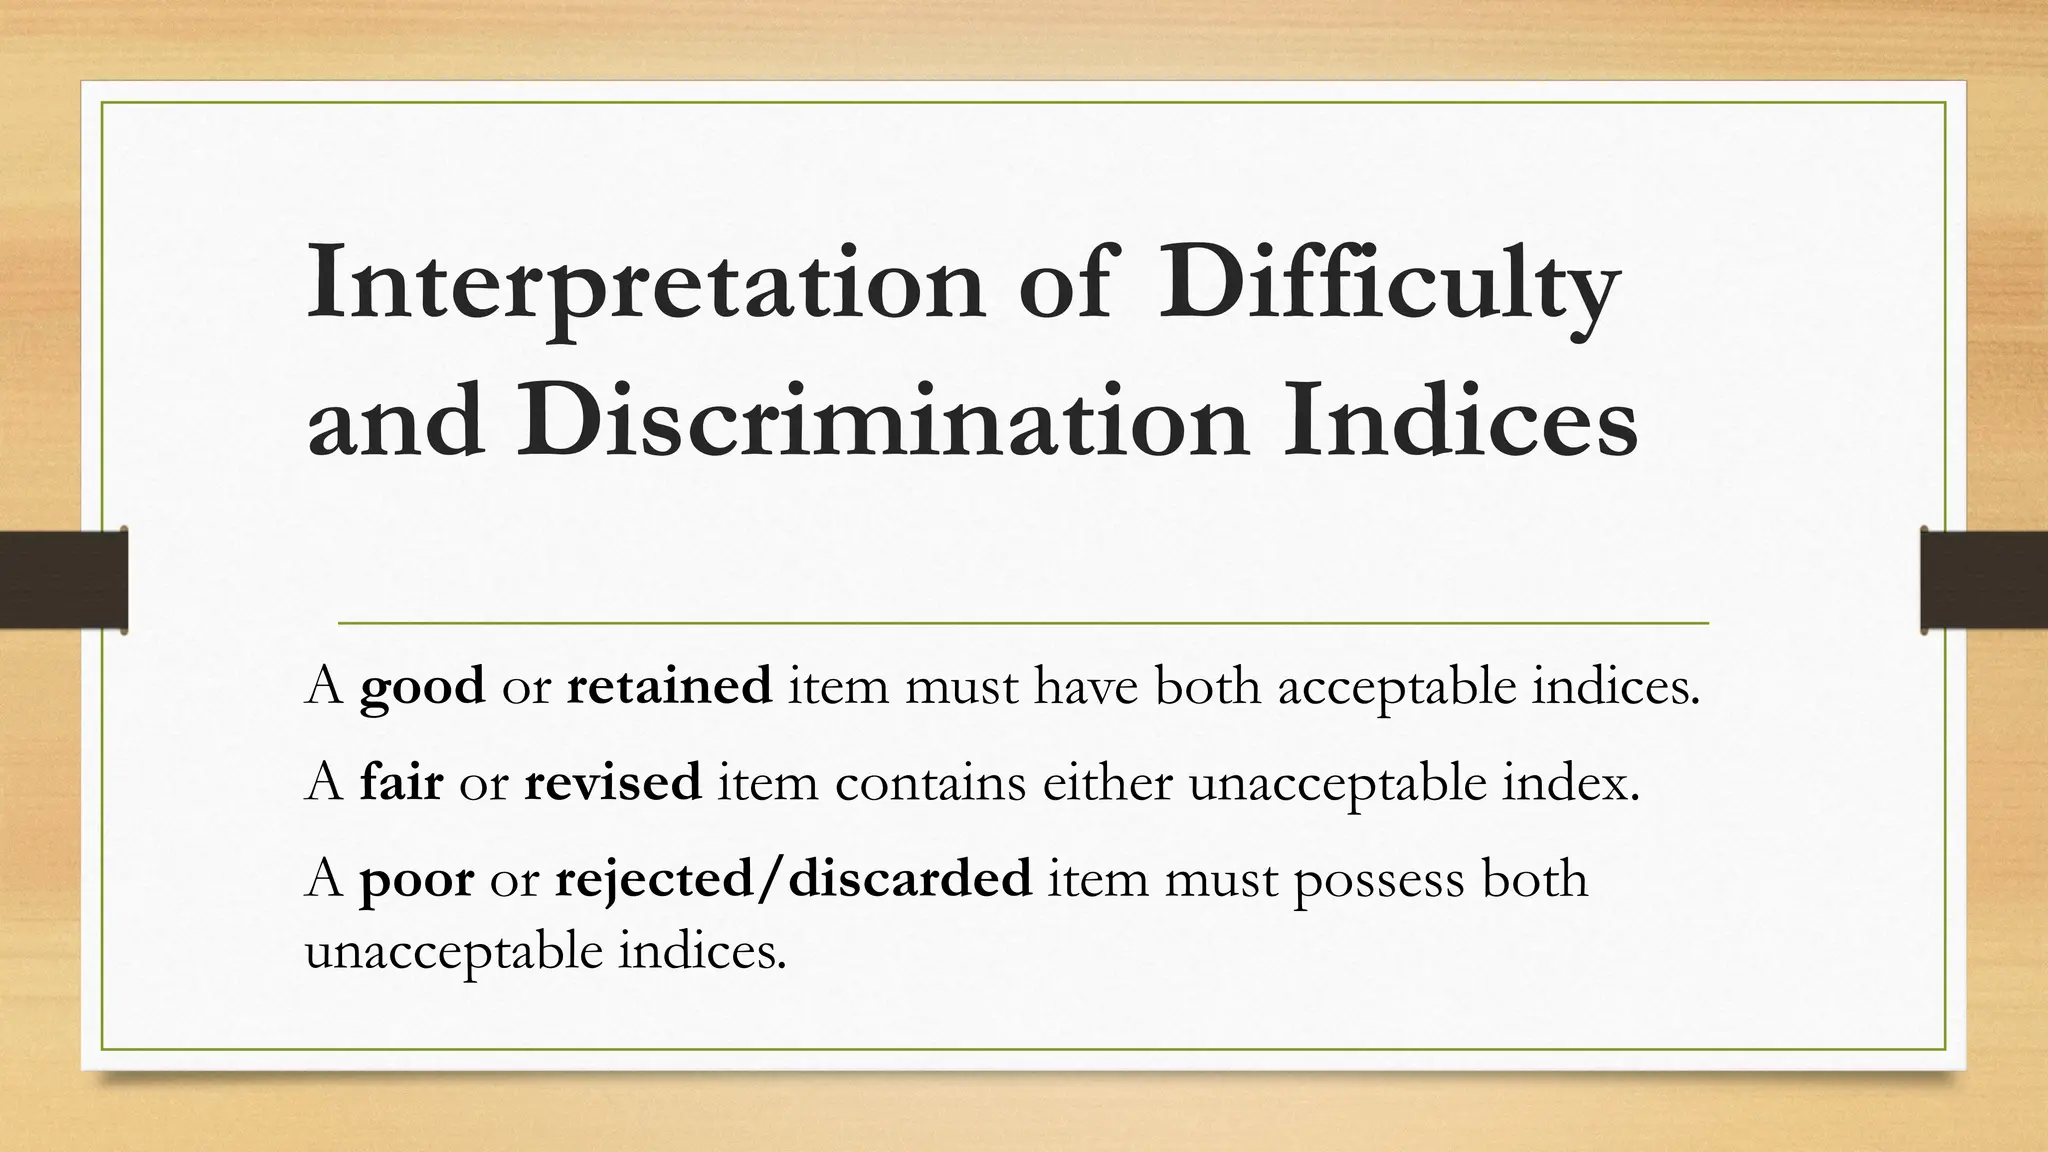
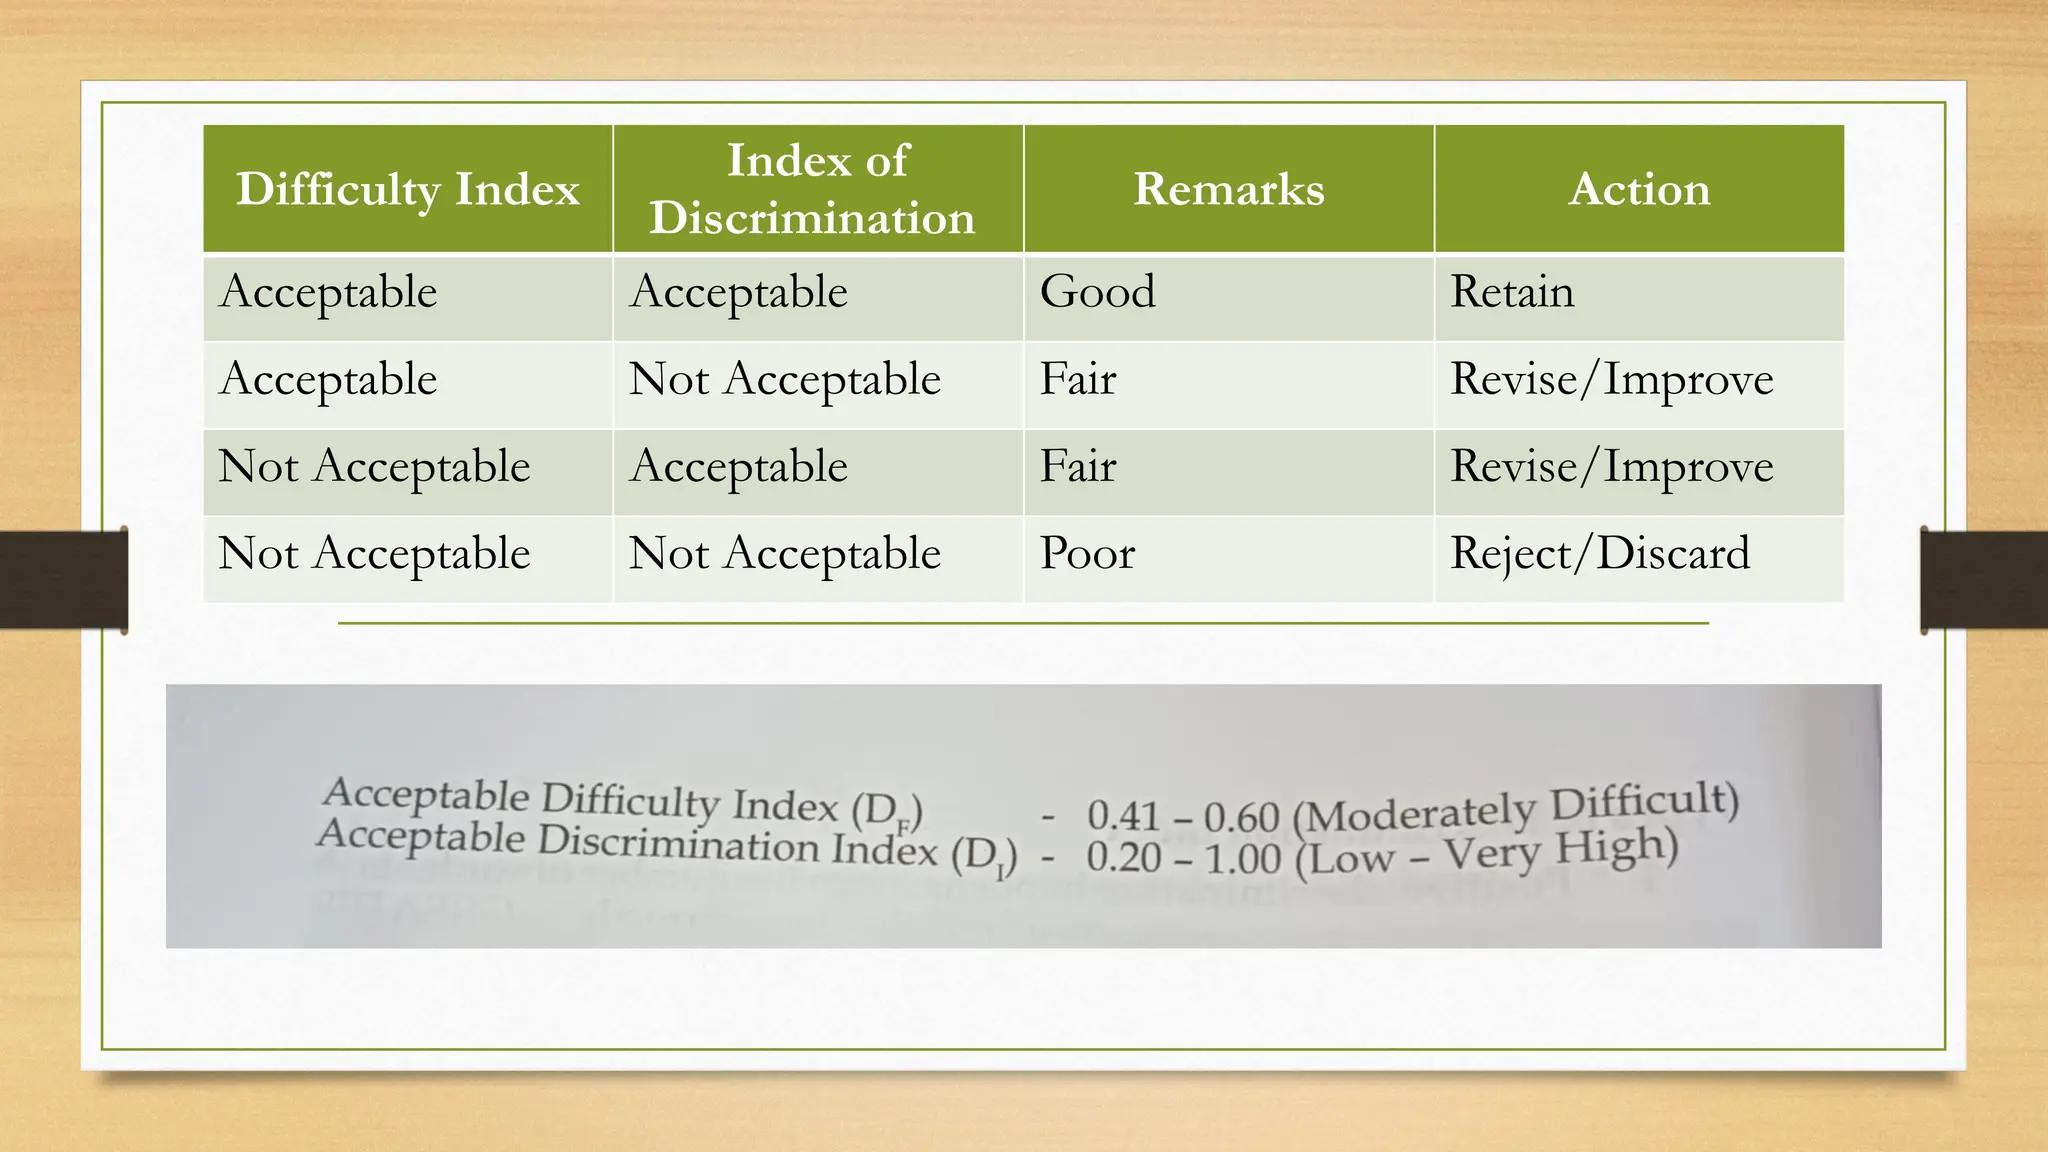
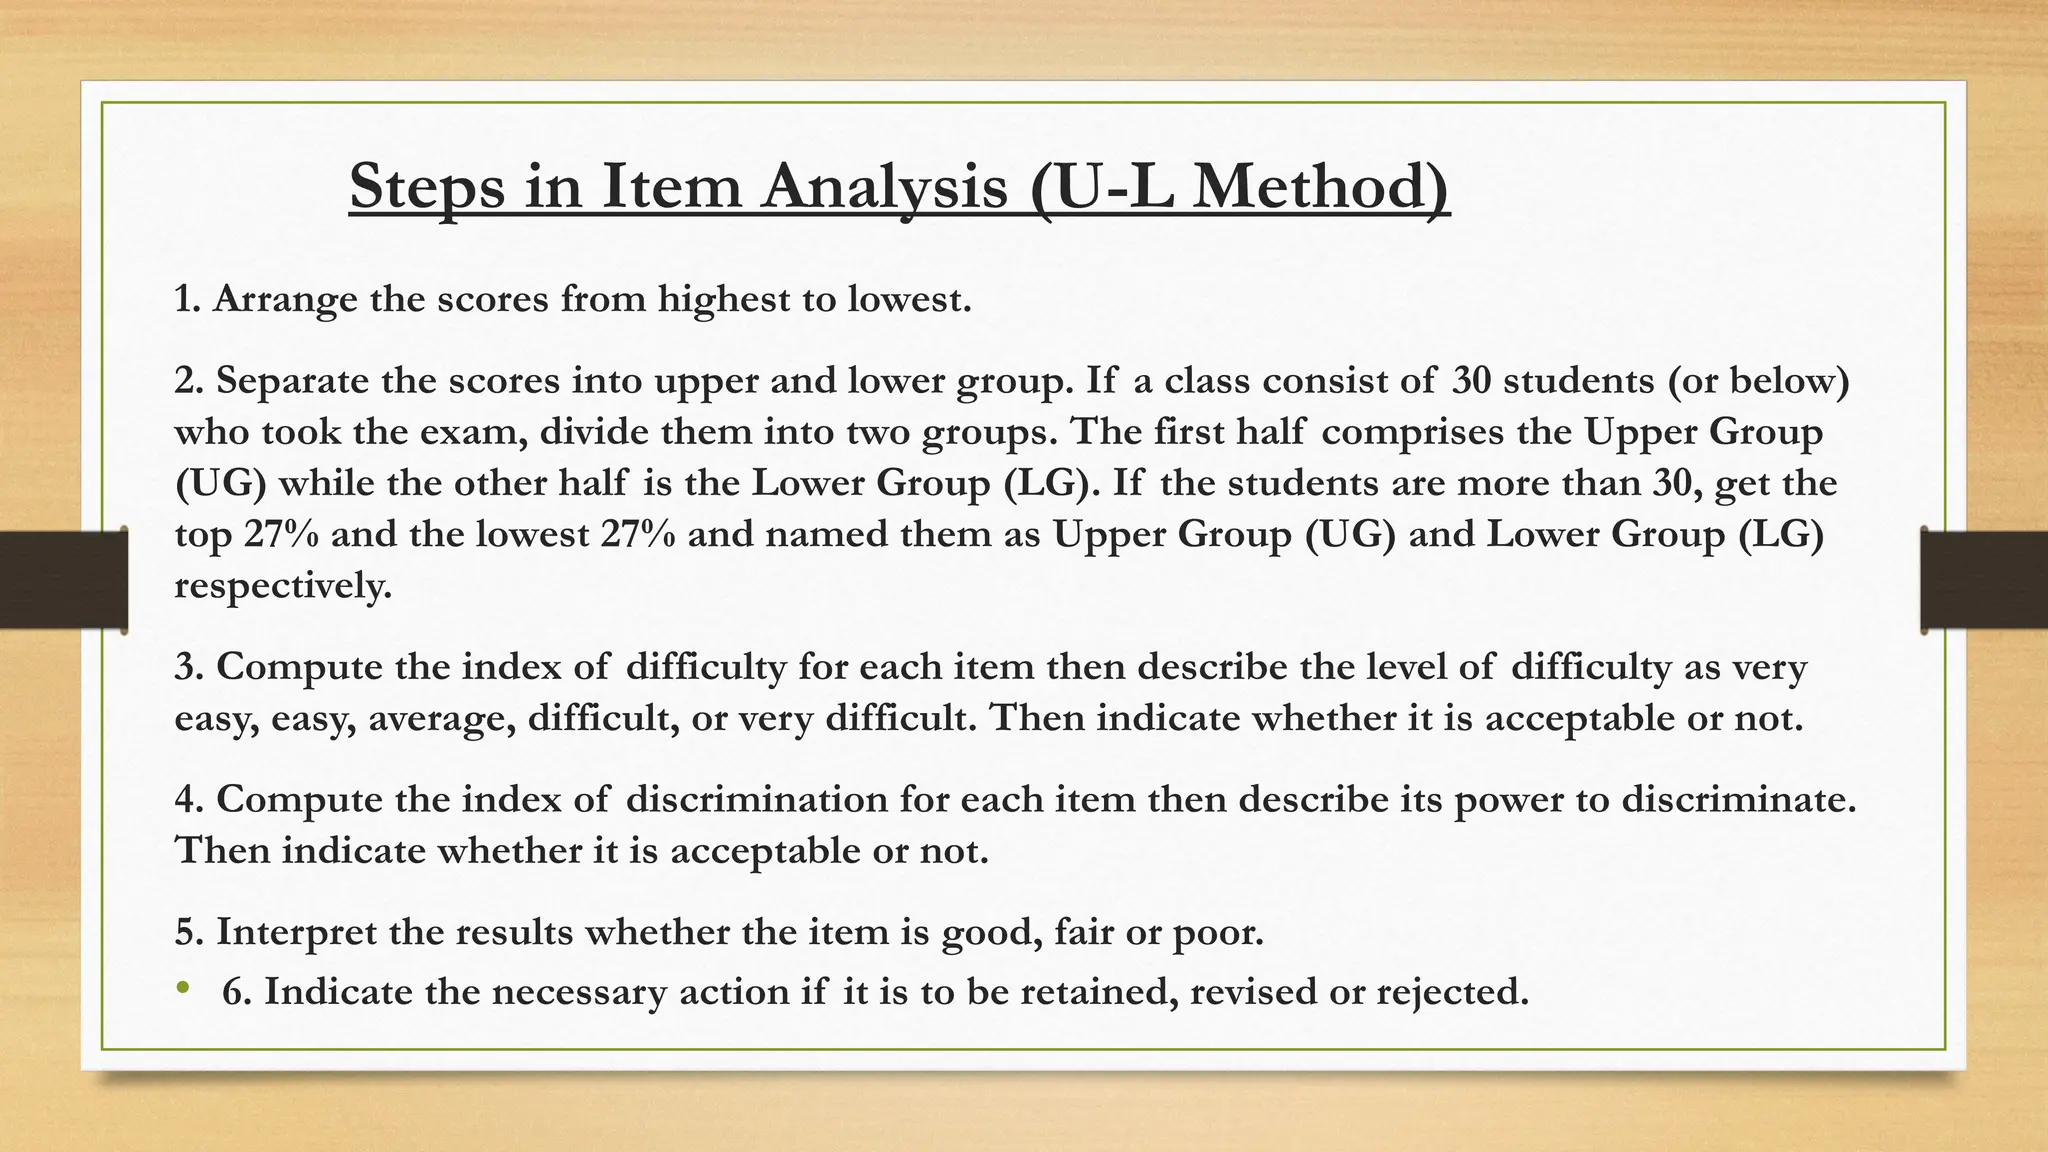
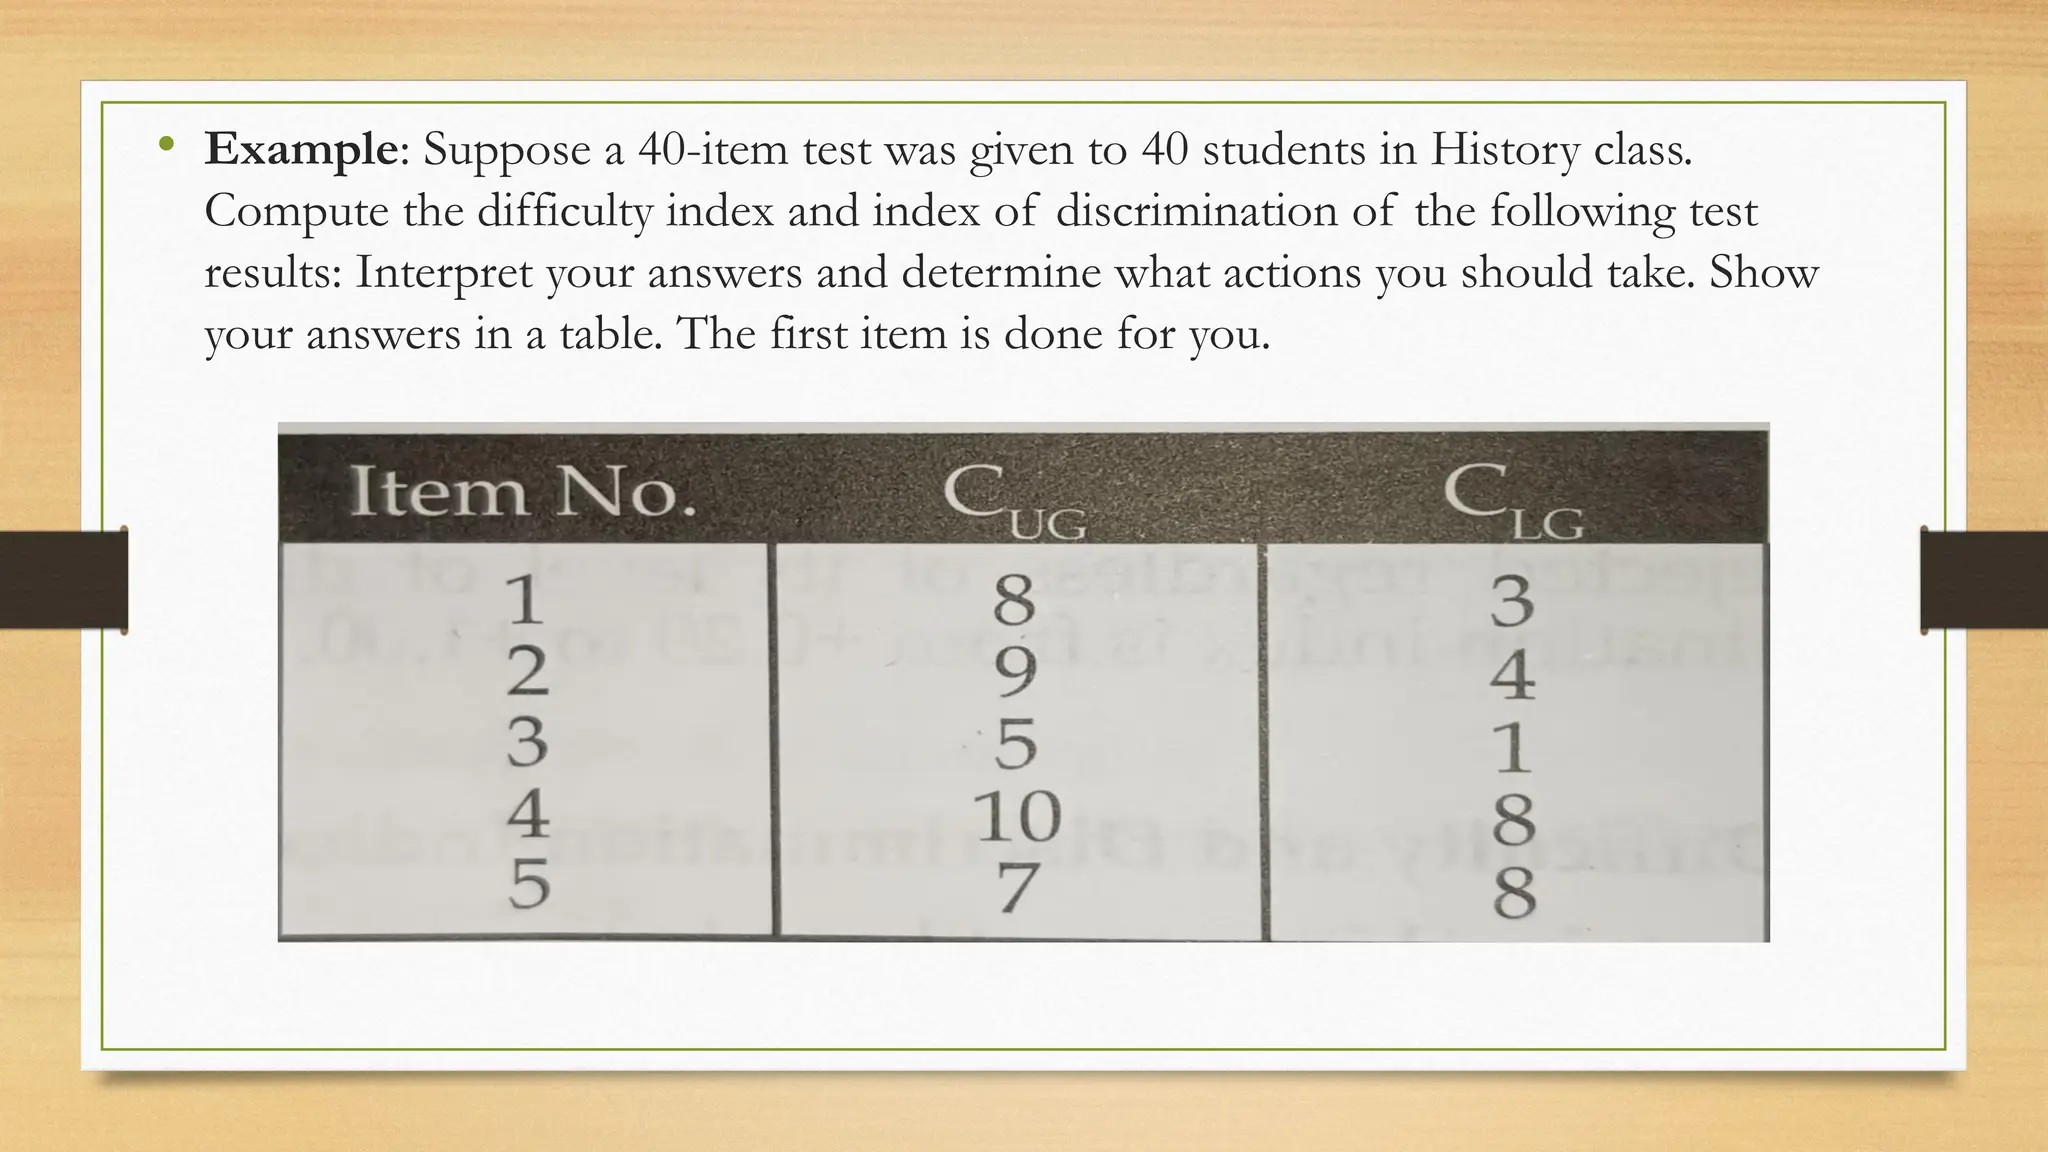
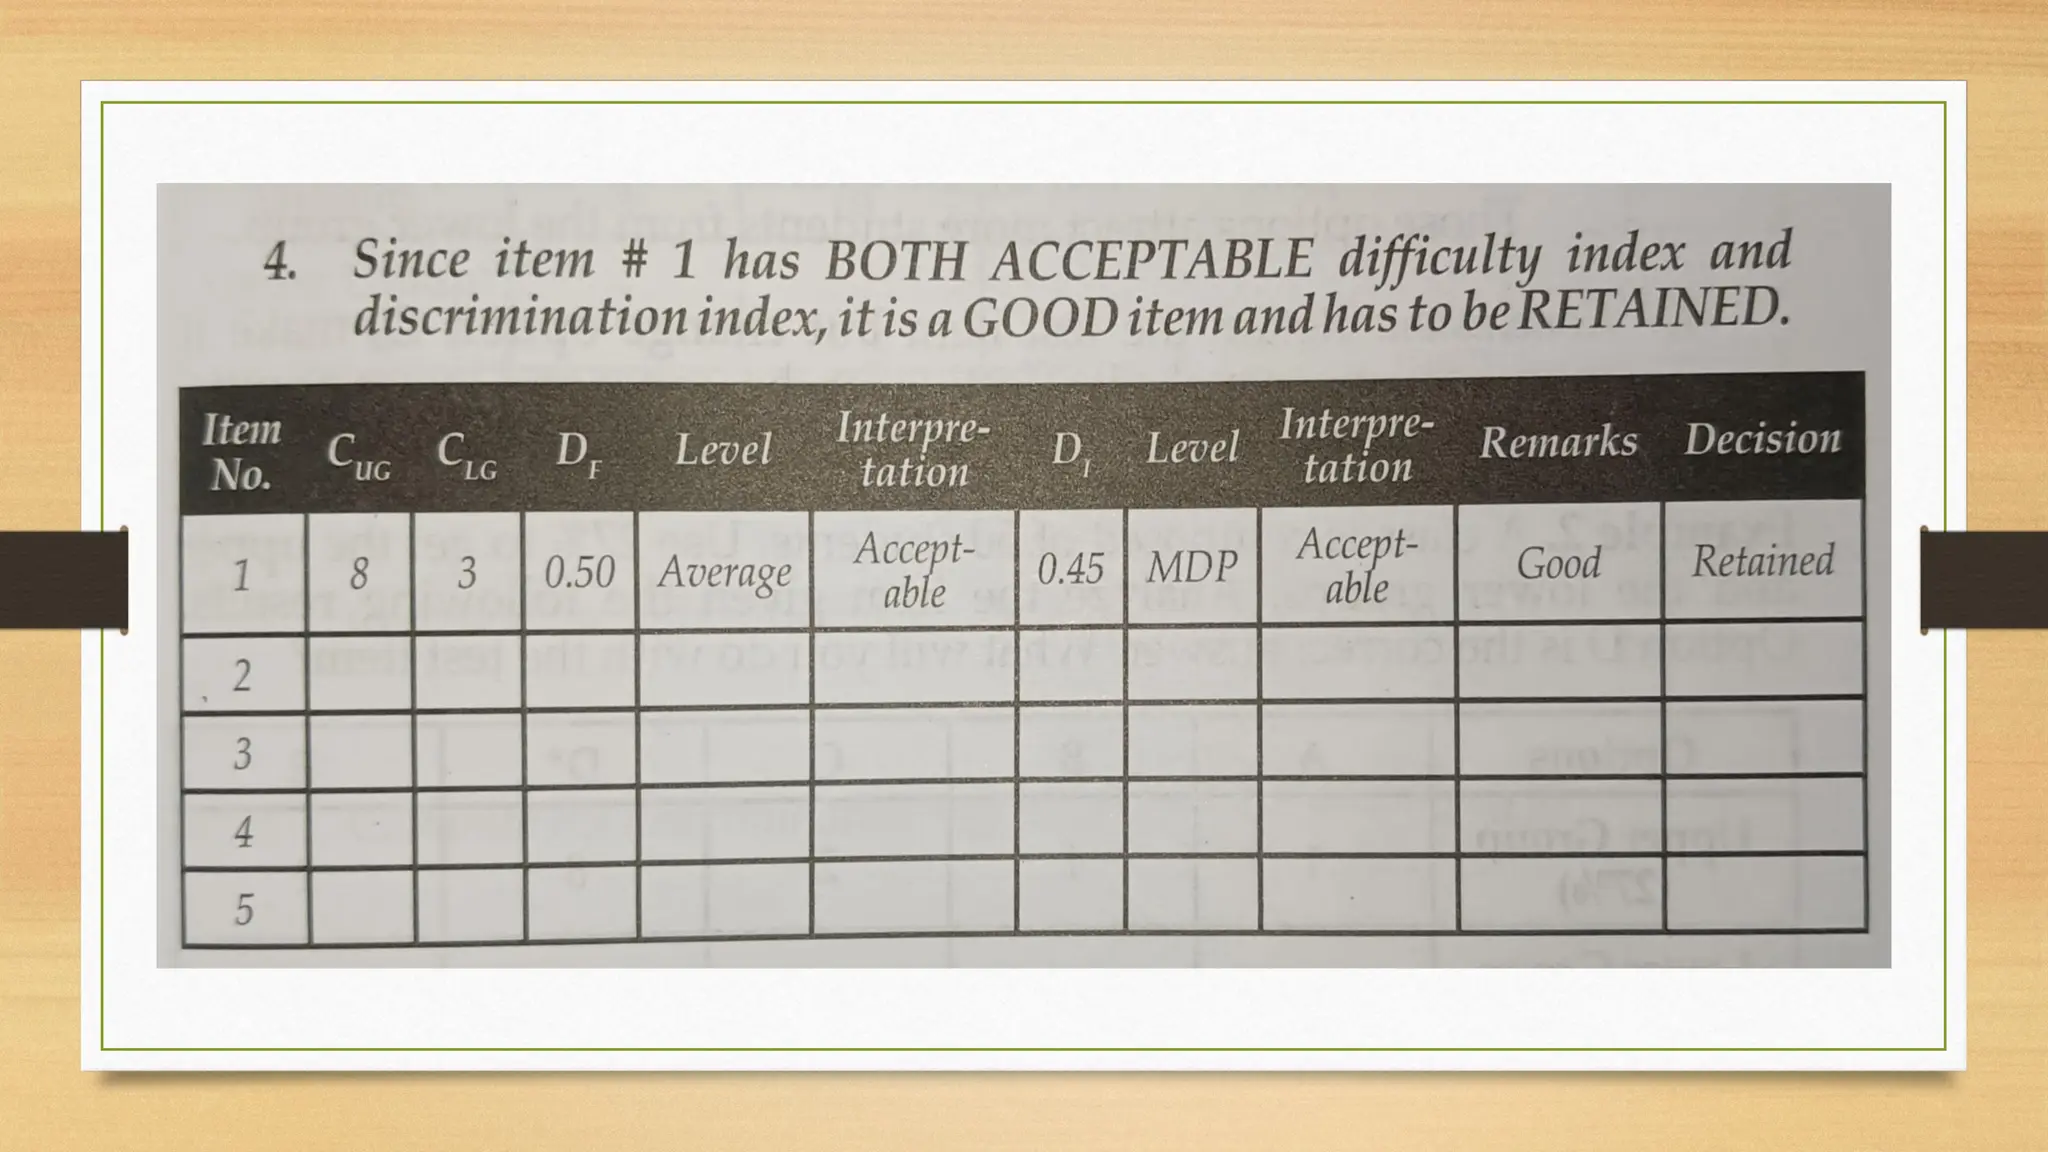
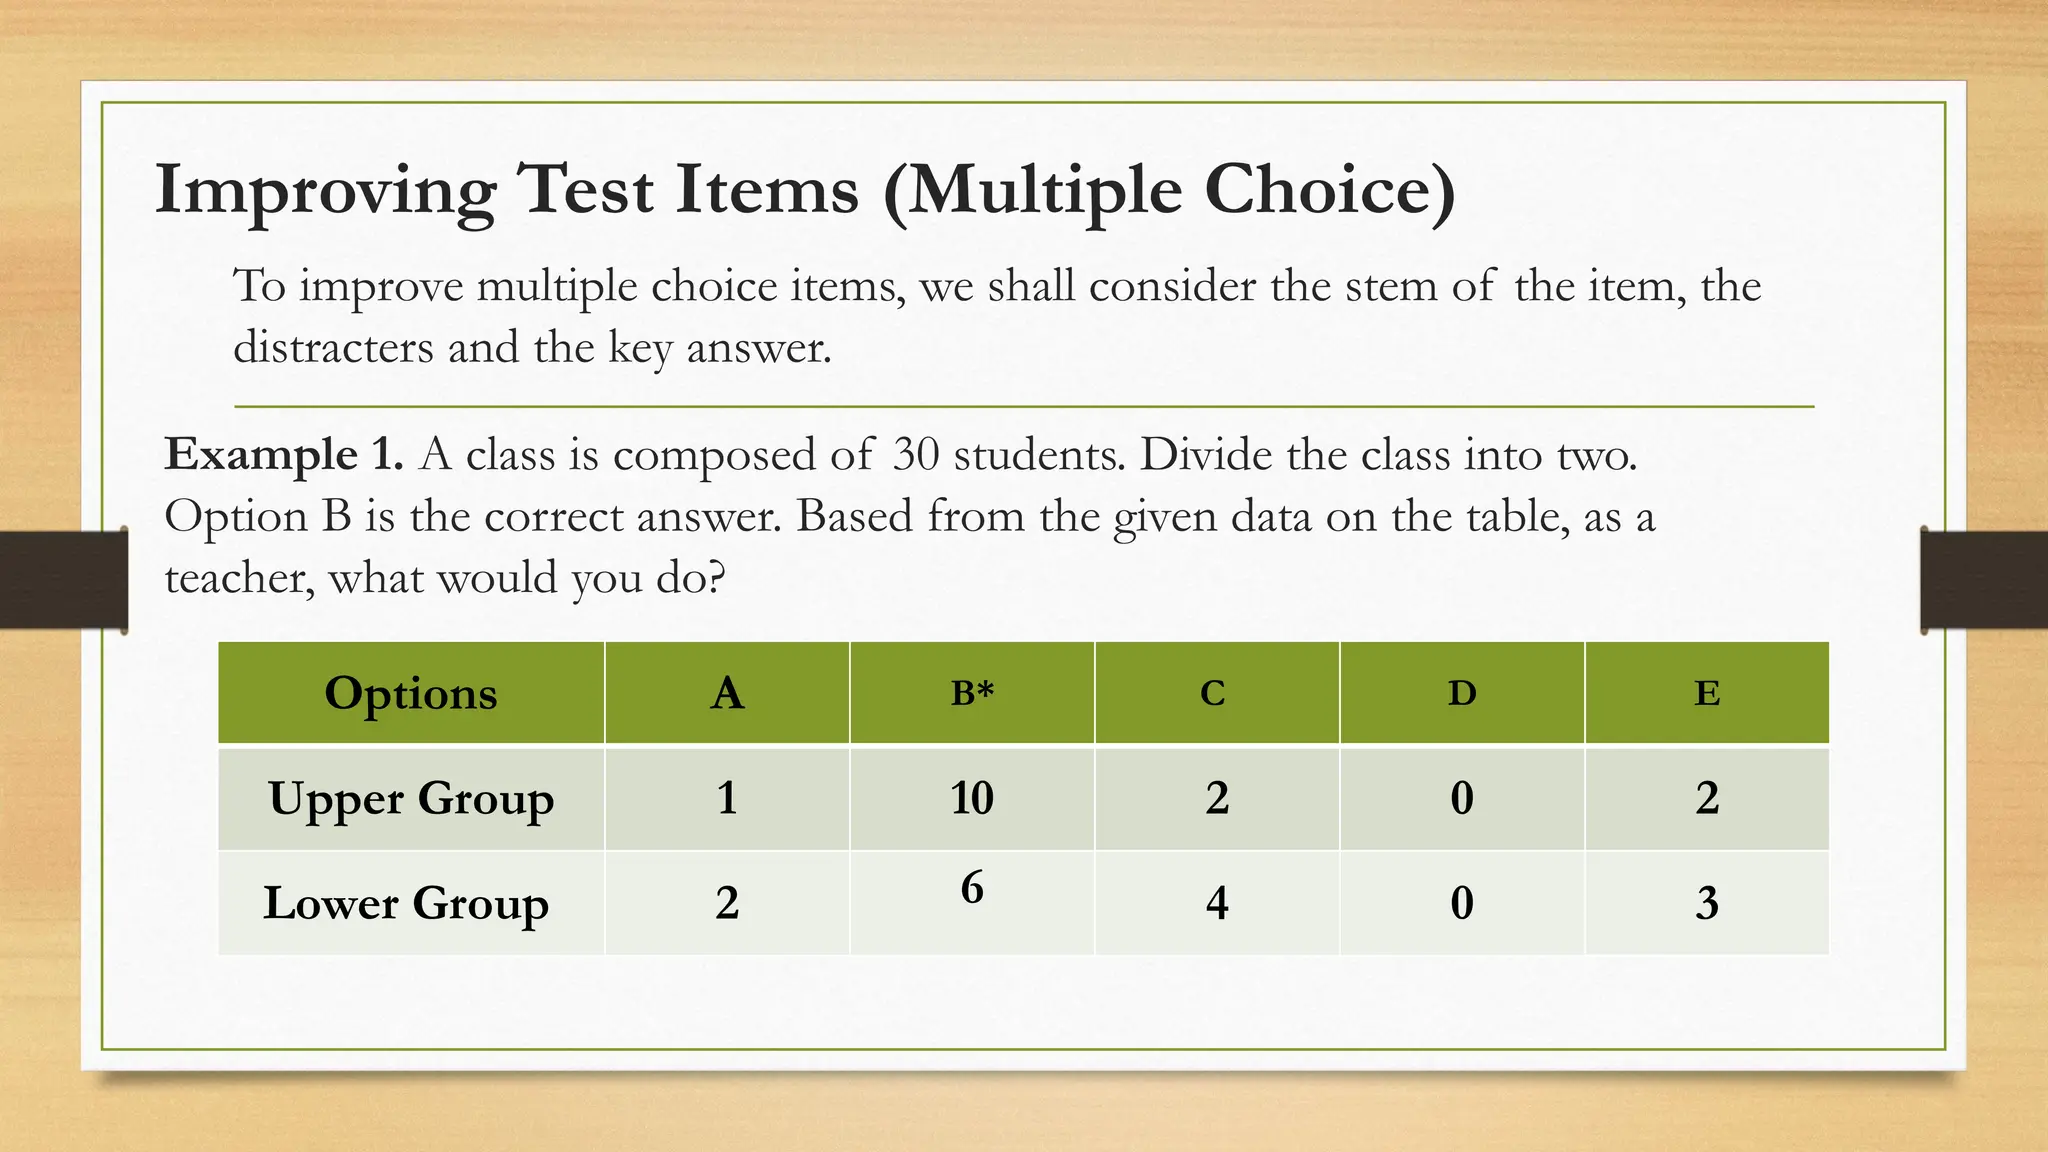
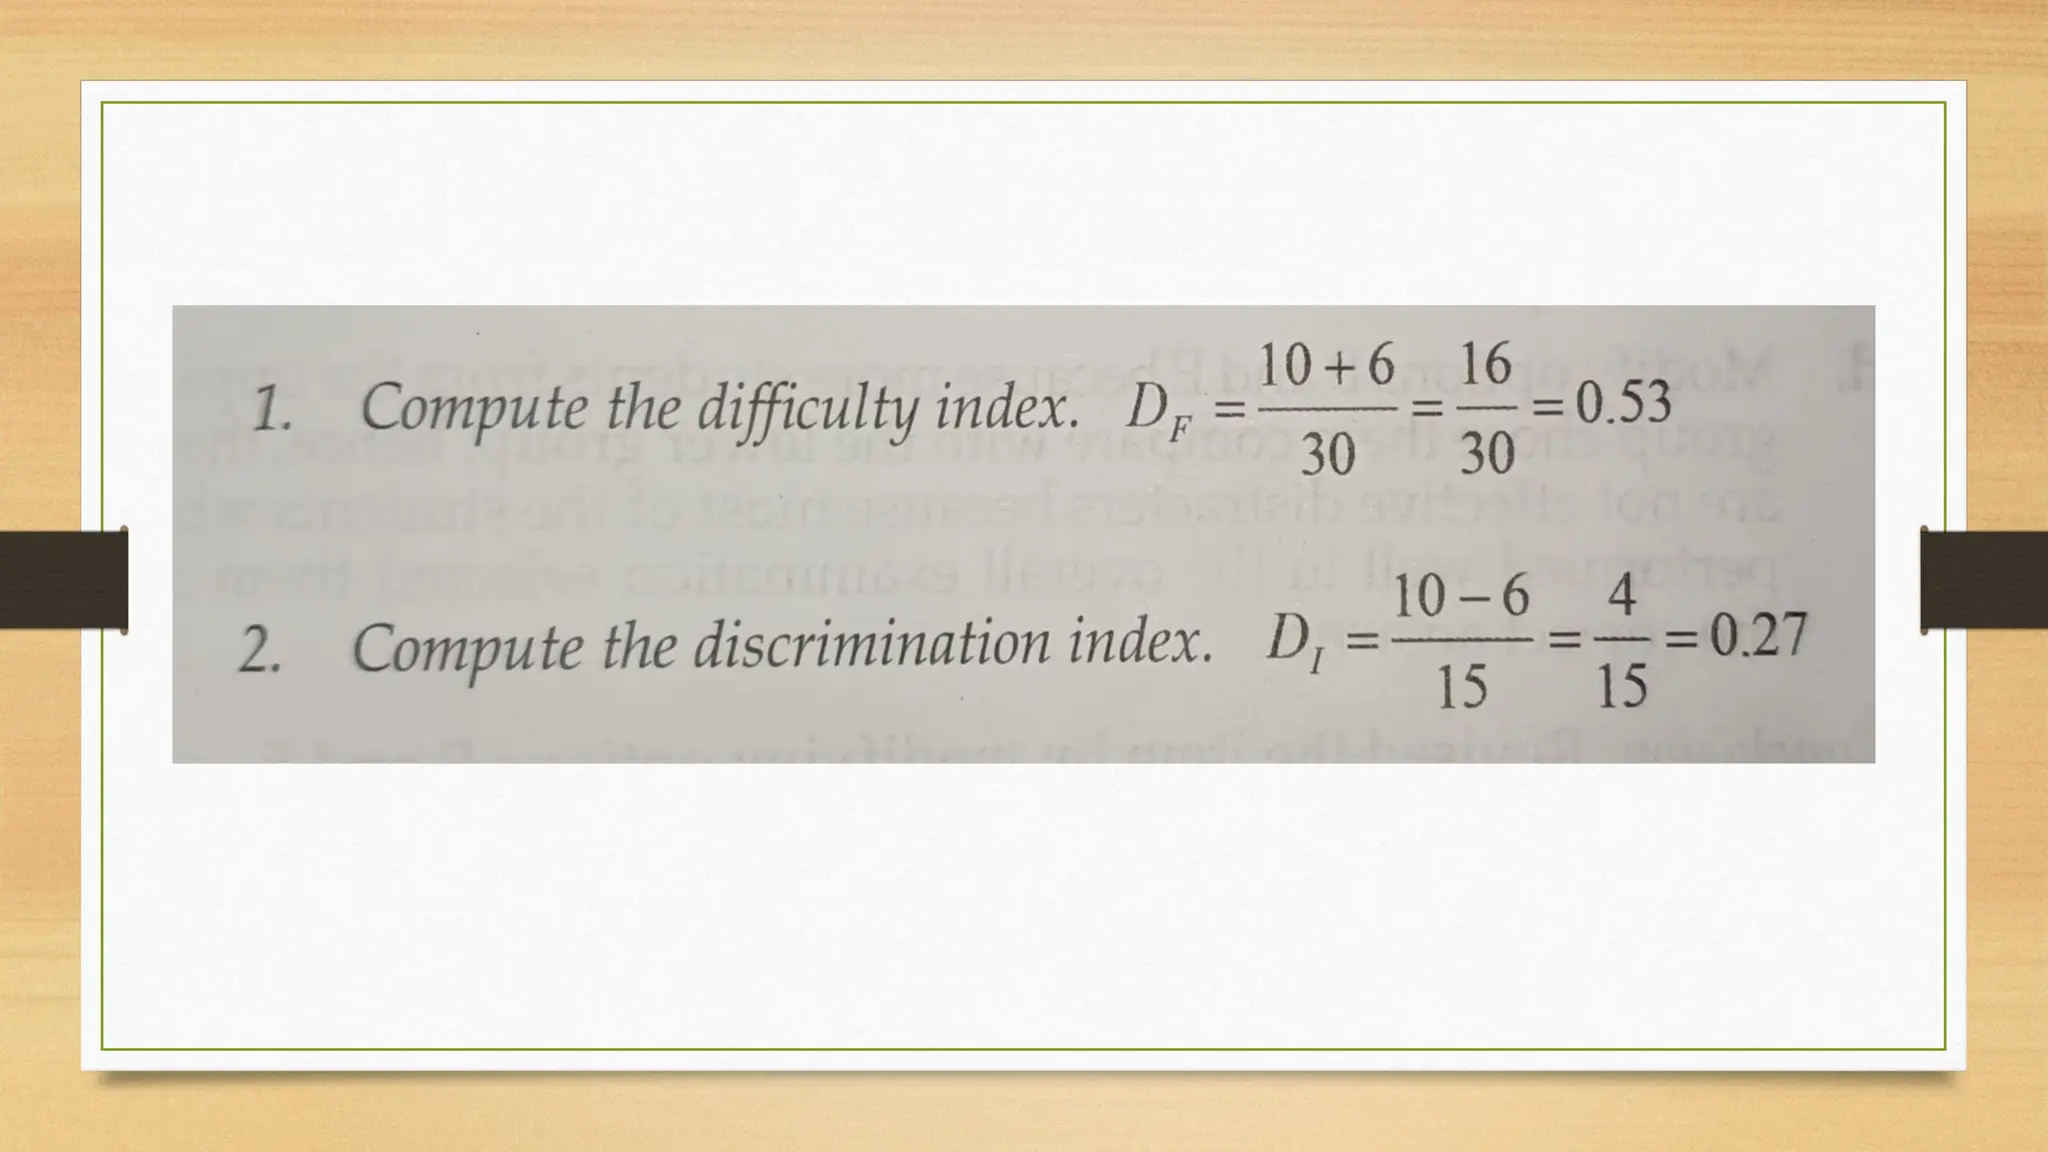
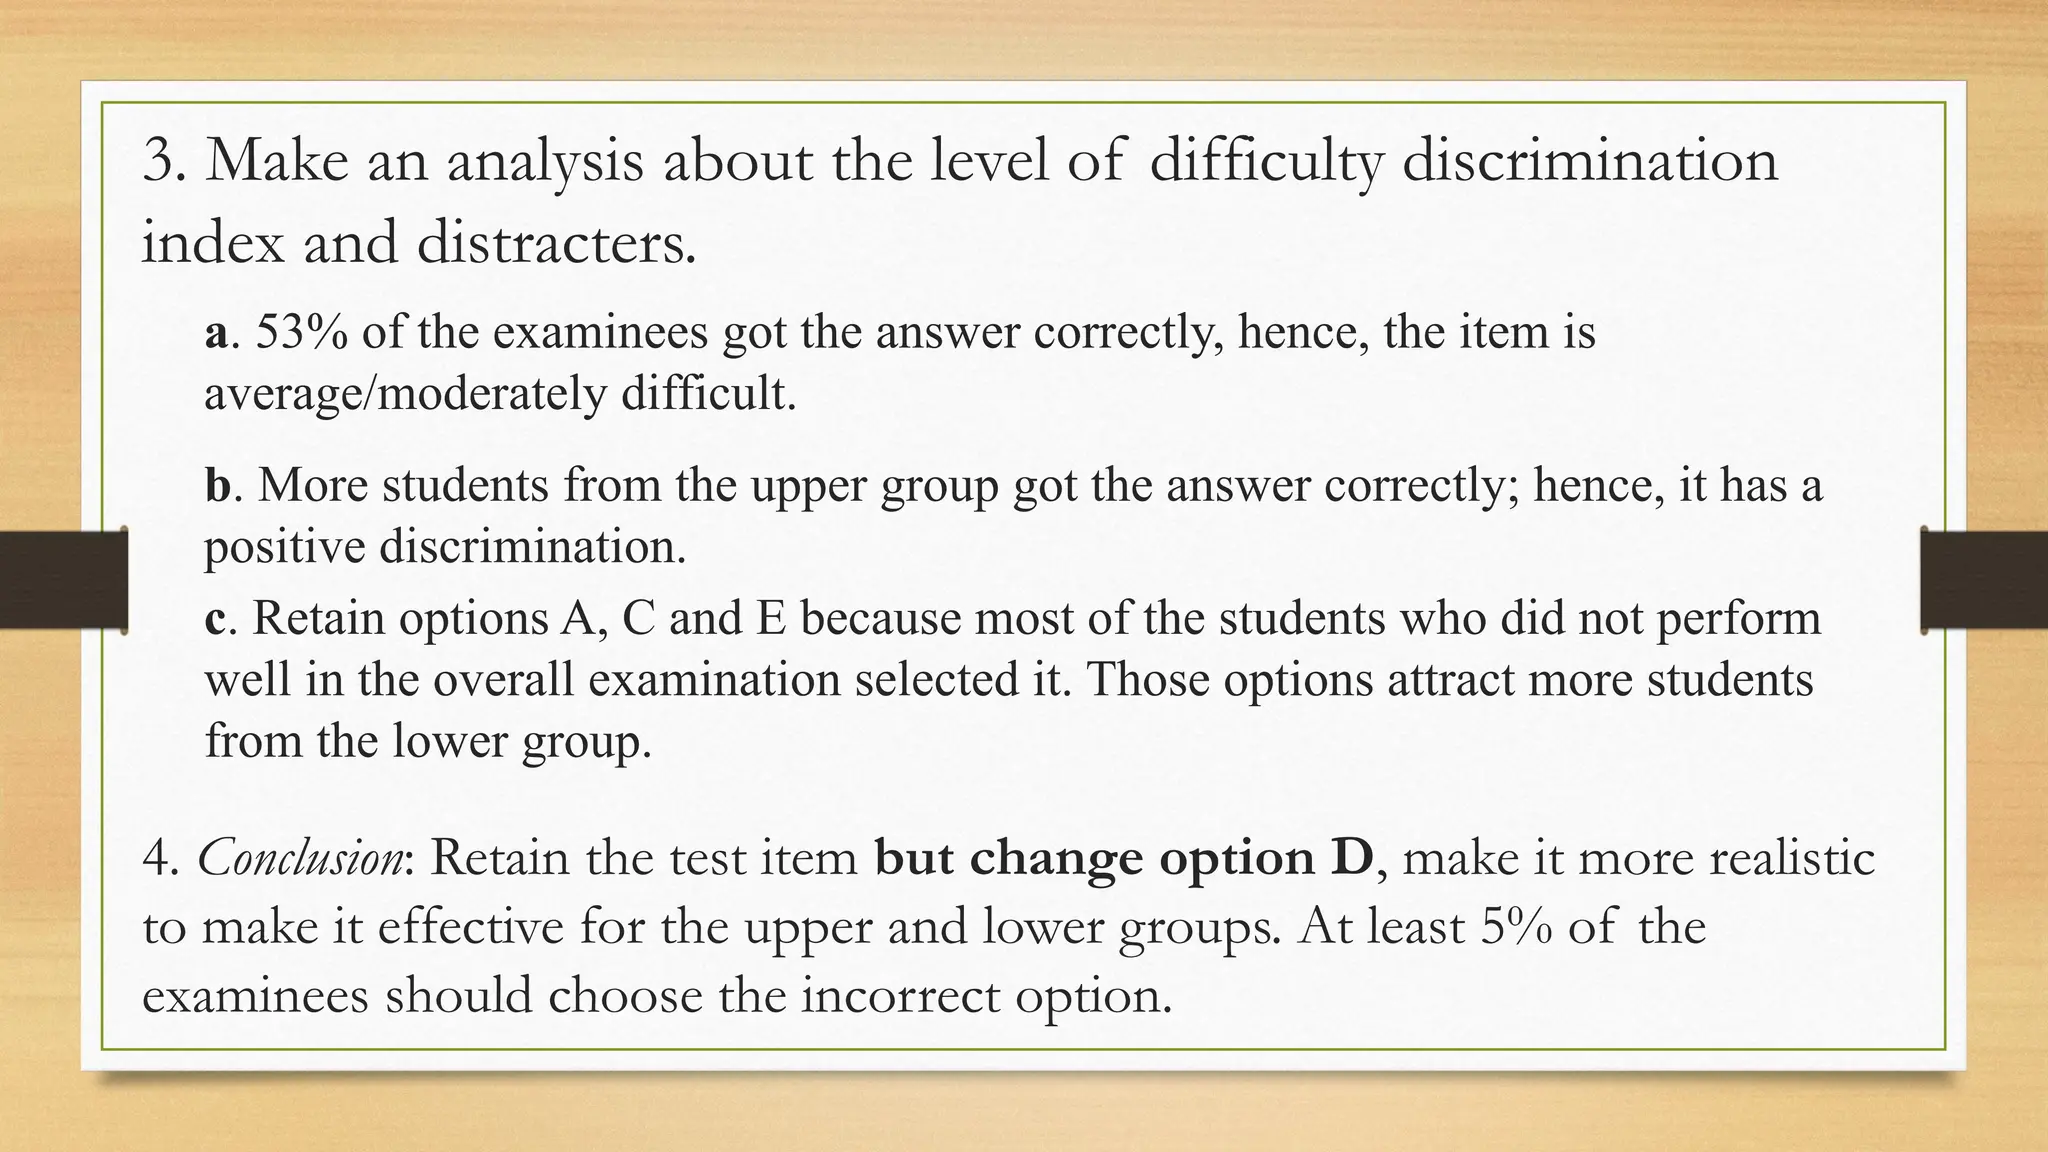
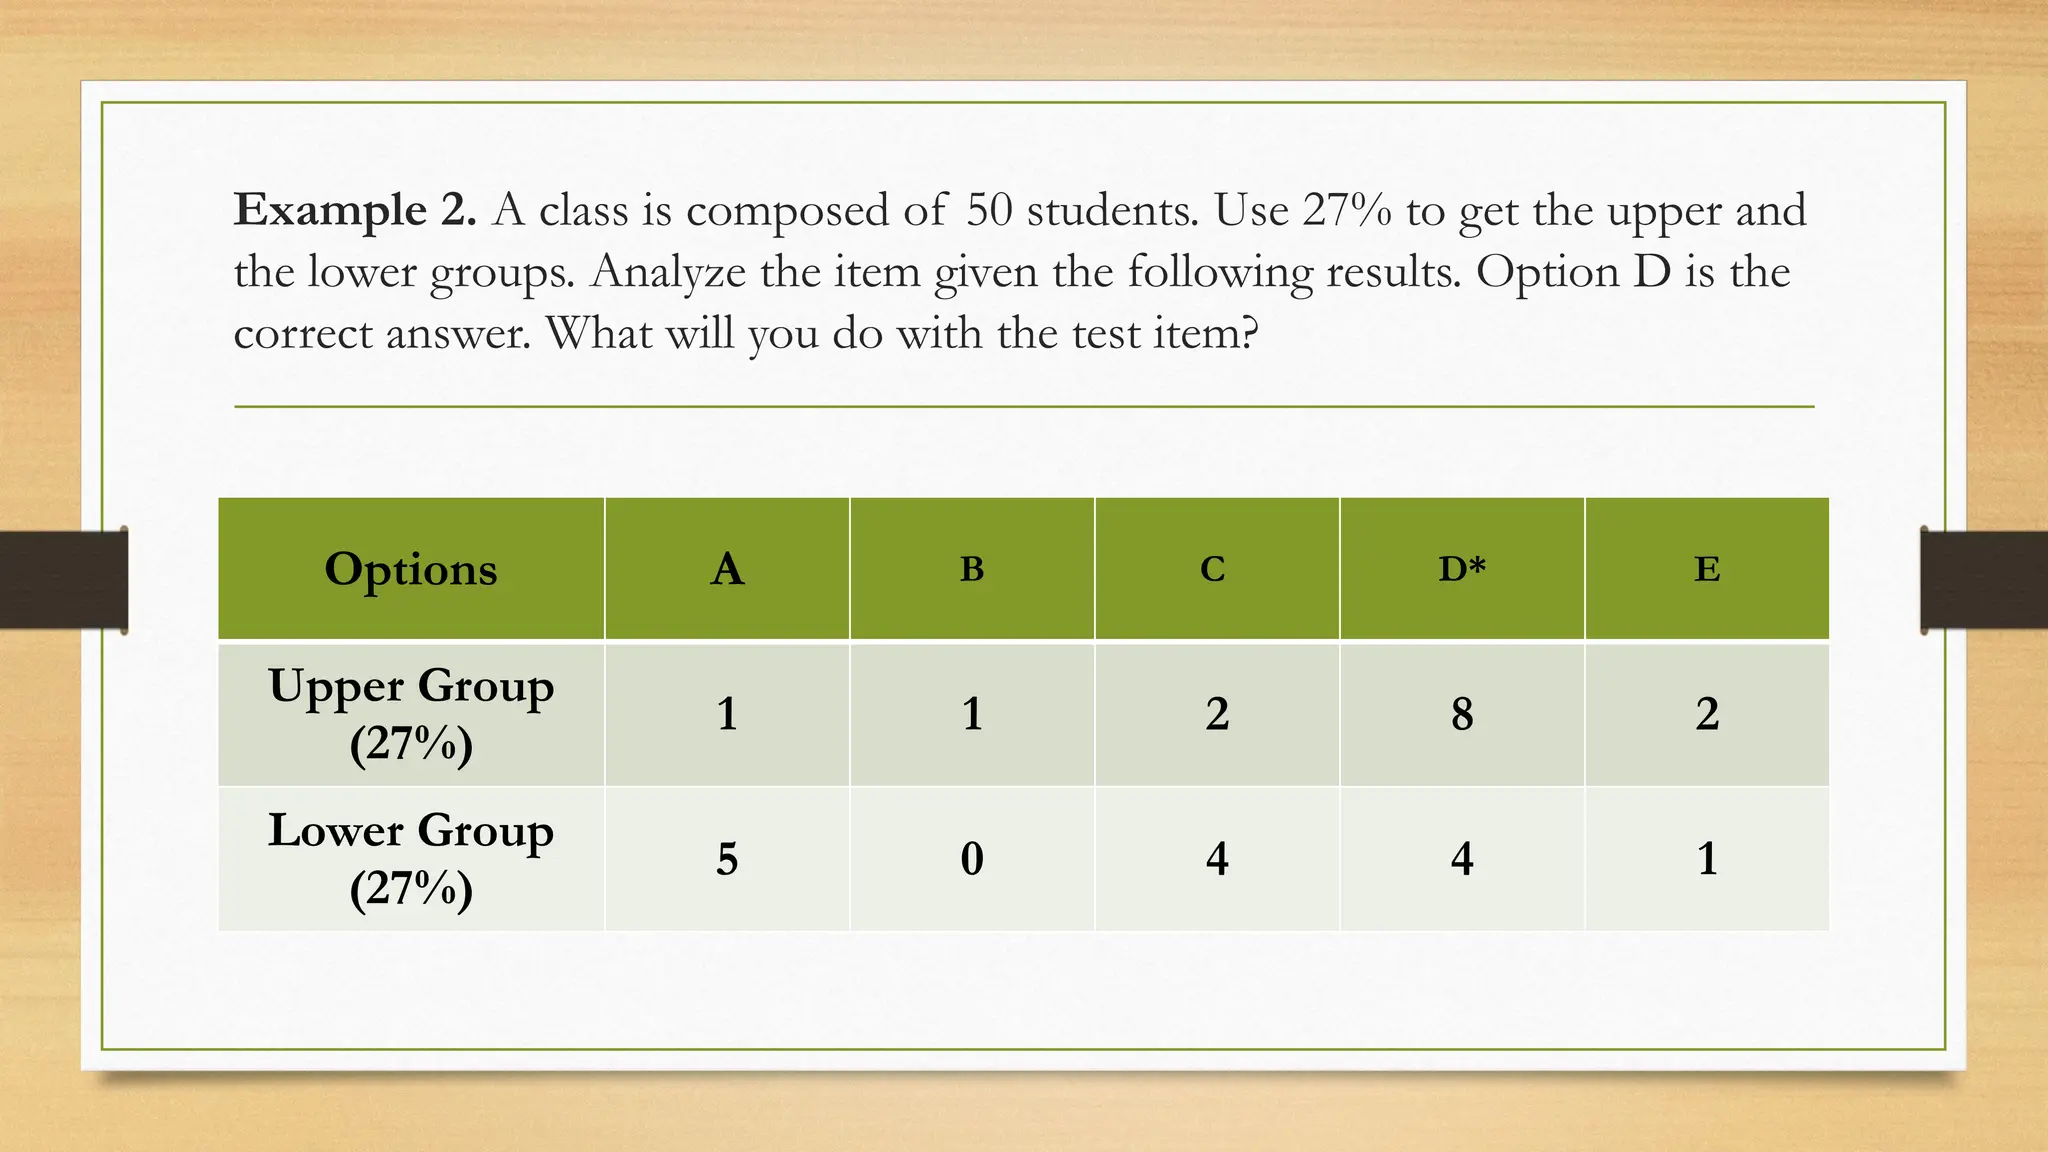
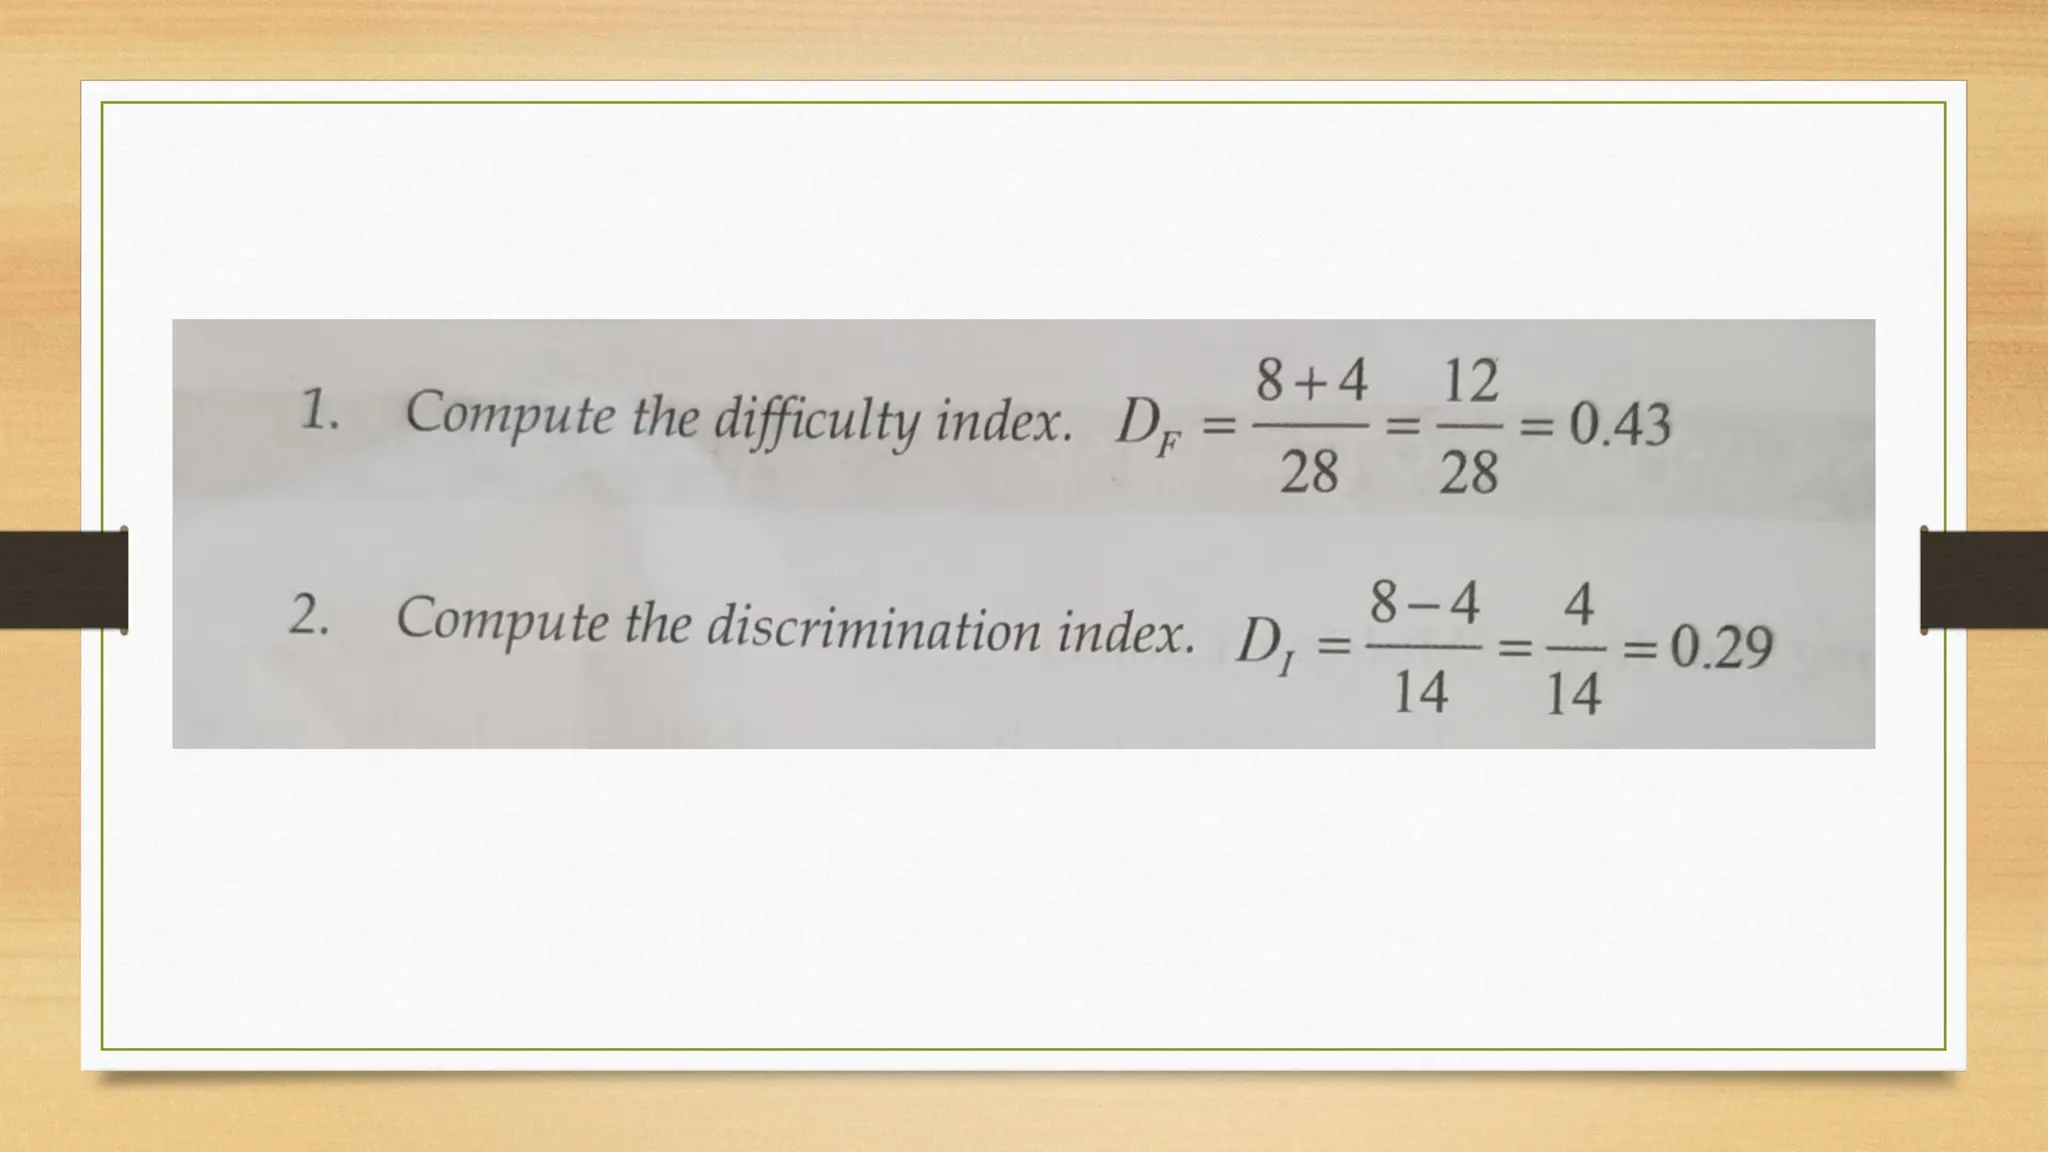
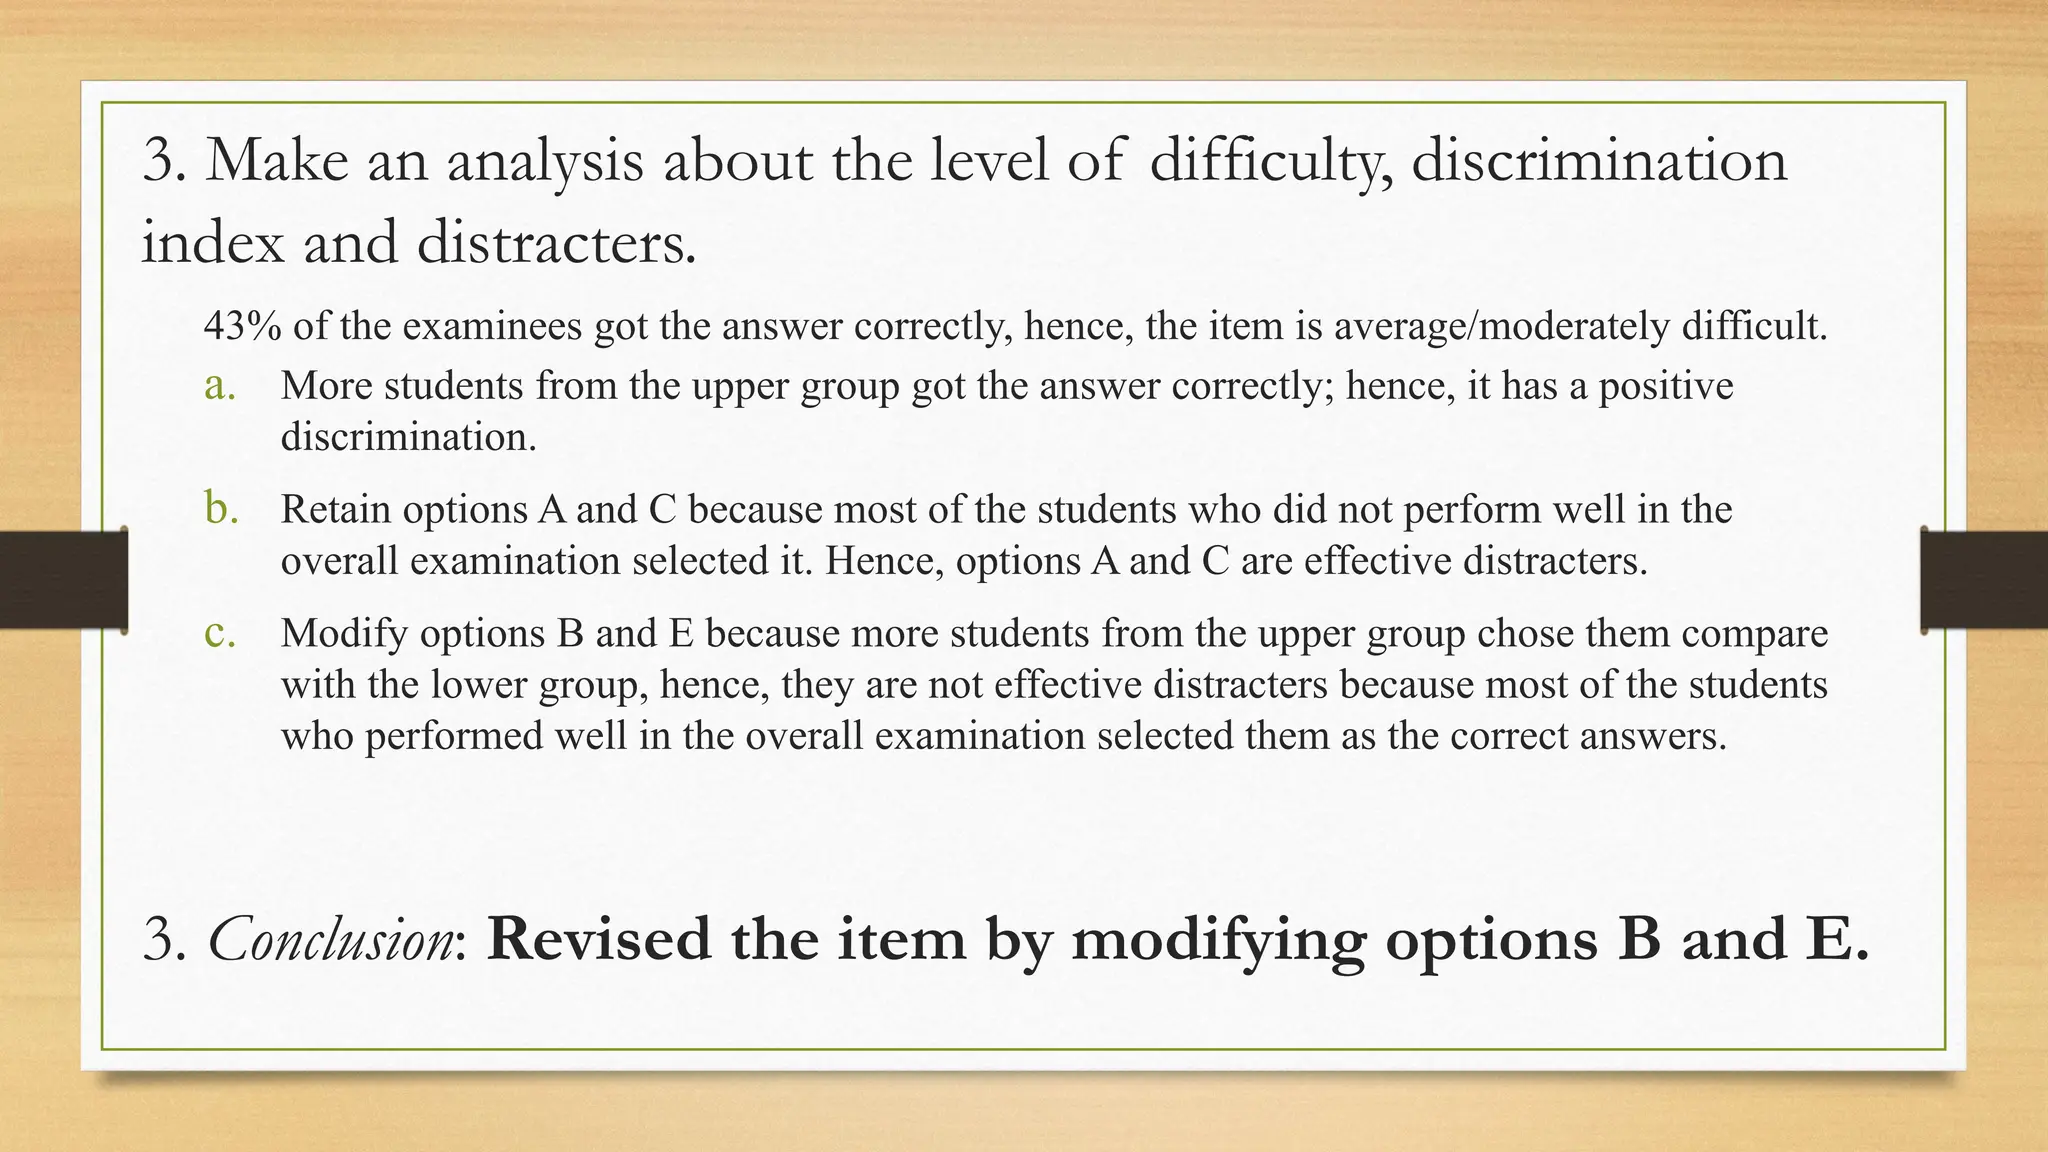
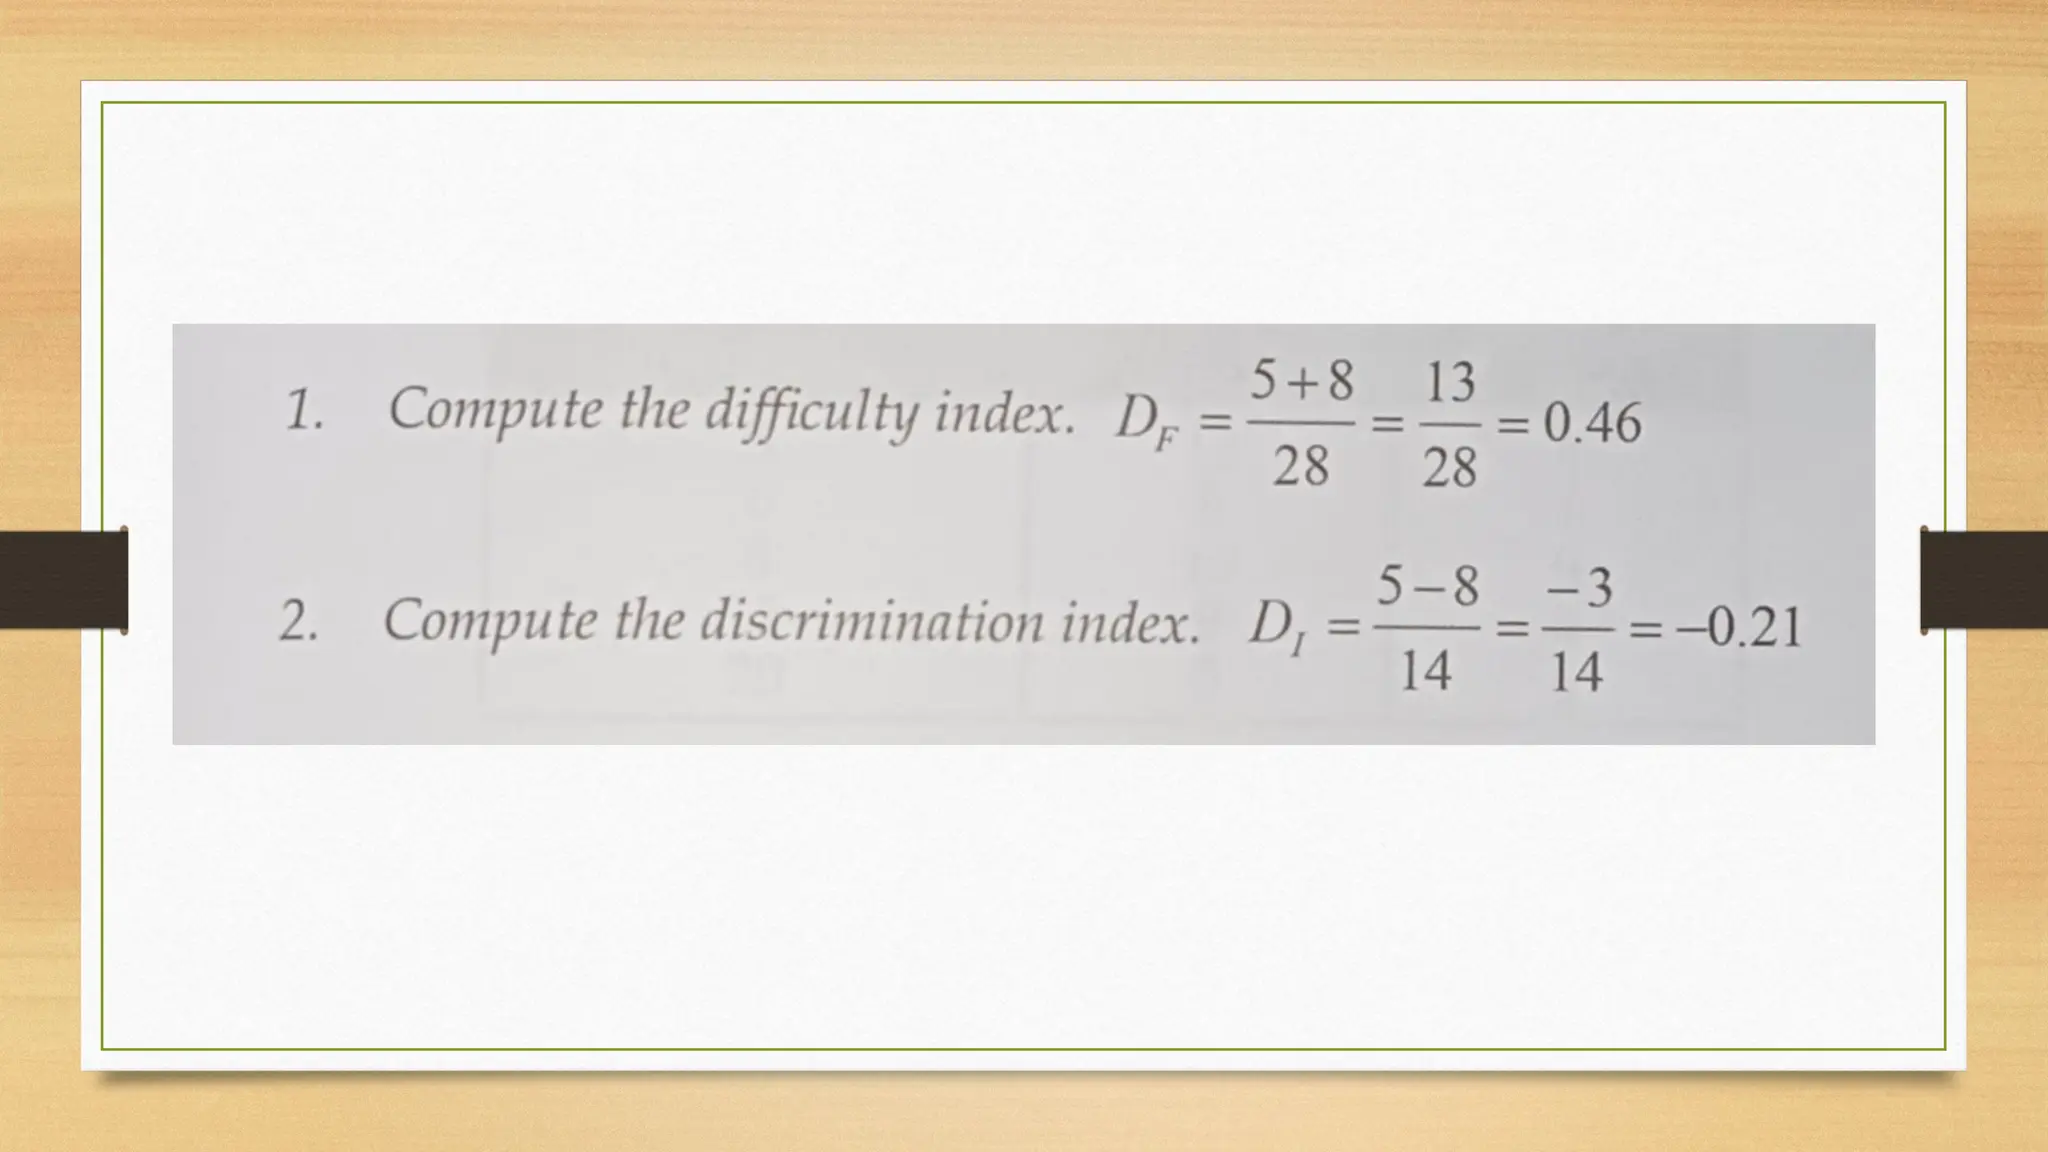
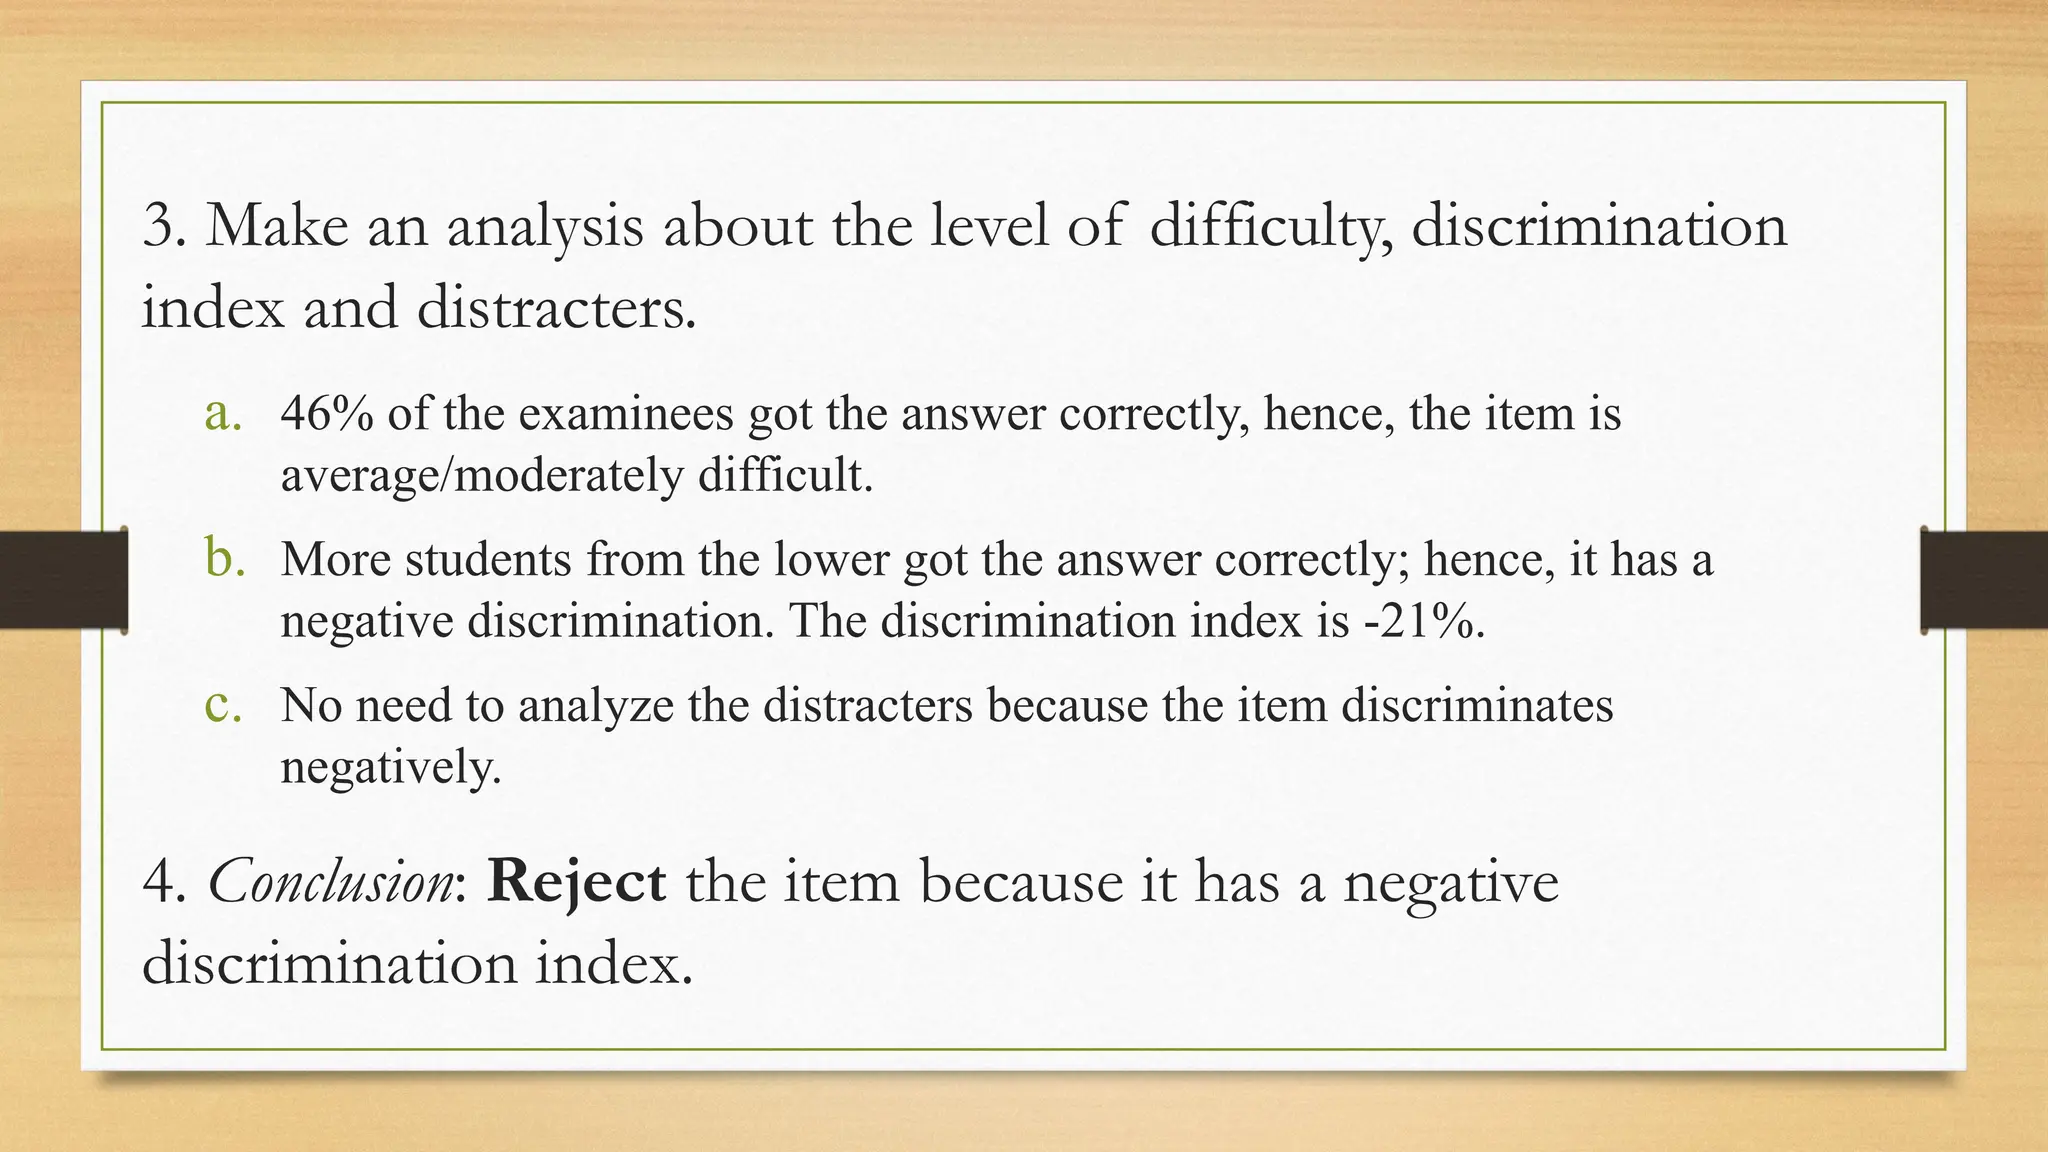
1 14 1 12 25 26 9 14 7
ANALYZING
6 15 18 13 21 12 1
FORMULA
4 9 6 6 9 3 21 12 20
DIFFICULT
4 9 19 3 18 9 13 9 14 1 20 9 15 14
DISCRIMINATION
9 14 4 5 24
INDEX
Analyzing
Formula
Difficult
Discrimination
• Index
𝐷𝑓 =
𝐶𝑈𝐺 − 𝐶𝐿𝐺
𝑛
𝐷𝐼 =
𝐶𝑈𝐺 − 𝐶 𝐿𝐺
𝑛
Chapter
6:
Administering,
Analyzing,
Analyzing, and
Improving Test
Item
Packaging and Reproducing the test
Administering the Examination
Analyzing the Test
Improving Test Items
LESSON:
LEARNING OBJECTIVES:
At the end of the lesson, the learners should be able to;
1. Define the basic concepts regarding item Analysis
2. Differentiate two types of item Analysis.
3. Identify the Difficulty and Discrimination index and
its purpose
LESSON 3:
ANALYZING THE
TEST
Item Analysis - A process which examines
student responses to individual
test items (questions) in order to
assess the quality of those items
and of the test as a whole
Uses of Item Analysis
1. Item analysis data provide a basis for
efficient class discussion of the test results.
2. Item analysis data provide a basis for
remedial work
3. Item analysis data provide a basis for general
improvement of classroom instruction
4. Item analysis data provide a basis for
increased skill in test construction
5. Item analysis procedures provide a basis for
constructing test bank.
Two Types of Item Analysis
2. Quantitative Item Analysis
- It provides the following:
a. the difficulty of the item
b. the discriminating power of the item
c. The effectiveness of each alternative (for multiple choice type of test)
2. Qualitative Item Analysis
- a process in which the teacher or expert carefully proofreads the test
before it is administered, to check if there are typographical errors, to avoid
grammatical clues that may lead to giving away the correct answer, and to
ensure that the level of reading materials is appropriate.
𝐷𝑓 =
𝐶𝑈𝐺 − 𝐶𝐿𝐺
𝑛
Level of Difficulty of an Item
The computed difficulty index can be interpreted using the scale below:
0.00 – 0.20 Very Difficult Item
0.21 – 0.40 Difficult Item
0.41 – 0.60 Average/ Moderately Difficult Item
0.61 – 0.80 Easy Item
0.81 – 1.00 Very Easy Item
Level
Range of Difficulty Index
The higher the value of the difficulty index, the easier the item is. The
acceptable difficulty index ranges from 0.41 -0.60 (moderate) only.
𝐷𝐼 =
𝐶𝑈𝐺 − 𝐶 𝐿𝐺
𝑛
Level of Discrimination Index
-1.00 to – 0.01 Questionable Item
0.00 No Discriminating Power
0.01 – 0.19 Very Low Discriminating Power
0.20 – 0.40 Low Discriminating Power
0.41 – 0.60 Moderately Discriminating Power
0.61 – 1.00 Very High Discriminating Power
Level
Range of Index of Discrimination
If the discrimination index is negative, that means the item is automatically rejected
regardless of its level of difficulty. The only acceptable discrimination index is from
+0.20 to +1.00.
Interpretation of Difficulty
and Discrimination Indices
A good or retained item must have both acceptable indices.
A fair or revised item contains either unacceptable index.
A poor or rejected/discarded item must possess both
unacceptable indices.
Difficulty Index
Index of
Discrimination
Remarks Action
Acceptable Acceptable Good Retain
Acceptable Not Acceptable Fair Revise/Improve
Not Acceptable Acceptable Fair Revise/Improve
Not Acceptable Not Acceptable Poor Reject/Discard
Steps in Item Analysis (U-L Method)
1. Arrange the scores from highest to lowest.
2. Separate the scores into upper and lower group. If a class consist of 30 students (or below)
who took the exam, divide them into two groups. The first half comprises the Upper Group
(UG) while the other half is the Lower Group (LG). If the students are more than 30, get the
top 27% and the lowest 27% and named them as Upper Group (UG) and Lower Group (LG)
respectively.
3. Compute the index of difficulty for each item then describe the level of difficulty as very
easy, easy, average, difficult, or very difficult. Then indicate whether it is acceptable or not.
4. Compute the index of discrimination for each item then describe its power to discriminate.
Then indicate whether it is acceptable or not.
5. Interpret the results whether the item is good, fair or poor.
• 6. Indicate the necessary action if it is to be retained, revised or rejected.
• Example: Suppose a 40-item test was given to 40 students in History class.
Compute the difficulty index and index of discrimination of the following test
results: Interpret your answers and determine what actions you should take. Show
your answers in a table. The first item is done for you.
Solution:
1.Since there are more than 30 students in the class, get the 27% of the total number of students to
determine the number of students who are included in the item analysis. Round off your answer to
nearest whole number. In the above example, 27 x 40 = 10.8 11. It means that 11 students from the
Upper Group and another 11 from the Lower group for a total of 22 students will be involved in the
item analysis.
2. Compute the difficulty index then interpret:
3. Compute the index of discrimination then interpret.
LESSON 4:
IMPROVING TEST
ITEM
Improving Test Items (Multiple Choice)
To improve multiple choice items, we shall consider the stem of the item, the
distracters and the key answer.
Example 1. A class is composed of 30 students. Divide the class into two.
Option B is the correct answer. Based from the given data on the table, as a
teacher, what would you do?
Options A B* C D E
Upper Group 1 10 2 0 2
Lower Group 2 6 4 0 3
3. Make an analysis about the level of difficulty discrimination
index and distracters.
a. 53% of the examinees got the answer correctly, hence, the item is
average/moderately difficult.
b. More students from the upper group got the answer correctly; hence, it has a
positive discrimination.
c. Retain options A, C and E because most of the students who did not perform
well in the overall examination selected it. Those options attract more students
from the lower group.
4. Conclusion: Retain the test item but change option D, make it more realistic
to make it effective for the upper and lower groups. At least 5% of the
examinees should choose the incorrect option.
Example 2. A class is composed of 50 students. Use 27% to get the upper and
the lower groups. Analyze the item given the following results. Option D is the
correct answer. What will you do with the test item?
Options A B C D* E
Upper Group
(27%)
1 1 2 8 2
Lower Group
(27%)
5 0 4 4 1
3. Make an analysis about the level of difficulty, discrimination
index and distracters.
43% of the examinees got the answer correctly, hence, the item is average/moderately difficult.
a. More students from the upper group got the answer correctly; hence, it has a positive
discrimination.
b. Retain options A and C because most of the students who did not perform well in the
overall examination selected it. Hence, options A and C are effective distracters.
c. Modify options B and E because more students from the upper group chose them compare
with the lower group, hence, they are not effective distracters because most of the students
who performed well in the overall examination selected them as the correct answers.
3. Conclusion: Revised the item by modifying options B and E.
Example 3. A class is composed of 50 students. Use 27% to get the upper and
the lower groups. Analyze the item given the following results. Option E is the
correct answer. What will you do with the test item?
Options A B C D E*
Upper Group
(27%)
2 3 2 2 5
Lower Group
(27%)
2 2 1 1 8
3. Make an analysis about the level of difficulty, discrimination
index and distracters.
a. 46% of the examinees got the answer correctly, hence, the item is
average/moderately difficult.
b. More students from the lower got the answer correctly; hence, it has a
negative discrimination. The discrimination index is -21%.
c. No need to analyze the distracters because the item discriminates
negatively.
4. Conclusion: Reject the item because it has a negative
discrimination index.
Chapter 6: Administering, Analyzing and Improving Tests Lesson 3 & 4

Chapter 6: Administering, Analyzing and Improving Tests Lesson 3 & 4

  • 3.
    1 14 112 25 26 9 14 7 ANALYZING
  • 4.
    6 15 1813 21 12 1 FORMULA
  • 5.
    4 9 66 9 3 21 12 20 DIFFICULT
  • 6.
    4 9 193 18 9 13 9 14 1 20 9 15 14 DISCRIMINATION
  • 7.
    9 14 45 24 INDEX
  • 8.
  • 10.
    𝐷𝑓 = 𝐶𝑈𝐺 −𝐶𝐿𝐺 𝑛 𝐷𝐼 = 𝐶𝑈𝐺 − 𝐶 𝐿𝐺 𝑛
  • 11.
    Chapter 6: Administering, Analyzing, Analyzing, and Improving Test Item Packagingand Reproducing the test Administering the Examination Analyzing the Test Improving Test Items LESSON:
  • 12.
    LEARNING OBJECTIVES: At theend of the lesson, the learners should be able to; 1. Define the basic concepts regarding item Analysis 2. Differentiate two types of item Analysis. 3. Identify the Difficulty and Discrimination index and its purpose
  • 13.
  • 14.
    Item Analysis -A process which examines student responses to individual test items (questions) in order to assess the quality of those items and of the test as a whole
  • 15.
    Uses of ItemAnalysis 1. Item analysis data provide a basis for efficient class discussion of the test results. 2. Item analysis data provide a basis for remedial work 3. Item analysis data provide a basis for general improvement of classroom instruction 4. Item analysis data provide a basis for increased skill in test construction 5. Item analysis procedures provide a basis for constructing test bank.
  • 16.
    Two Types ofItem Analysis 2. Quantitative Item Analysis - It provides the following: a. the difficulty of the item b. the discriminating power of the item c. The effectiveness of each alternative (for multiple choice type of test) 2. Qualitative Item Analysis - a process in which the teacher or expert carefully proofreads the test before it is administered, to check if there are typographical errors, to avoid grammatical clues that may lead to giving away the correct answer, and to ensure that the level of reading materials is appropriate.
  • 17.
    𝐷𝑓 = 𝐶𝑈𝐺 −𝐶𝐿𝐺 𝑛
  • 18.
    Level of Difficultyof an Item The computed difficulty index can be interpreted using the scale below: 0.00 – 0.20 Very Difficult Item 0.21 – 0.40 Difficult Item 0.41 – 0.60 Average/ Moderately Difficult Item 0.61 – 0.80 Easy Item 0.81 – 1.00 Very Easy Item Level Range of Difficulty Index The higher the value of the difficulty index, the easier the item is. The acceptable difficulty index ranges from 0.41 -0.60 (moderate) only.
  • 19.
    𝐷𝐼 = 𝐶𝑈𝐺 −𝐶 𝐿𝐺 𝑛
  • 21.
    Level of DiscriminationIndex -1.00 to – 0.01 Questionable Item 0.00 No Discriminating Power 0.01 – 0.19 Very Low Discriminating Power 0.20 – 0.40 Low Discriminating Power 0.41 – 0.60 Moderately Discriminating Power 0.61 – 1.00 Very High Discriminating Power Level Range of Index of Discrimination If the discrimination index is negative, that means the item is automatically rejected regardless of its level of difficulty. The only acceptable discrimination index is from +0.20 to +1.00.
  • 22.
    Interpretation of Difficulty andDiscrimination Indices A good or retained item must have both acceptable indices. A fair or revised item contains either unacceptable index. A poor or rejected/discarded item must possess both unacceptable indices.
  • 23.
    Difficulty Index Index of Discrimination RemarksAction Acceptable Acceptable Good Retain Acceptable Not Acceptable Fair Revise/Improve Not Acceptable Acceptable Fair Revise/Improve Not Acceptable Not Acceptable Poor Reject/Discard
  • 24.
    Steps in ItemAnalysis (U-L Method) 1. Arrange the scores from highest to lowest. 2. Separate the scores into upper and lower group. If a class consist of 30 students (or below) who took the exam, divide them into two groups. The first half comprises the Upper Group (UG) while the other half is the Lower Group (LG). If the students are more than 30, get the top 27% and the lowest 27% and named them as Upper Group (UG) and Lower Group (LG) respectively. 3. Compute the index of difficulty for each item then describe the level of difficulty as very easy, easy, average, difficult, or very difficult. Then indicate whether it is acceptable or not. 4. Compute the index of discrimination for each item then describe its power to discriminate. Then indicate whether it is acceptable or not. 5. Interpret the results whether the item is good, fair or poor. • 6. Indicate the necessary action if it is to be retained, revised or rejected.
  • 25.
    • Example: Supposea 40-item test was given to 40 students in History class. Compute the difficulty index and index of discrimination of the following test results: Interpret your answers and determine what actions you should take. Show your answers in a table. The first item is done for you.
  • 26.
    Solution: 1.Since there aremore than 30 students in the class, get the 27% of the total number of students to determine the number of students who are included in the item analysis. Round off your answer to nearest whole number. In the above example, 27 x 40 = 10.8 11. It means that 11 students from the Upper Group and another 11 from the Lower group for a total of 22 students will be involved in the item analysis. 2. Compute the difficulty index then interpret: 3. Compute the index of discrimination then interpret.
  • 28.
  • 29.
    Improving Test Items(Multiple Choice) To improve multiple choice items, we shall consider the stem of the item, the distracters and the key answer. Example 1. A class is composed of 30 students. Divide the class into two. Option B is the correct answer. Based from the given data on the table, as a teacher, what would you do? Options A B* C D E Upper Group 1 10 2 0 2 Lower Group 2 6 4 0 3
  • 31.
    3. Make ananalysis about the level of difficulty discrimination index and distracters. a. 53% of the examinees got the answer correctly, hence, the item is average/moderately difficult. b. More students from the upper group got the answer correctly; hence, it has a positive discrimination. c. Retain options A, C and E because most of the students who did not perform well in the overall examination selected it. Those options attract more students from the lower group. 4. Conclusion: Retain the test item but change option D, make it more realistic to make it effective for the upper and lower groups. At least 5% of the examinees should choose the incorrect option.
  • 32.
    Example 2. Aclass is composed of 50 students. Use 27% to get the upper and the lower groups. Analyze the item given the following results. Option D is the correct answer. What will you do with the test item? Options A B C D* E Upper Group (27%) 1 1 2 8 2 Lower Group (27%) 5 0 4 4 1
  • 34.
    3. Make ananalysis about the level of difficulty, discrimination index and distracters. 43% of the examinees got the answer correctly, hence, the item is average/moderately difficult. a. More students from the upper group got the answer correctly; hence, it has a positive discrimination. b. Retain options A and C because most of the students who did not perform well in the overall examination selected it. Hence, options A and C are effective distracters. c. Modify options B and E because more students from the upper group chose them compare with the lower group, hence, they are not effective distracters because most of the students who performed well in the overall examination selected them as the correct answers. 3. Conclusion: Revised the item by modifying options B and E.
  • 35.
    Example 3. Aclass is composed of 50 students. Use 27% to get the upper and the lower groups. Analyze the item given the following results. Option E is the correct answer. What will you do with the test item? Options A B C D E* Upper Group (27%) 2 3 2 2 5 Lower Group (27%) 2 2 1 1 8
  • 37.
    3. Make ananalysis about the level of difficulty, discrimination index and distracters. a. 46% of the examinees got the answer correctly, hence, the item is average/moderately difficult. b. More students from the lower got the answer correctly; hence, it has a negative discrimination. The discrimination index is -21%. c. No need to analyze the distracters because the item discriminates negatively. 4. Conclusion: Reject the item because it has a negative discrimination index.

Editor's Notes

  • #14 So sa item Analysis, dito inaalam natin ang strengths and weaknesses ng mga students, kung saan sila nahirapan, at kung yung test item ba ay maayos or effective.
  • #15 Malalaman din natin sa pamamagitan ng pag item Analysis kung saang part nahirapan yung students, so sa mga susunod na discussion ay mabibigyan ng focus ng teacher yung parts na yun. Sa after mag Item Analysis so malalaman na yung mga score, so kung maraming mababang score ay need mag remedial. So dito naman nalaman na natin kung saan mas maraming nahirapan na item ang mga student so ibig sabihin sa mga next discussion natin is gagamit na ng mga teaching strategies na mafufullfill yung learning ng mga students. So dito naman ay sa pag-construct ng test item ibig sabihin kung mas maraming mali yung student ibig sabihin ay baka hindi maayos ang pag-construct ng item, so with that ay dapat mas mag improve pa ang teacher sa pag construct ng test item.
  • #16 B. An ability to distinguish between individuals or groups with different levels of a particular trait, characteristic, or knowledge. C. Refers to the quality or utility of each option or response choice in an assessment item.