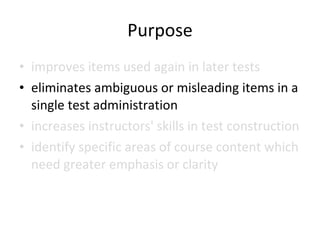
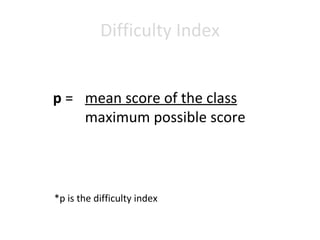
The document discusses item analysis, which is the process of examining test responses to evaluate the quality of individual test items and the test itself. It aims to improve the effectiveness of items used on future tests. Key aspects covered include item difficulty index, item discrimination, and analyzing items based on how well they measure the effects of instruction. The document provides examples and interpretations for calculating various metrics used in item analysis.
Here is a simplified version of Item Analysis for Educational Assessments. Covered here are terminologies, formulas, and processes in conducting Item Discrimination and Difficulty. Thank you. Namaste!
Here is another simplified presentation about the process of Distracter Analysis in Educational Assessments. Included here are terminologies, reminders, definitions, as well as process in conducting it. Thank you. Namaste.
(MST) Test Construction and Material
(class report(s)/discussion(s))
DISCLAIMER: I do not claim ownership of the photos, videos, templates, and etc used in this slideshow
CREDIT/s: education-portal
EXAMINING DISTRACTORS AND EFFECTIVENESS
Distractors are the multiple choice response options that are not the correct answer. They are plausible but incorrect options that are often developed based upon students’ common misconceptions or miscalculations. Item analysis software typically indicates the percentage of students who selected each option, distractors and key.
educ 11
Placement assessments are used to “place” students into a course, course level, or academic program. For example, an assessment may be used to determine whether a student is ready for Algebra I or a higher-level algebra course, such as an honors-level course.
For this reason, placement assessments are administered before a course or program begins, and the basic intent is to match students with appropriate learning experiences that address their distinct learning needs.
Diagnostic Assessment Is An Essential Device In A Teacher's "Tool Kit", Which Can Be Used To Diagnose Strengths And Area Of Need In All Students.
▪ Diagnostic Assessment Involves The Gathering And Careful Evaluation Of Detailed Data Using Student’s Knowledge And Skills In A Given Learning Area.
Topic: Quantitative Item Analysis
Student Name: Hussain Shah
Class: M.Ed
Project Name: “Young Teachers' Professional Development (TPD)"
"Project Founder: Prof. Dr. Amjad Ali Arain
Faculty of Education, University of Sindh, Pakistan
This lesson on price elasticity of demand contains an explanation of elasticity, how to solve for both arc and point price elasticity of demand, its relation to total revenue, and the factors that influence the elasticity of demand for a product or service.
Contains comprehension questions on basic concepts (law of demand, substitution effect, income effect, etc) and analysis questions on determining between change in quantity demanded/supplied (movement along the curve) vs change in demand/supply (shift to the left or right).
Contains explanations for factors of production (land, labor, capital, entrepreneurship), four types of business firms (sole proprietorship, partnership, corporation, cooperative), and related terminology (franchise, conglomerate, holding company, multinational, etc).
This is the presentation I used regarding three consumer laws in the Philippines: Consumer Act of the Philippines, Philippine Lemon Law, and the Anti-Red Tape Act. This is an enrichment lesson.
These are slides I used to introduce my students to the concept of periodization in the study of history. I looked at periodization based on the invention of writing (pre-history, history), based on the invention of tools (stone, metal age), and based on Christianity.
Lecture slides for Economics (Social Studies/Araling Panlipunan) Gr. 9 & 10 following the basic competencies of the K to 12 curriculum in the Philippines.
This worksheet can be used as practice or assessment of your students' knowledge regarding factors of production. All images used in the worksheet were appropriated in the spirit of fair use. This material should only be used for classroom/educational purposes.
Kabahin kini nga worksheet sa mga parte sa nawong. Apil kini sa leksiyon kabahin sa mga parte sa lawas sa tawo. Gihimo kani alang sa mga magtutudlo sa K-3 o early grades nga ang mother tongue mao ang Cebuano/Sinugbuanon.
This worksheet is about the parts of the face. This is part of the broader lesson on the parts of the human body. This was made for teachers of K-3 or the early grades whose mother tongue is Cebuano/Sinugbuanon.
The photo used in this document was lifted under the spirit of fair use.
Please feel free to leave me a message if you want a copy of the editable document.
Students, digital devices and success - Andreas Schleicher - 27 May 2024..pptxEduSkills OECD
Andreas Schleicher presents at the OECD webinar ‘Digital devices in schools: detrimental distraction or secret to success?’ on 27 May 2024. The presentation was based on findings from PISA 2022 results and the webinar helped launch the PISA in Focus ‘Managing screen time: How to protect and equip students against distraction’ https://www.oecd-ilibrary.org/education/managing-screen-time_7c225af4-en and the OECD Education Policy Perspective ‘Students, digital devices and success’ can be found here - https://oe.cd/il/5yV
How to Split Bills in the Odoo 17 POS ModuleCeline George
Bills have a main role in point of sale procedure. It will help to track sales, handling payments and giving receipts to customers. Bill splitting also has an important role in POS. For example, If some friends come together for dinner and if they want to divide the bill then it is possible by POS bill splitting. This slide will show how to split bills in odoo 17 POS.
Synthetic Fiber Construction in lab .pptxPavel ( NSTU)
Synthetic fiber production is a fascinating and complex field that blends chemistry, engineering, and environmental science. By understanding these aspects, students can gain a comprehensive view of synthetic fiber production, its impact on society and the environment, and the potential for future innovations. Synthetic fibers play a crucial role in modern society, impacting various aspects of daily life, industry, and the environment. ynthetic fibers are integral to modern life, offering a range of benefits from cost-effectiveness and versatility to innovative applications and performance characteristics. While they pose environmental challenges, ongoing research and development aim to create more sustainable and eco-friendly alternatives. Understanding the importance of synthetic fibers helps in appreciating their role in the economy, industry, and daily life, while also emphasizing the need for sustainable practices and innovation.
Operation “Blue Star” is the only event in the history of Independent India where the state went into war with its own people. Even after about 40 years it is not clear if it was culmination of states anger over people of the region, a political game of power or start of dictatorial chapter in the democratic setup.
The people of Punjab felt alienated from main stream due to denial of their just demands during a long democratic struggle since independence. As it happen all over the word, it led to militant struggle with great loss of lives of military, police and civilian personnel. Killing of Indira Gandhi and massacre of innocent Sikhs in Delhi and other India cities was also associated with this movement.
The Indian economy is classified into different sectors to simplify the analysis and understanding of economic activities. For Class 10, it's essential to grasp the sectors of the Indian economy, understand their characteristics, and recognize their importance. This guide will provide detailed notes on the Sectors of the Indian Economy Class 10, using specific long-tail keywords to enhance comprehension.
For more information, visit-www.vavaclasses.com
2024.06.01 Introducing a competency framework for languag learning materials ...Sandy Millin
http://sandymillin.wordpress.com/iateflwebinar2024
Published classroom materials form the basis of syllabuses, drive teacher professional development, and have a potentially huge influence on learners, teachers and education systems. All teachers also create their own materials, whether a few sentences on a blackboard, a highly-structured fully-realised online course, or anything in between. Despite this, the knowledge and skills needed to create effective language learning materials are rarely part of teacher training, and are mostly learnt by trial and error.
Knowledge and skills frameworks, generally called competency frameworks, for ELT teachers, trainers and managers have existed for a few years now. However, until I created one for my MA dissertation, there wasn’t one drawing together what we need to know and do to be able to effectively produce language learning materials.
This webinar will introduce you to my framework, highlighting the key competencies I identified from my research. It will also show how anybody involved in language teaching (any language, not just English!), teacher training, managing schools or developing language learning materials can benefit from using the framework.
This is a presentation by Dada Robert in a Your Skill Boost masterclass organised by the Excellence Foundation for South Sudan (EFSS) on Saturday, the 25th and Sunday, the 26th of May 2024.
He discussed the concept of quality improvement, emphasizing its applicability to various aspects of life, including personal, project, and program improvements. He defined quality as doing the right thing at the right time in the right way to achieve the best possible results and discussed the concept of the "gap" between what we know and what we do, and how this gap represents the areas we need to improve. He explained the scientific approach to quality improvement, which involves systematic performance analysis, testing and learning, and implementing change ideas. He also highlighted the importance of client focus and a team approach to quality improvement.
The Art Pastor's Guide to Sabbath | Steve ThomasonSteve Thomason
What is the purpose of the Sabbath Law in the Torah. It is interesting to compare how the context of the law shifts from Exodus to Deuteronomy. Who gets to rest, and why?
3. Item Analysis the effort to improve individual questions after they are used process of examining answers to questions in order to assess the quality of individual test items and test itself
4. Item Analysis the effort to improve individual questions after they are used process of examining answers to questions in order to assess the quality of those items and of the test
5.
6.
7.
8.
9.
10.
11.
12.
13.
14.
15.
16.
17. Difficulty Index p = total who answered correctly total taking the test *p is the difficulty index
18. Difficulty Index p = 22 get the correct answer 25 students take the test *p is the difficulty index p = ?
19. Difficulty Index p = 22 get the correct answer 25 students take the test *p is the difficulty index p = 0.88
20. Difficulty Index p = 0.88 *p is the difficulty index 88% of the students got it right high difficulty index
30. Distribution with Positive Skew picture from http://www.ken-szulczyk.com/lessons/statistics/asymmetric_distribution_01.png
31.
32.
33.
34.
35.
36. Out-of-Level Testing picture from http://www.ken-szulczyk.com/lessons/statistics/asymmetric_distribution_01.png The average score would be only 20% plus a bit more for the guessing factor. The distribution of scores would show a positive skew. The best students would be evident at the upper end of the distribution.
37. Out-of-Level Testing picture from http://www.ken-szulczyk.com/lessons/statistics/asymmetric_distribution_01.png The average score would be only 20% plus a bit more for the guessing factor. The distribution of scores would show a positive skew. The best students would be evident at the upper end of the distribution.
38. Out-of-Level Testing picture from http://www.ken-szulczyk.com/lessons/statistics/asymmetric_distribution_01.png The average score would be only 20% plus a bit more for the guessing factor. The distribution of scores would show a positive skew. The best students would be evident at the upper end of the distribution.
46. Problem When using a rigid grading scale, over half of the students will fail or get a D. picture from http://savingphilippinepupilsandparents.blogspot.com/
47. Distracter Analysis a multiple choice item has a low difficulty index ( p < 0.30 ) examine the item’s distracters 1 2
48. Distracter Analysis a multiple choice item has a low difficulty index ( p < 0.30 ) examine the item’s distracters 1 2
49.
50. Distracter Analysis p = 15/50 or 0.30 Answer Choices Number who selected choice (out of 50) Choice A 2 Choice B 26 Choice C 7 Choice D 15
55. Hogan’s Method N=40 ; Median=35 ; The test contained 50 items . * Indicates correct option. Item Group A B* C D 5 High 0 90 10 0 Low 10 50 30 10 Total 5 70 20 5 in %
56. Sample Problem N=40 ; Median=35 ; The test contained 50 items . Item Group A* B C D 5 High 40 60 0 0 Low 60 30 0 10 Total 50 45 0 5
74. Crucial Questions: To what extent did the test items measure the effects of instruction?
75. Item Response Chart + means correct - means incorrect Items 1 2 3 4 5 Pretest (B) Posttest (A) B A B A B A B A B A Jim - + + + - - + - - + Dora - + + + - - + - + + Lois - + + + - - + - - + Diego - + + + - - + - - +
-use before a test is administered helps assure that the test is a reliable and valid measure -use after the test has been administered makes it possible to build a bank of high-quality test items for use during future years -use after allows the teacher to remove errant questions that adversely affect the quality of classroom measures in the current year
#2knowledge of which incorrect options students select must be a clue to the nature of the misunderstanding, and thus prescriptive of appropriate remediation
Item Difficulty -easiest -each item should have been correctly answered by a little over half of the class
p=0.88
p=0.88
most scores clustered on high side unusual low scores spread out over the wide area of the distribution
Most children will score very high on these measures. Children with learning problems will be easily identified by their pattern of lower scores.
This test would be very difficult for most applicants.
Most common formula: right – (wrong/n-1) where n is the number of alternatives for an item
The more difficult the likelier students will guess an answer to the question.
p=0.88
p=0.88
-dependent on teacher’s grading philosophy or goal for testing -if well-constructed test designed w/ items of this difficulty level is administered, student scores should distribute as a normal Gaussian curve; distribution will have a mean score equal to the average difficulty level of test items -if to maximize differences between students, optimal diff. index is 0.50
problem for teachers who assign grades according to a rigid scale e.g. 60-69% range would be a D for this reason teachers often design test items to have difficulty indexes over 0.70
A is chosen by only 2; may be too obviously wrong. C is working well. B has drawn far too many students; should be examined to determine what caused this choice. Teacher should consider reteaching the topic and explaining why B is wrong. A and B need to be rewritten for the next edition of the test.
Valid: students who have higher scores know more about the subject than students with lower scores.
#2 Split the group at the median, top 50% and bottom 50%. If several students are at the median, allocate them randomly to one or the other group to get balanced groups.
p=0.70 D=.90-.50=.40
p=0.50 D=-0.20
#2 Scores in the middle will not be used #4 Percentage of students who got the item right #5 difference between number of pupils in the upper and lower groups who got the item right
p=0.70 D=.90-.50=.40
-use before a test is administered helps assure that the test is a reliable and valid measure -use after the test has been administered makes it possible to build a bank of high-quality test items for use during future years -use after allows the teacher to remove errant questions that adversely affect the quality of classroom measures in the current year
To answer this a pre-test and post-test must be given, and the results compared. An item by item comparison can be made by means of an item-response chart.