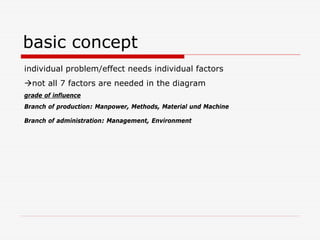
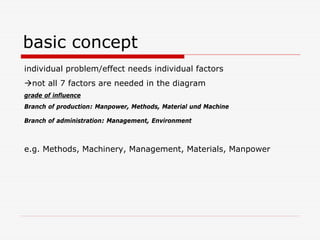
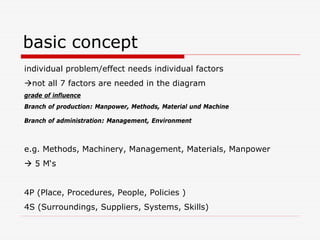
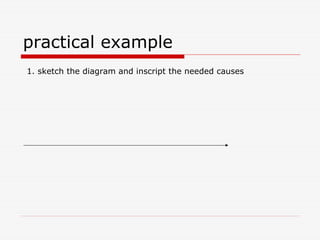
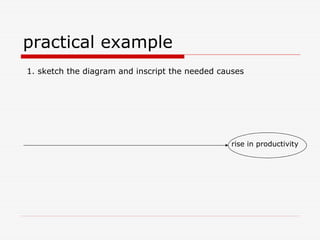
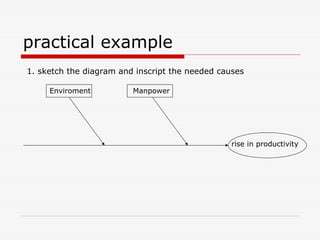
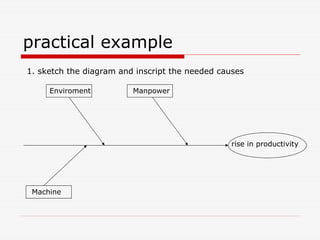
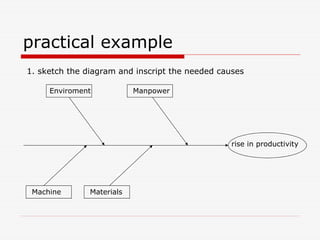
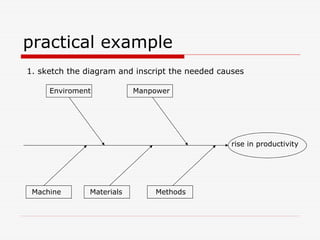
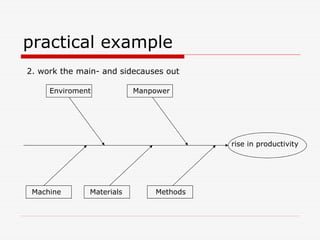
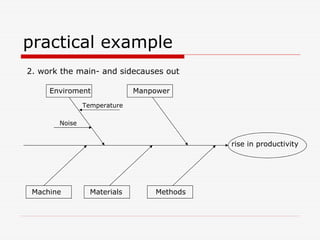
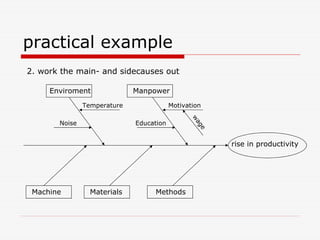
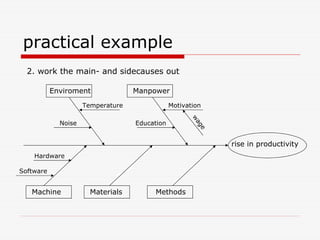
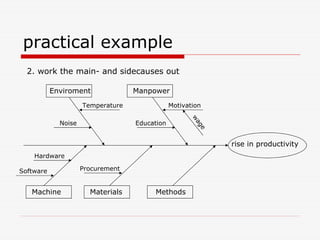
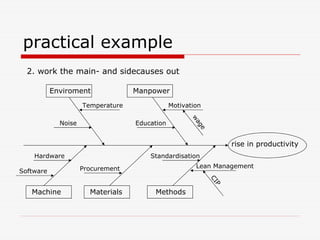
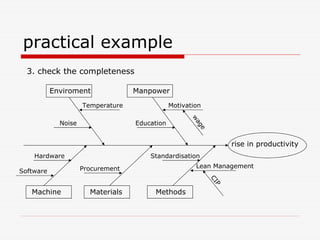
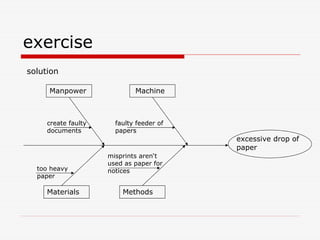
The document describes Kaoru Ishikawa and the Ishikawa diagram, also known as a fishbone diagram or cause-and-effect diagram. It was developed by Ishikawa to help teams visualize and analyze the potential causes of a particular problem or effect. The diagram structures causes into main categories, typically including methods, machines, materials, measurements, management, manpower, and environment. It then maps potential causes in each category that could contribute to the problem or effect. The document provides examples of using the diagram to analyze the causes of increased productivity in a company and excessive paper drop in a printing process.
Dear All, This is very comprehensive training on application of 7QC tools in industry. There is now a common demand in every industry to improve and control the process by achieving product quality with integrity. These 7-QC tools are very useful to fulfil industry demand by controlling the process. I am expecting your kind suggestions and comments to improve my presentation further. Thanks a lot everyone for your time to read this presentation. I hope it will definitely give some value addition in your routine life. Thanking you!
This Template is created for helping the quality or continuous improvement professionals to generate a step by step problem solving report, which include the guidance on each steps in a 8D process, also include the templates of popular quality tools such as 5-Why and Fishbone Diagram.
想学习六西格玛?可以看看ucourse.org的网上课程。
http://ucourse.org/ssgb
Quality Maintenance is an "advanced" pillar of TPM and aims to assure zero defect conditions. Also known as Hinshitsu Hozen in Japanese, it does this by understanding and controlling the process interactions between the 4Ms - manpower, material, machines and methods that could enable defects to occur. The key is to prevent defects from being produced in the first place, rather than screening them out through inspection systems after they have been produced. Controlling quality through its causes is the essence of Quality Maintenance.
Developed by our JIPM-certified TPM Instructor, this presentation teaches the key concepts, principles and philosophy of Quality Maintenance, the 4M conditions that are essential for defect-free production, as well as the step-by-step process for Quality Maintenance.
LEARNING OBJECTIVES
1. Understand the key concepts, principles and philosophy of Quality Maintenance
2. Acquire knowledge on the 4M conditions and the prerequisites for promoting Quality Maintenance
3. Describe the 8-step process of Quality Maintenance and the key analytical tools and techniques
CONTENTS
1. Key Concepts & Philosophy of Quality Maintenance
2. 4M Conditions - The Determinants of Quality
3. The 8 Steps of Quality Maintenance
4. Key Tools & Techniques for Quality Maintenance
5. Towards Excellence in Quality Maintenance
To download this presentation, visit:
https://www.oeconsulting.com.sg/training-presentations
This presentation is all about my working experience at iljin electronics pvt ltd. and its all about the working of IQC department of electronics industry.
Visit www.shakehandwithlife.in to buy this Book. This E-Book on 7QC tools is complete training workshop for Junior, Middle and Senior quality quality professionals. The USP of this workshop is the text and graphics in the book for understanding the tools while applying to solve the practial problems. Illustrative worked examples , Construction of tools in Excel like Histogram, Pareto Chart, Scatter Diagram, Control charts are beautifully explained in step step manner. A newcomer in the area of quality can easily understand how the tools be used and applied.
7 QC Tools are simple statistical tools used for problem solving. Nilesh Arora presented basics of 7 QC Tool training and details about Pareto Diagram.
The process of diagnosing product problems identified during design, manufacture or use brings many challenges. The presentation will discuss ways to alleviate these difficulties using a structured, troubleshooting-based approach, and being aware of some common errors and ways of dealing with them.
• How to analyze data for low frequency failures
• Using the information from RCA for improving both prevention and detection
• Understand why finding a product solution often isn’t enough
Quality in Manufacturing for Production & ManufacturingTimothy Wooi
This 1 day training program on the “Soft” TQM Concepts focus on Manufacturing Staff and Operators to equip Participants with a better understanding TQM and its practices and to understand why being responsible for Quality is so important as a mechanism to safe guard to Customer for receiving a Defect as well as to comply to Quality procedures..
In pharmaceutical industry any investigation is concluded with "Human error" as root cause then understanding needs to be built for the root cause analysis.
It is very easy to conclude as Human error, but difficult to justify.
These Presentation includes
1. Trend of Human error in various industries.
2. Facts and Finding on Human error
3. Definition of Human error.
4. Viewpoint "Human Error"
5. Understanding of Human error part-1 and 2.
6. Contributing factors for human error.
7. Human weaknesses.
8. Human limitations.
9. Let's Have part (Secret game zone)
10. Human error investigation
11. Human error reduction
12. Thank you note
The presentation discusses about Customer Focus, Customer Satisfaction, Customer Orientation, Customer Complaints and Customer Retention in relation with Total Quality Management.
Exposicion ishikawa alejandra carboni y rey mendoza (2)Jesus Mendoza
Existen bastantes cosas que pudiera decir nosotros sobre Ishikawa por sus aportes hacia la calidad, en ves de eso. Veamos el reconocimiento que le dan algunas personalidades de empresas reconocidas.
Aportes de kaoru ishikawa
Circulos de calidad, las 7 herramientas basicas para una calidad de administracion y el diagrama casua - efecto o diagrama del pez
Utilities at the cutting edge of DSM planning are implementing Strategic Energy Management (SEM) programs. By equipping C&I customers with powerful tools that help them strategically manage their energy use, utilities realize significant EE savings and deepen their customer relationships.
MEEA, in collaboration with members Xcel Energy and EnerNOC, presented this webinar on SEM best practices and opportunities for Midwest utilities, featuring a case study with Xcel Energy.
On this webinar we discussed:
1. The Value of SEM to Utilities – Understanding how SEM drives increased energy savings from behavioral improvements, more reliable savings from existing capital projects, and deeper customer engagement.
2. Best Practices in SEM Program Design – EnerNOC SEM Practice Lead Chad Gilless will discuss core SEM concepts and present common configurations and options that drive utility program results.
3. Xcel Energy’s Industrial Process Efficiency – Xcel Energy Program Manager Kerry Klemm will present a case study of an award-winning SEM program, the Xcel Energy Process Efficiency program.
Speakers:
Kerry Klemm – Program Manager, Xcel Energy
Kerry Klemm has been involved in energy conservation marketing since the mid 1990s and currently leads Xcel Energy’s Holistic team and manages the Process Efficiency program, which helps manufacturers make smart energy choices that lower their energy use, achieve environmental savings, and improve their bottom line.
Chad Gilless – Practice Lead, Strategic Energy Management, EnerNOC
Chad directs EnerNOC’s efforts to integrate energy into industrial business practices. Based in Portland, OR, Chad has expertise in organizational facilitation and coaching and has over 15 years of experience as a consultant and project manager. He has been with EnerNOC since 2010. He has led numerous programs and projects to deploy plant energy management programs within the industrial sectors, and his efforts have produced more than 68 million kW
3. • born in Tokio 1915
• graduated University of Tokyo in 1939 with an
Engineering degree in applied chemistry
• worked as a naval technical officer until 1941
• worked for Nissan Liquid Fuel Company
Kaoru Ishikawa
• associate professor at the University of Tokyo in 1947 (1915 - 1989)
• famous person in Qualitymanagement
• not only product quality
• but also e.g. quality of Management and assistant
• developed several quality-tools
• One of these tools is the Ishikawa-Diagram
(also called Fishbone- or cause and effect diagram)
4. basic concept
The Idea:
think about possible causes and reasons leading to
an effect or a problem
find solution for preventing those problems
5. basic concept
• one problem/effect
• 7 causes lead to the problem/effect
• the causes are divided into main- and sidecauses
The 7 causes are:
1. Methods
2. Machinery
3. Management
4. Materials
5. Manpower
6. Environment
7. Measurement
8. basic concept
individual problem/effect needs individual factors
not all 7 factors are needed in the diagram
grade of influence
Branch of production: Manpower, Methods, Material und Machine
Branch of administration: Management, Environment
9. basic concept
individual problem/effect needs individual factors
not all 7 factors are needed in the diagram
grade of influence
Branch of production: Manpower, Methods, Material und Machine
Branch of administration: Management, Environment
e.g. Methods, Machinery, Management, Materials, Manpower
10. basic concept
individual problem/effect needs individual factors
not all 7 factors are needed in the diagram
grade of influence
Branch of production: Manpower, Methods, Material und Machine
Branch of administration: Management, Environment
e.g. Methods, Machinery, Management, Materials, Manpower
5 M‘s
11. basic concept
individual problem/effect needs individual factors
not all 7 factors are needed in the diagram
grade of influence
Branch of production: Manpower, Methods, Material und Machine
Branch of administration: Management, Environment
e.g. Methods, Machinery, Management, Materials, Manpower
5 M‘s
4P (Place, Procedures, People, Policies )
4S (Surroundings, Suppliers, Systems, Skills)
13. aim
• find the causes, main- and sidecauses
• clarity
• interdependence of the causes
• improve them for having the wanted effect
or eliminate them for solving the problem
16. theoretical conversion
1. sketch the diagram and inscript the needed causes
2. work the main- and sidecauses out
3. check the completeness
17. theoretical conversion
1. sketch the diagram and inscript the needed causes
2. work the main- and sidecauses out
3. check the completeness
4. weight the the main- & sidecauses in terms of meaning & influence
18. theoretical conversion
1. sketch the diagram and inscript the needed causes
2. work the main- and sidecauses out
3. check the completeness
4. weight the the main- & sidecauses in terms of meaning & influence
5. check the selected causes for rightness
19. theoretical conversion
1. sketch the diagram and inscript the needed causes
2. work the main- and sidecauses out
3. check the completeness
4. weight the the main- & sidecauses in terms of meaning & influence
5. check the selected causes for rightness
6. The team discusses about the solution
20. theoretical conversion
6. The team discusses about the solution
• causes that can be improved or eliminated easily will be finished
first of all (no need to be weighted)
• The weighted causes are in a list of priority and will be finished in
turn
29. practical example
1. sketch the diagram and inscript the needed causes
Enviroment Manpower
rise in productivity
30. practical example
1. sketch the diagram and inscript the needed causes
Enviroment Manpower
rise in productivity
Machine
31. practical example
1. sketch the diagram and inscript the needed causes
Enviroment Manpower
rise in productivity
Machine Materials
32. practical example
1. sketch the diagram and inscript the needed causes
Enviroment Manpower
rise in productivity
Machine Materials Methods
33. practical example
2. work the main- and sidecauses out
Enviroment Manpower
rise in productivity
Machine Materials Methods
34. practical example
2. work the main- and sidecauses out
Enviroment Manpower
Temperature
Noise
rise in productivity
Machine Materials Methods
35. practical example
2. work the main- and sidecauses out
Enviroment Manpower
Temperature Motivation
w
Noise Education
ag
e
rise in productivity
Machine Materials Methods
36. practical example
2. work the main- and sidecauses out
Enviroment Manpower
Temperature Motivation
w
Noise Education
ag
e
rise in productivity
Hardware
Software
Machine Materials Methods
37. practical example
2. work the main- and sidecauses out
Enviroment Manpower
Temperature Motivation
w
Noise Education
ag
e
rise in productivity
Hardware
Software Procurement
Machine Materials Methods
38. practical example
2. work the main- and sidecauses out
Enviroment Manpower
Temperature Motivation
w
Noise Education
ag
e
rise in productivity
Hardware Standardisation
Procurement Lean Management
Software
CI
P
Machine Materials Methods
39. practical example
3. check the completeness
Enviroment Manpower
Temperature Motivation
w
Noise Education
ag
e
rise in productivity
Hardware Standardisation
Procurement Lean Management
Software
CI
P
Machine Materials Methods
40. practical example
4. weight the the main- & sidecauses in terms of meaning & influence
• Lean Management
• Standardisation
• Motivation
• Education
•…
41. practical example
5. check the selected causes for rightness
• Lean Management
• Standardisation
• Motivation
• Education
•…
42. practical example
6. The team discusses about the solution
causes that can be improved or eliminated easily:
• Hardware
• Software
• Temperature
• Noise
43. practical example
6. The team discusses about the solution
weighted causes
• Lean Management
• Standardisation
• Motivation
• Education
44. exercise
excessive drop of paper
Henner Graubitz
October 23rd 2006
45. exercise
1. sketch the diagram and inscript the needed causes
2. work the main- and sidecauses out
3. check the completeness
4. weight the the main- & sidecauses in terms of meaning & influence
5. check the selected causes for rightness
6. The team discusses about the solution
46. exercise
solution
Manpower Machine
create faulty faulty feeder of
documents papers
excessive drop of
paper
misprints aren‘t
used as paper for
too heavy notices
paper
Materials Methods
47. Advantage:
• different opinions by teamwork
• easy to apply
• little effort to practise
• better understanding for causes and
effects
48. Advantage: Disadvantage:
• different opinions by teamwork • No clarity in very complex problems
• easy to apply • Interactions and chronological
dependence can’t be displayed
• little effort to practise
• better understanding for causes and
effects