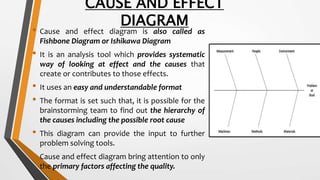
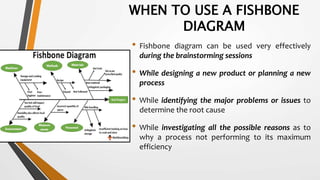
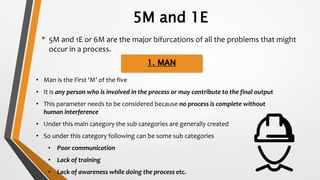
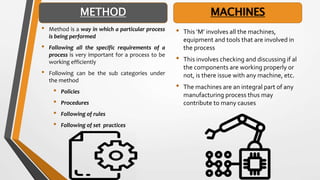
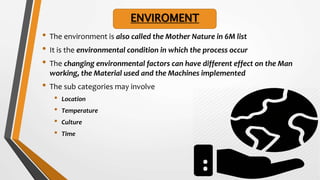
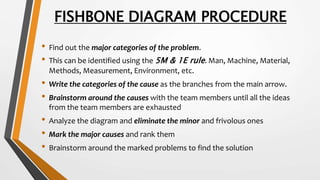
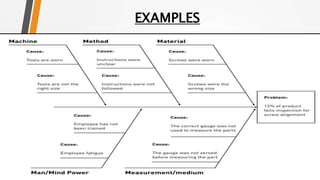
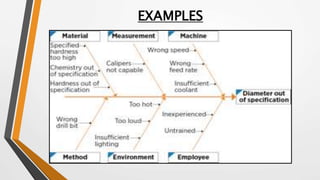
This PPT covers the Cause and effect or the fishbone diagram, its basics,when to use it 5M and 1E of the fishbone diagram,procedure to draw and benifits of the fishbone diagram.
2. CAUSE AND EFFECT
DIAGRAM
• Cause and effect diagram is also called as
Fishbone Diagram or Ishikawa Diagram
• It is an analysis tool which provides systematic
way of looking at effect and the causes that
create or contributes to those effects.
• It uses an easy and understandable format
• The format is set such that, it is possible for the
brainstorming team to find out the hierarchy of
the causes including the possible root cause
• This diagram can provide the input to further
problem solving tools.
• Cause and effect diagram bring attention to only
the primary factors affecting the quality.
3. WHEN TO USE A FISHBONE
DIAGRAM
• Fishbone diagram can be used very effectively
during the brainstorming sessions
• While designing a new product or planning a new
process
• While identifying the major problems or issues to
determine the root cause
• While investigating all the possible reasons as to
why a process not performing to its maximum
efficiency
4. 5M and 1E
• 5M and 1E or 6M are the major bifurcations of all the problems that might
occur in a process.
1. MAN
• Man is the First ‘M’ of the five
• It is any person who is involved in the process or may contribute to the final output
• This parameter needs to be considered because no process is complete without
human interference
• Under this main category the sub categories are generally created
• So under this category following can be some sub categories
• Poor communication
• Lack of training
• Lack of awareness while doing the process etc.
5. • Method is a way in which a particular process
is being performed
• Following all the specific requirements of a
process is very important for a process to be
working efficiently
• Following can be the sub categories under
the method
• Policies
• Procedures
• Following of rules
• Following of set practices
• This ‘M’ involves all the machines,
equipment and tools that are involved in
the process
• This involves checking and discussing if al
the components are working properly or
not, is there issue with any machine, etc.
• The machines are an integral part of any
manufacturing process thus may
contribute to many causes
METHOD MACHINES
6. • This constitutes of every kind of material
involved in the process right from the start to
end
• This involves
• Raw materials
• Parts
• Spare Parts
• Packaging material
• Outsources assemblies etc.
• It includes the data that is used to access the
performance of the process
• The measurements can be of many different
types like measuring the dimensions of the
product or measuring the RPM of the machine.
• The measurements provide the numerical
data for comparison of the causes with the
standard parameters
MATERIAL MEASUREMENTS
7. • The environment is also called the Mother Nature in 6M list
• It is the environmental condition in which the process occur
• The changing environmental factors can have different effect on the Man
working, the Material used and the Machines implemented
• The sub categories may involve
• Location
• Temperature
• Culture
• Time
ENVIROMENT
8. FISHBONE DIAGRAM PROCEDURE
• Find out the major categories of the problem.
• This can be identified using the 5M & 1E rule. Man, Machine, Material,
Methods, Measurement, Environment, etc.
• Write the categories of the cause as the branches from the main arrow.
• Brainstorm around the causes with the team members until all the ideas
from the team members are exhausted
• Analyze the diagram and eliminate the minor and frivolous ones
• Mark the major causes and rank them
• Brainstorm around the marked problems to find the solution
9. BENIFITS
• Cause and Effect diagram breaks the process into bite sized
pieces to find out the root cause
• It Fosters team work
• Develops common understanding of factors causing the
problem
• As everyone gets insight of cause and effect, finding the
solution becomes easy.