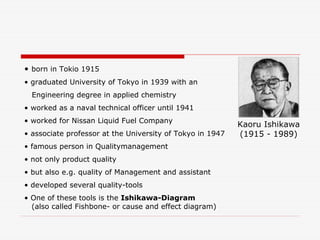
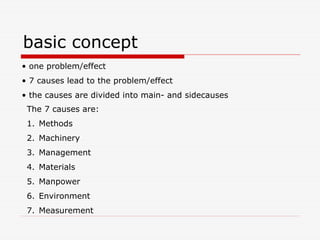
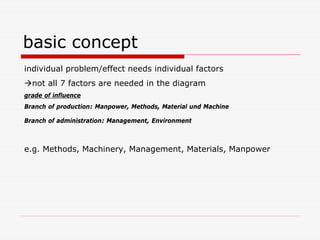
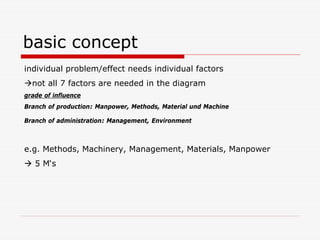
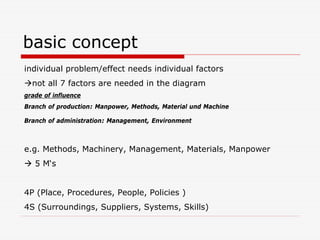
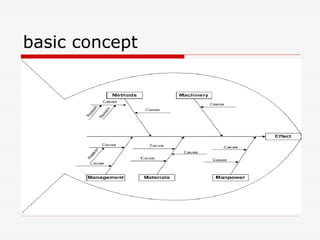
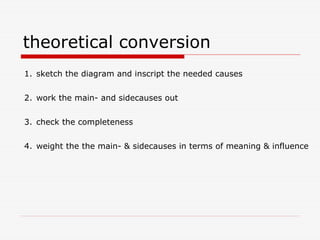
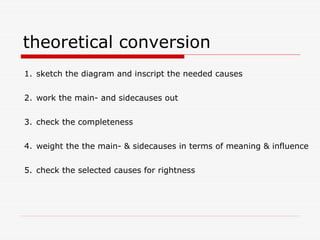
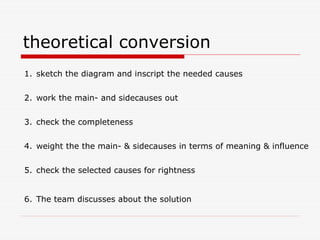
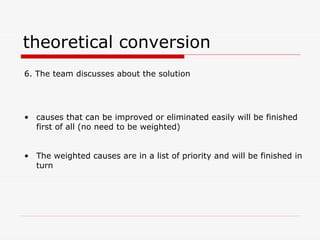
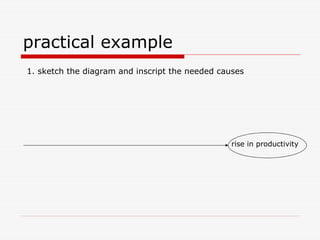
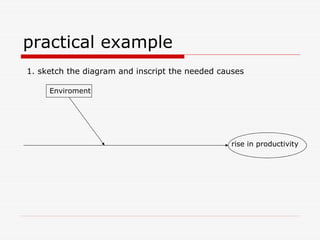
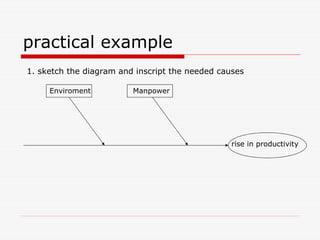
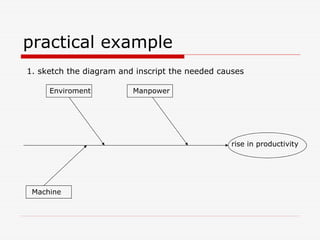
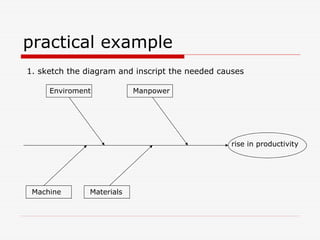
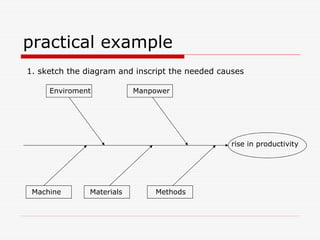
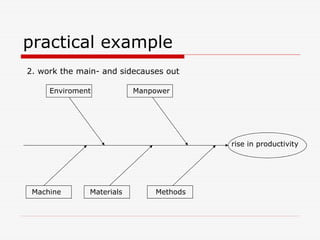
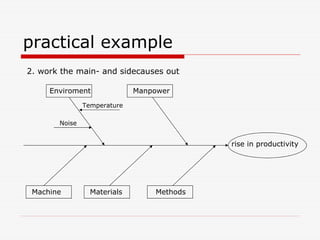
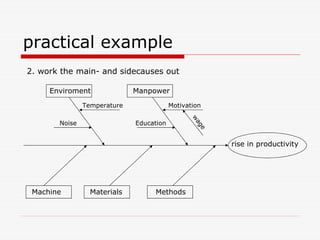
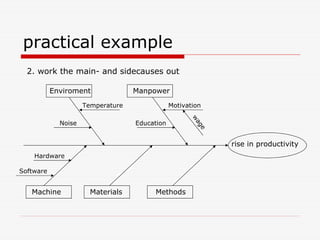
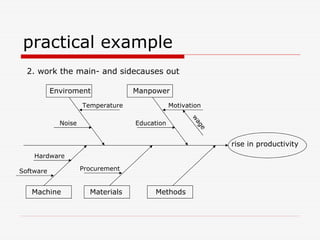
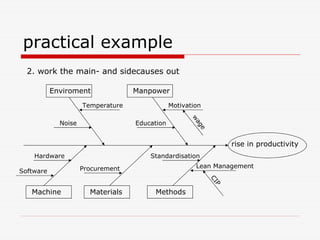
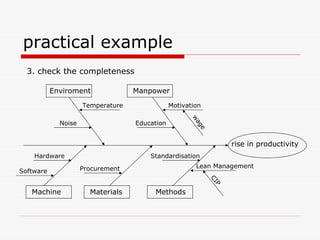
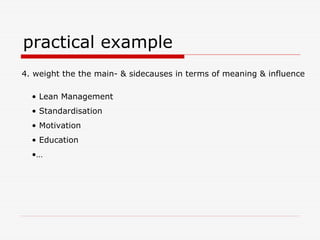
The document discusses Kaoru Ishikawa and the Ishikawa diagram, also known as a fishbone diagram or cause-and-effect diagram. It describes how Ishikawa developed the diagram to help identify potential causes for a particular problem or effect. The diagram categorizes causes into main categories like methods, materials, machines, management, and more. It then provides steps for constructing a diagram, including identifying the problem, listing potential causes, checking for completeness, prioritizing causes, and discussing solutions. An example is given showing how the diagram was used to analyze the cause of increased productivity.


![Qcl 14-v3 [cause effect diagram-poor placement of students]-[banasthali unive...](https://cdn.slidesharecdn.com/ss_thumbnails/qcl-14-v3causeeffectdiagram-poorplacementofstudentsbanasthaliuniversityanshuverma-150110071924-conversion-gate01-thumbnail.jpg?width=640&height=640&fit=bounds)


![Qcl 14-v3 [cause effect diagram]-[banasthali vidhyapith]_[aparna agnihotri]](https://cdn.slidesharecdn.com/ss_thumbnails/qcl-14-v3causeeffectdiagrambanasthalividhyapithaparnaagnihotri-150110003642-conversion-gate02-thumbnail.jpg?width=640&height=640&fit=bounds)


