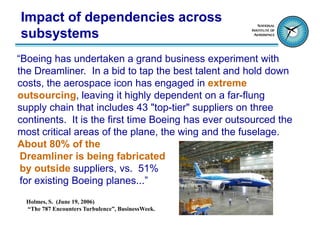
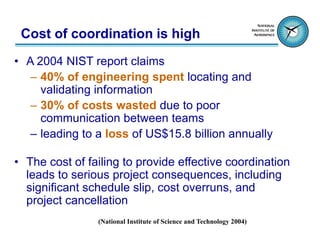
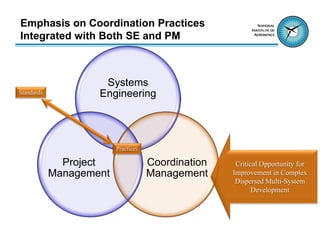
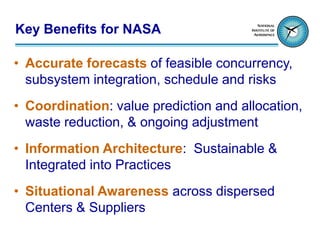
Cross-Center Systems Development:
Coordination Architectures and Practices


          Presented at: NASA PM 2010
              William Grossmann
                  Bryan Moser
         National Institute of Aerospace

                                           Used with Permission
Outline
• Introduction
• The State of Complex System Development
• Perfect Storm Leads to Decline in Judgement
• Visualization & Simulation across Subsystems
• Case Study
• Conclusions & Benefits for NASA
Introduction

 Today's aerospace products are more
   complex while being developed by
    teams located across the globe.

 The challenge is to optimally organize,
  direct, and manage these teams, their
     interactions, dependencies, and
       priorities during the program.
The State of Complex Product
Development

• Multiple layers of system and subsystem, with
  substantive design responsibility layers down

• Complex dependencies fall across subsystems
  owned by different teams

• Dispersed teams and supply chain with less
  chance of a shared, common background

• Pressure to proceed in a dramatically
  concurrent fashion, increasing risk of rework,
  poor quality, and delay
Perfect Storm
Leading to Decline of Judgment

• Thinning of the work force
• Variation in work practices globally
• Dependencies across major subsystems
• Cost of coordination is high
Thinning of the work force

• reductions in projects combined with reductions in hiring
  changed the age - experience composition

• a decline in opportunities for design experience
   – highly qualified technical workers to consider field less desirable.

• engineers will work on fewer projects in their lifetimes
    – less experience across a broad spectrum of technologies

• gaps of years between development of new systems
   – specifically trained and experienced workers may be lost.


                                         (National Research Council, 2001)
Variation in work practices globally
• Technical: to think mathematically, Sound knowledge of basic
  science, knowledge of a specific discipline, Maintenance of
  current knowledge and practice

• Personal: Ability and willingness to learn, Appreciation of
  limits to knowledge, Good communication skills, and
  international dimensions

• Professional: Commitment to high standards, of personal and
  ethical responsibilities, Ability to handle uncertainty, to
  communicate effectively, in more than one language including
  English

• Managerial: Ability to work in a team, Appreciation of
  management concepts and issues, Ability to lead and manage
  personal, financial and technical resources
                                (National Academy of Engineering 2004)
Impact of dependencies across
subsystems
“Boeing has undertaken a grand business experiment with
the Dreamliner. In a bid to tap the best talent and hold down
costs, the aerospace icon has engaged in extreme
outsourcing, leaving it highly dependent on a far-flung
supply chain that includes 43 "top-tier" suppliers on three
continents. It is the first time Boeing has ever outsourced the
most critical areas of the plane, the wing and the fuselage.
About 80% of the
 Dreamliner is being fabricated
 by outside suppliers, vs. 51%
 for existing Boeing planes...”
  Holmes, S. (June 19, 2006)
  “The 787 Encounters Turbulence”, BusinessWeek.
Cost of coordination is high
• A 2004 NIST report claims
   – 40% of engineering spent locating and
     validating information
   – 30% of costs wasted due to poor
     communication between teams
   – leading to a loss of US$15.8 billion annually

• The cost of failing to provide effective coordination
  leads to serious project consequences, including
  significant schedule slip, cost overruns, and
  project cancellation
                (National Institute of Science and Technology 2004)
Visualization & Project Simulation across Subsystems
Our approach uses a collaborative project design method for
complex projects, including the activity of coordination across
teams and subsystems. The method is powered by a simulation
and visualization engine to gain shared situational awareness.
Sustainable, visual tools allow teams to keep their focus on real
progress, coordination overhead, and systemic product/system
risk throughout.


OUR APPROACH
Benefits of Project Design

• Architectural Judgement for Teams

• Forecast Accuracy through Converging Iteration

• Integration into Information Architecture & Practices
Judgement for Teams through
 Architectural Project Design

• The Past - activity of product development was
  sufficiently consistent over the career of an engineer
  that this architectural view became embedded in
  their professional judgement
• Now - the visualization and simulation becomes a
  learning centred planning exercise through
  collaborative modelling that stimulates and
  enhances judgement
• Result - promotes accelerated convergence on
  shared objectives and options for proceeding
Project Design Introduction
  Rapid modeling & simulation of complex projects & portfolios


-- Basic R&D at MIT, U Tokyo, U Conn 1994-1999 –
         -- Applied in Industry since 2001 --
   -- Platform for Program Strategy Dialogue --
          -- Collaborative Visual Design --
   -- Forward-looking Forecasts and Analytics --

     September 2009                                              13
Collaborative Visual Model
showing PBS & Mutual Dependence

•   Shows the (PBS)
    Product Breakdown
    Structure and its
    relationship to the
    Activities


•   Mutual and
    concurrent
    dependence can be
    captured, and impact
    simulated.
Visual Modelling
 from OBS Point of View
• Shows Organizational
  Relationship and
  Primary Responsibility
  for each Activity

• The multiple views of
  the same project
  stimulate real time
  dialogue and insights.
Rapid, Iterative Forecasts
    Lead to Situational Awareness


•   An engaging experience for team
    leaders similar to:
     – practices for sports competition
     – field exercises in the military
     – rehearsals for performance

•   Early mission studies don’t
    normally include feasibility from a
    PM point of view

•   With Project design, program
    feasibility can be weighed as part of
    the overall mission strategy
Forecast Accuracy through
Converging Iteration
• As a project design exercise proceeds, relevant
  elements in a model and forecasts of likely
  schedule, cost, and risks improve

• Teams are stimulated to understand when,
  where and why coordination occurs

• Understanding that lack of coordination will
  cause systemic, propagating delay, rework, and
  poor quality is critical
Forecasts include Work, Coordination
and Wait Driven Low Utilisation

•   Coordination activities across teams are
     least likely to be predicted based on previous
     judgement


         Includes coordination effort,
          costs and schedule impact
Coordination is Real Effort and
Impact on Schedule Clearly Visible
               Team Effort Forecasts


19
Visual, Collaborative Design: Demonstration

•   Movie here
Our approach helps identify the most appropriate information
architecture for a complex system, shows how the information
architecture relates to product, process, and organizationalstructures
and how they can persist and evolve. Further, our approach outlines
how teams can forecast, budget and perform coordination activities
using the information architecture.


INTEGRATION INTO INFORMATION ARCHITECTURE &
PRACTICES
Information Architecture: Lifecycle
Model
Iterated Project Design                                    System                  As Designed
Product/Organizational    Functions       Operational                            Product Structure
                                            States      Specifications
       Structure


         As-Maintained         As-Built
                                                             Master Production
                                                                Schedule
Growth of Information Through
                           Project Activity
                            Product, Project, Organizational
                            Information Structure

100%                                                         Shuttle
  Information & Learning


                                                Engines            ----
                                                                       Product/Project Information
                                                                                                                           Operation,
                             controls   computer          wiring                                                           Maintenance,
                                                                                                                 Commis.   Training
                                                          ----                                   Field Testing
                                           ----
                                                                                   Assembly
                                                               Manufacturing
                                                                                          Engineering and
                                        Detailed Design
                                                                                          Business Processes
                              Concept


                                 Information Generation,              Archiving and,     Distribution
               0
Achieving Value via Interplay of
Architectures

                             Information that spans products, teams,
                             and generations. Sustainable, relevant,
                             and evolving rather than a passive data
                             dump. (~50 years+).


                             Systems and artifact structure and
                             elements: as required, as designed, as
                             built, as operated and maintained.
                             Through retirement and generational re-
                             use. (~30 years+).


                             Organization focus and activity tied to
                             teams, budgets, deliverables, and
                             schedule with finite start and completion
                             (~10 years+).


                             Objective centered activity day to day,
                             week to week across architectures
                             (product, process, org). Guided by SE,
                             PM, and embedded work culture
                             standards.
Case Study


• Sikorsky S 92: an example of a six location, four
  continent partnership that includes all aspects of
  the aircraft, from marketing through service
Product Life Cycle as a
  Partnership based Activity (1992-)


                                                                             Embraer
                                                                              Brazil


                                                        ± activity quality   M HI
                                                        ± product quality    Japan         partnership
                                                                                           marketing
                                                                                           design
                                       Activity    Sikorsky      Activity    Jingdezhen    engineering
                                      Integrator               Decomposed       China      production
                                                     USA                                   delivery
                                                                                           service

                                                           + design          Gamesa
                                                             ability          Spain
Six location, four continent partnership
that includes all aspects of the aircraft,                                   Taiwan Aerospace
    from marketing through service.                                               Taiwan


                                                                                                         26
Dependency by Subsystem Developer
                                                                                                                                          p1 1


                                                                                                                                          p1 0

                                                                                              Partner
                                                                                                                                          p9
                                                                                              Subsystems
                                                                                                                                          p6


                                                                                                                                          p4


                                                                                                                                          p3


                                                                                                                                          p2


                                                                                                                                          p1

                                                                                                                                              p2 0


                                                                                                                                              p1 9
 Dependency shown as number of interfaces
 shared by subsystems.                                                                                                                        p1 8


                                                                                                                                              p1 7
                                Integrator
                                Subsystems                                                                                                    p1 6


                                                                                                                                              p1 5


                                                                                                                                              p1 4


                                                                                                                                              p1 3


                                                                                                                                              p8


                                                                                                                                              p7


                                                                                                                                              p5
                           p5   p7   p8   p1 3   p1 4   p1 5   p1 6   p1 7   p1 8   p1 9   p2 0   p1   p2   p3   p4   p6   p9   p1 0   p1 1
                                                                                                                                                     27
Dependence across 4 key
                               Subsystems
                                                            upstream system activities
                                                       Subsys6         Subsys1        Subsys16         Subsys5                               Dependence as demand for
                                                                                                                                                interaction by teams.
                                                 s
                                                 p          m    r          m    r          m    r          m    r                            Coordination is activity to
                                                 e    I     f    v    I     f    v    I     f    v    I     f    v                          satisfy the need for interaction.
                                                 c    F     g    w    F     g    w    F     g    w    F     g    w
downstream system activities


                                         spec
                               Subsys6 IF       fs                                    6ri             5ri                     fs
                               Subsys6 mfg            co              3r                                              time-based
                               Subsys6 rvw                  co                                                          (finish to start)
                               Subsys1 IF       fs                                    2r              2r                      co
                               Subsys1 mfg            3r              co                                              continuous flow
                               Subsys1 rvw                                  co                                           (parallel)
                               Subsys16 IF      fs                                                    4i
                               Subsys16 mfg                                           co                              other
                               Subsys16 rvw                                                 co                          (information...)
                               Subsys5 IF       fs
                               Subsys5 mfg            4ri             1ri             5ri 5r          co
                               Subsys5 rvw                                                                  co
                                                                                                                                             Dependence driven by system
                               release                           co              co              co              co
                                                                                                                                             architecture, not just standard
                                                1ri   early some results&info                                                                work processes. These drive
                                                2r    early most results         5r parallel half results                                    demand for coordination (or
                                                3r    early all results          5ri parallel half info & results                           wait and rework) in unexpected
                                                4i    early/para, some info      6ri late most info & results                                            ways.
                                                4ri   early/para some results&info
                                                                                                                                                                      28
Development Project Model &
 Simulation Results

• Product Architecture, Workflow, and
  Partnering (Org) Architectures had
  been selected separately.

• “Perfect Storm”: The combination
  of concurrency, time zones, and
  dispersed decision making of rework
  drove propagating quality issues.

• Traditional schedulers predicted 5
  years to 1st prototype, these
  models predicted ~ 9 years. And
  showed where this delay would
  originate.


    September 2009                      29
Actual Results:
Changes by Subsystem

         A middle phase (Engineering) of the
         development project. Change
         propagating across systems was not
300      predicted in the traditional schedule.                                     p1
280                                                                                 p2
                                                                                    p3
260
                                                                                    p4    3 subsystems spanning
240                                                                                 p5
                                                                                          organization architecture
                                                                                    p6
220
                                                                                    p7     drove most rework (as
200                                                                                 p8
                                                                                                 predicted).
180                                                                                 p9
                                                                                    p10
160
                                                                                    p11
140                                                                                 p12
120                                                                                 p13
                                                                                    p14
100
                                                                                    p15
 80                                                                                 p16
 60                                                                                 p17
                                                                                          Duration to 1st prototype 4
 40
                                                                                          years later than traditional
 20
  0
                                                                                             CPM schedules (as
   350   400   450   500   550   600   650 700   750   800   850   900   950 1000                 predicted).
                                         days


                                                                                                                   30
Complex Development:
“How fast is too fast?”

Initial, complicating assumption
•   Partners should proceed as quickly as possible once specs available

Result
•   Unexpected communication & wait
•   Large amounts of re-work

Correction
•   forecast coordination and its impacts ahead of time
•   allocate and manage coordination when and where most valuable
•   promote concurrency only when systemically beneficial
•   change flow of relative progress = "slow-up", "speed down“
                                                                    31
CONCLUSION
Emphasis on Coordination Practices
Integrated with Both SE and PM


                     Systems
Standards           Engineering


                         Practices

              Project                Coordination    Critical Opportunity for
            Management               Management     Improvement in Complex
                                                     Dispersed Multi-System
                                                           Development
Key Benefits for NASA

• Accurate forecasts of feasible concurrency,
  subsystem integration, schedule and risks
• Coordination: value prediction and allocation,
  waste reduction, & ongoing adjustment
• Information Architecture: Sustainable &
  Integrated into Practices
• Situational Awareness across dispersed
  Centers & Suppliers

Bryan.moser

  • 1.
    Cross-Center Systems Development: CoordinationArchitectures and Practices Presented at: NASA PM 2010 William Grossmann Bryan Moser National Institute of Aerospace Used with Permission
  • 2.
    Outline • Introduction • TheState of Complex System Development • Perfect Storm Leads to Decline in Judgement • Visualization & Simulation across Subsystems • Case Study • Conclusions & Benefits for NASA
  • 3.
    Introduction Today's aerospaceproducts are more complex while being developed by teams located across the globe. The challenge is to optimally organize, direct, and manage these teams, their interactions, dependencies, and priorities during the program.
  • 4.
    The State ofComplex Product Development • Multiple layers of system and subsystem, with substantive design responsibility layers down • Complex dependencies fall across subsystems owned by different teams • Dispersed teams and supply chain with less chance of a shared, common background • Pressure to proceed in a dramatically concurrent fashion, increasing risk of rework, poor quality, and delay
  • 5.
    Perfect Storm Leading toDecline of Judgment • Thinning of the work force • Variation in work practices globally • Dependencies across major subsystems • Cost of coordination is high
  • 6.
    Thinning of thework force • reductions in projects combined with reductions in hiring changed the age - experience composition • a decline in opportunities for design experience – highly qualified technical workers to consider field less desirable. • engineers will work on fewer projects in their lifetimes – less experience across a broad spectrum of technologies • gaps of years between development of new systems – specifically trained and experienced workers may be lost. (National Research Council, 2001)
  • 7.
    Variation in workpractices globally • Technical: to think mathematically, Sound knowledge of basic science, knowledge of a specific discipline, Maintenance of current knowledge and practice • Personal: Ability and willingness to learn, Appreciation of limits to knowledge, Good communication skills, and international dimensions • Professional: Commitment to high standards, of personal and ethical responsibilities, Ability to handle uncertainty, to communicate effectively, in more than one language including English • Managerial: Ability to work in a team, Appreciation of management concepts and issues, Ability to lead and manage personal, financial and technical resources (National Academy of Engineering 2004)
  • 8.
    Impact of dependenciesacross subsystems “Boeing has undertaken a grand business experiment with the Dreamliner. In a bid to tap the best talent and hold down costs, the aerospace icon has engaged in extreme outsourcing, leaving it highly dependent on a far-flung supply chain that includes 43 "top-tier" suppliers on three continents. It is the first time Boeing has ever outsourced the most critical areas of the plane, the wing and the fuselage. About 80% of the Dreamliner is being fabricated by outside suppliers, vs. 51% for existing Boeing planes...” Holmes, S. (June 19, 2006) “The 787 Encounters Turbulence”, BusinessWeek.
  • 9.
    Cost of coordinationis high • A 2004 NIST report claims – 40% of engineering spent locating and validating information – 30% of costs wasted due to poor communication between teams – leading to a loss of US$15.8 billion annually • The cost of failing to provide effective coordination leads to serious project consequences, including significant schedule slip, cost overruns, and project cancellation (National Institute of Science and Technology 2004)
  • 10.
    Visualization & ProjectSimulation across Subsystems Our approach uses a collaborative project design method for complex projects, including the activity of coordination across teams and subsystems. The method is powered by a simulation and visualization engine to gain shared situational awareness. Sustainable, visual tools allow teams to keep their focus on real progress, coordination overhead, and systemic product/system risk throughout. OUR APPROACH
  • 11.
    Benefits of ProjectDesign • Architectural Judgement for Teams • Forecast Accuracy through Converging Iteration • Integration into Information Architecture & Practices
  • 12.
    Judgement for Teamsthrough Architectural Project Design • The Past - activity of product development was sufficiently consistent over the career of an engineer that this architectural view became embedded in their professional judgement • Now - the visualization and simulation becomes a learning centred planning exercise through collaborative modelling that stimulates and enhances judgement • Result - promotes accelerated convergence on shared objectives and options for proceeding
  • 13.
    Project Design Introduction Rapid modeling & simulation of complex projects & portfolios -- Basic R&D at MIT, U Tokyo, U Conn 1994-1999 – -- Applied in Industry since 2001 -- -- Platform for Program Strategy Dialogue -- -- Collaborative Visual Design -- -- Forward-looking Forecasts and Analytics -- September 2009 13
  • 14.
    Collaborative Visual Model showingPBS & Mutual Dependence • Shows the (PBS) Product Breakdown Structure and its relationship to the Activities • Mutual and concurrent dependence can be captured, and impact simulated.
  • 15.
    Visual Modelling fromOBS Point of View • Shows Organizational Relationship and Primary Responsibility for each Activity • The multiple views of the same project stimulate real time dialogue and insights.
  • 16.
    Rapid, Iterative Forecasts Lead to Situational Awareness • An engaging experience for team leaders similar to: – practices for sports competition – field exercises in the military – rehearsals for performance • Early mission studies don’t normally include feasibility from a PM point of view • With Project design, program feasibility can be weighed as part of the overall mission strategy
  • 17.
    Forecast Accuracy through ConvergingIteration • As a project design exercise proceeds, relevant elements in a model and forecasts of likely schedule, cost, and risks improve • Teams are stimulated to understand when, where and why coordination occurs • Understanding that lack of coordination will cause systemic, propagating delay, rework, and poor quality is critical
  • 18.
    Forecasts include Work,Coordination and Wait Driven Low Utilisation • Coordination activities across teams are least likely to be predicted based on previous judgement Includes coordination effort, costs and schedule impact
  • 19.
    Coordination is RealEffort and Impact on Schedule Clearly Visible Team Effort Forecasts 19
  • 20.
    Visual, Collaborative Design:Demonstration • Movie here
  • 21.
    Our approach helpsidentify the most appropriate information architecture for a complex system, shows how the information architecture relates to product, process, and organizationalstructures and how they can persist and evolve. Further, our approach outlines how teams can forecast, budget and perform coordination activities using the information architecture. INTEGRATION INTO INFORMATION ARCHITECTURE & PRACTICES
  • 22.
    Information Architecture: Lifecycle Model IteratedProject Design System As Designed Product/Organizational Functions Operational Product Structure States Specifications Structure As-Maintained As-Built Master Production Schedule
  • 23.
    Growth of InformationThrough Project Activity Product, Project, Organizational Information Structure 100% Shuttle Information & Learning Engines ---- Product/Project Information Operation, controls computer wiring Maintenance, Commis. Training ---- Field Testing ---- Assembly Manufacturing Engineering and Detailed Design Business Processes Concept Information Generation, Archiving and, Distribution 0
  • 24.
    Achieving Value viaInterplay of Architectures Information that spans products, teams, and generations. Sustainable, relevant, and evolving rather than a passive data dump. (~50 years+). Systems and artifact structure and elements: as required, as designed, as built, as operated and maintained. Through retirement and generational re- use. (~30 years+). Organization focus and activity tied to teams, budgets, deliverables, and schedule with finite start and completion (~10 years+). Objective centered activity day to day, week to week across architectures (product, process, org). Guided by SE, PM, and embedded work culture standards.
  • 25.
    Case Study • SikorskyS 92: an example of a six location, four continent partnership that includes all aspects of the aircraft, from marketing through service
  • 26.
    Product Life Cycleas a Partnership based Activity (1992-) Embraer Brazil ± activity quality M HI ± product quality Japan partnership marketing design Activity Sikorsky Activity Jingdezhen engineering Integrator Decomposed China production USA delivery service + design Gamesa ability Spain Six location, four continent partnership that includes all aspects of the aircraft, Taiwan Aerospace from marketing through service. Taiwan 26
  • 27.
    Dependency by SubsystemDeveloper p1 1 p1 0 Partner p9 Subsystems p6 p4 p3 p2 p1 p2 0 p1 9 Dependency shown as number of interfaces shared by subsystems. p1 8 p1 7 Integrator Subsystems p1 6 p1 5 p1 4 p1 3 p8 p7 p5 p5 p7 p8 p1 3 p1 4 p1 5 p1 6 p1 7 p1 8 p1 9 p2 0 p1 p2 p3 p4 p6 p9 p1 0 p1 1 27
  • 28.
    Dependence across 4key Subsystems upstream system activities Subsys6 Subsys1 Subsys16 Subsys5 Dependence as demand for interaction by teams. s p m r m r m r m r Coordination is activity to e I f v I f v I f v I f v satisfy the need for interaction. c F g w F g w F g w F g w downstream system activities spec Subsys6 IF fs 6ri 5ri fs Subsys6 mfg co 3r time-based Subsys6 rvw co (finish to start) Subsys1 IF fs 2r 2r co Subsys1 mfg 3r co continuous flow Subsys1 rvw co (parallel) Subsys16 IF fs 4i Subsys16 mfg co other Subsys16 rvw co (information...) Subsys5 IF fs Subsys5 mfg 4ri 1ri 5ri 5r co Subsys5 rvw co Dependence driven by system release co co co co architecture, not just standard 1ri early some results&info work processes. These drive 2r early most results 5r parallel half results demand for coordination (or 3r early all results 5ri parallel half info & results wait and rework) in unexpected 4i early/para, some info 6ri late most info & results ways. 4ri early/para some results&info 28
  • 29.
    Development Project Model& Simulation Results • Product Architecture, Workflow, and Partnering (Org) Architectures had been selected separately. • “Perfect Storm”: The combination of concurrency, time zones, and dispersed decision making of rework drove propagating quality issues. • Traditional schedulers predicted 5 years to 1st prototype, these models predicted ~ 9 years. And showed where this delay would originate. September 2009 29
  • 30.
    Actual Results: Changes bySubsystem A middle phase (Engineering) of the development project. Change propagating across systems was not 300 predicted in the traditional schedule. p1 280 p2 p3 260 p4 3 subsystems spanning 240 p5 organization architecture p6 220 p7 drove most rework (as 200 p8 predicted). 180 p9 p10 160 p11 140 p12 120 p13 p14 100 p15 80 p16 60 p17 Duration to 1st prototype 4 40 years later than traditional 20 0 CPM schedules (as 350 400 450 500 550 600 650 700 750 800 850 900 950 1000 predicted). days 30
  • 31.
    Complex Development: “How fastis too fast?” Initial, complicating assumption • Partners should proceed as quickly as possible once specs available Result • Unexpected communication & wait • Large amounts of re-work Correction • forecast coordination and its impacts ahead of time • allocate and manage coordination when and where most valuable • promote concurrency only when systemically beneficial • change flow of relative progress = "slow-up", "speed down“ 31
  • 32.
  • 33.
    Emphasis on CoordinationPractices Integrated with Both SE and PM Systems Standards Engineering Practices Project Coordination Critical Opportunity for Management Management Improvement in Complex Dispersed Multi-System Development
  • 34.
    Key Benefits forNASA • Accurate forecasts of feasible concurrency, subsystem integration, schedule and risks • Coordination: value prediction and allocation, waste reduction, & ongoing adjustment • Information Architecture: Sustainable & Integrated into Practices • Situational Awareness across dispersed Centers & Suppliers