Download to read offline
![International Research Journal of Engineering and Technology (IRJET) e-ISSN: 2395-0056
Volume: 06 Issue: 08 | Aug 2019 www.irjet.net p-ISSN: 2395-0072
© 2019, IRJET | Impact Factor value: 7.34 | ISO 9001:2008 Certified Journal | Page 534
IoT Based Air Pollution 6Monitoring System using Arduino
Monika Singh1, Misha Kumari2, Pradeep Kumar Chauhan3
1,2Department of CSE, Bharat Institute of Technology, Meerut, Uttar Pradesh, India
3Assistant Professor, Dept. of CSE, Bharat Institute of Technology, Meerut, Uttar Pradesh, India
---------------------------------------------------------------------***----------------------------------------------------------------------
Abstract: In today’s scenario we are facing a big problem
which is pollution. Not India or only Indian people facing this
problem. Our whole world faces this problem of pollution.
Pollution is of many types like air pollution, water pollution,
noise pollution, nuclear pollution, etc. But here we are
discussing the harmful effects of air pollution and the solution
to air pollution. The level of pollution increasing day by day.
The level of pollution is increasing day by day due to factors
like industries, urbanization, increasing in population,
increasing in use of a vehicle which can affect human health.
In the Internet Of Things based Air Pollution Monitoring,
system monitors Air quality from the above web server using
the internet. When air quality goes down it triggers an alarm.
Air quality goes down when enough amount of harmful gases
present in the air like carbon dioxide, smoke, alcohol, benzene,
NH3, and NOx. The air quality will be shown in Parts per
million on the LCD and as well as on webpage so that air
pollution can be monitoredveryeasily. ThesystemusesMQ135
and MQ6 sensor for monitoring Air Quality. It measures their
amount exactly and finds out harmful gases.
Key Words: Air Pollution, MQ135 Sensor, IoT, Arduino Uno
1.INTRODUCTION
This is all about Air pollution. How we can minimize the
pollution rate we will discuss in this paper.
1.1 Air pollution Problem
The main problem of every nation or country is pollution,
the country is of any type developed or developing. Urban
areas of developing countries have a growing rate of health
problems. Health problems are increased due to an increase
in industrialization and vehicles which releases lots of
gaseous pollutants.Pollution hasmanyharmful effectswhich
are an allergy, reactions, irritation in the throat, eyes, and
nose. It has some serious problems also like pulmonary
catarrh, diseases of heart, congestion of lung, lung and
provoke asthma. In pursuance of a survey, due to air or
humidity pollution 50,000 to 100,000 precociousdeathsper
year occur in the U.S. deaths per year occur whereas in
European Union number reaches to 300,000 and over
3,000,000 worldwide [1]. In the atmosphere, primary
pollutants are also called as Various kinds of anthropogenic
emissions are pumped which experience reaction of
chemical and afore leads to the fabrication of newpollutants
which are called as a secondary type of pollutants. These
pollutants are responsible for problems of health[2].
Nowadays approximately every citizen spends90percentof
their time in indoor air or environment. Quality of air of
indoor is also get reduced because of theuseofvarioustypes
of machine in indoor.[3]. The air quality of cities of
developed countries needs improvement in recent time [4].
In today’s era, the buildings are designed which have low
power consumption and the number of ventilation is also
decreases which decrease the air quality inside the building
[5].
1.2 Air Quality Monitoring Systems
The meters available in the market which is called a
commercial meter detects the pollution. In this field, the
researchers have introduced various types of monitoring
systems which measures air quality.[6] [1] [7]. In pursuance
of intended function each technology has limited uses,
Bluetooth is a lesser range type of system ofcommunication,
through Global System for Mobile we notify by using a
message only. Any type of system which is present and
monitors various types of gases which exist in the
environment like carbon monoxide, carbon dioxide, smoke,
Liquified Petroleum Gas, iso-Propane, iso-Butane. It also
monitors the hotness of temperature and humidity in the
environment or the air at that time and monitors these
parameters at a distal location,orthemostcrucial parameter
it provides extra precaution and protection and provides
some parameters which are important to all users such as
temperature and humidity to every person in the between
limit of the monitoring system. This paper proposes such a
system which detects pollution.
1.3. Research Contribution of this Paper
The outcomes which is possible that can be gained by
using this analysis are given as follows:
For some extent, we can reduce pollutionwhen
we see harmful gases in the air.](https://image.slidesharecdn.com/irjet-v6i892-191127081907/75/IRJET-IoT-based-Air-Pollution-Monitoring-System-using-Arduino-1-2048.jpg)
![International Research Journal of Engineering and Technology (IRJET) e-ISSN: 2395-0056
Volume: 06 Issue: 08 | Aug 2019 www.irjet.net p-ISSN: 2395-0072
© 2019, IRJET | Impact Factor value: 7.34 | ISO 9001:2008 Certified Journal | Page 535
We minimize the use of harmful fuel in our
vehicles. We use CNG which is not enough
harmful like other fuel.
We have to reduce industrialization and
urbanization.
2. RELATED WORK
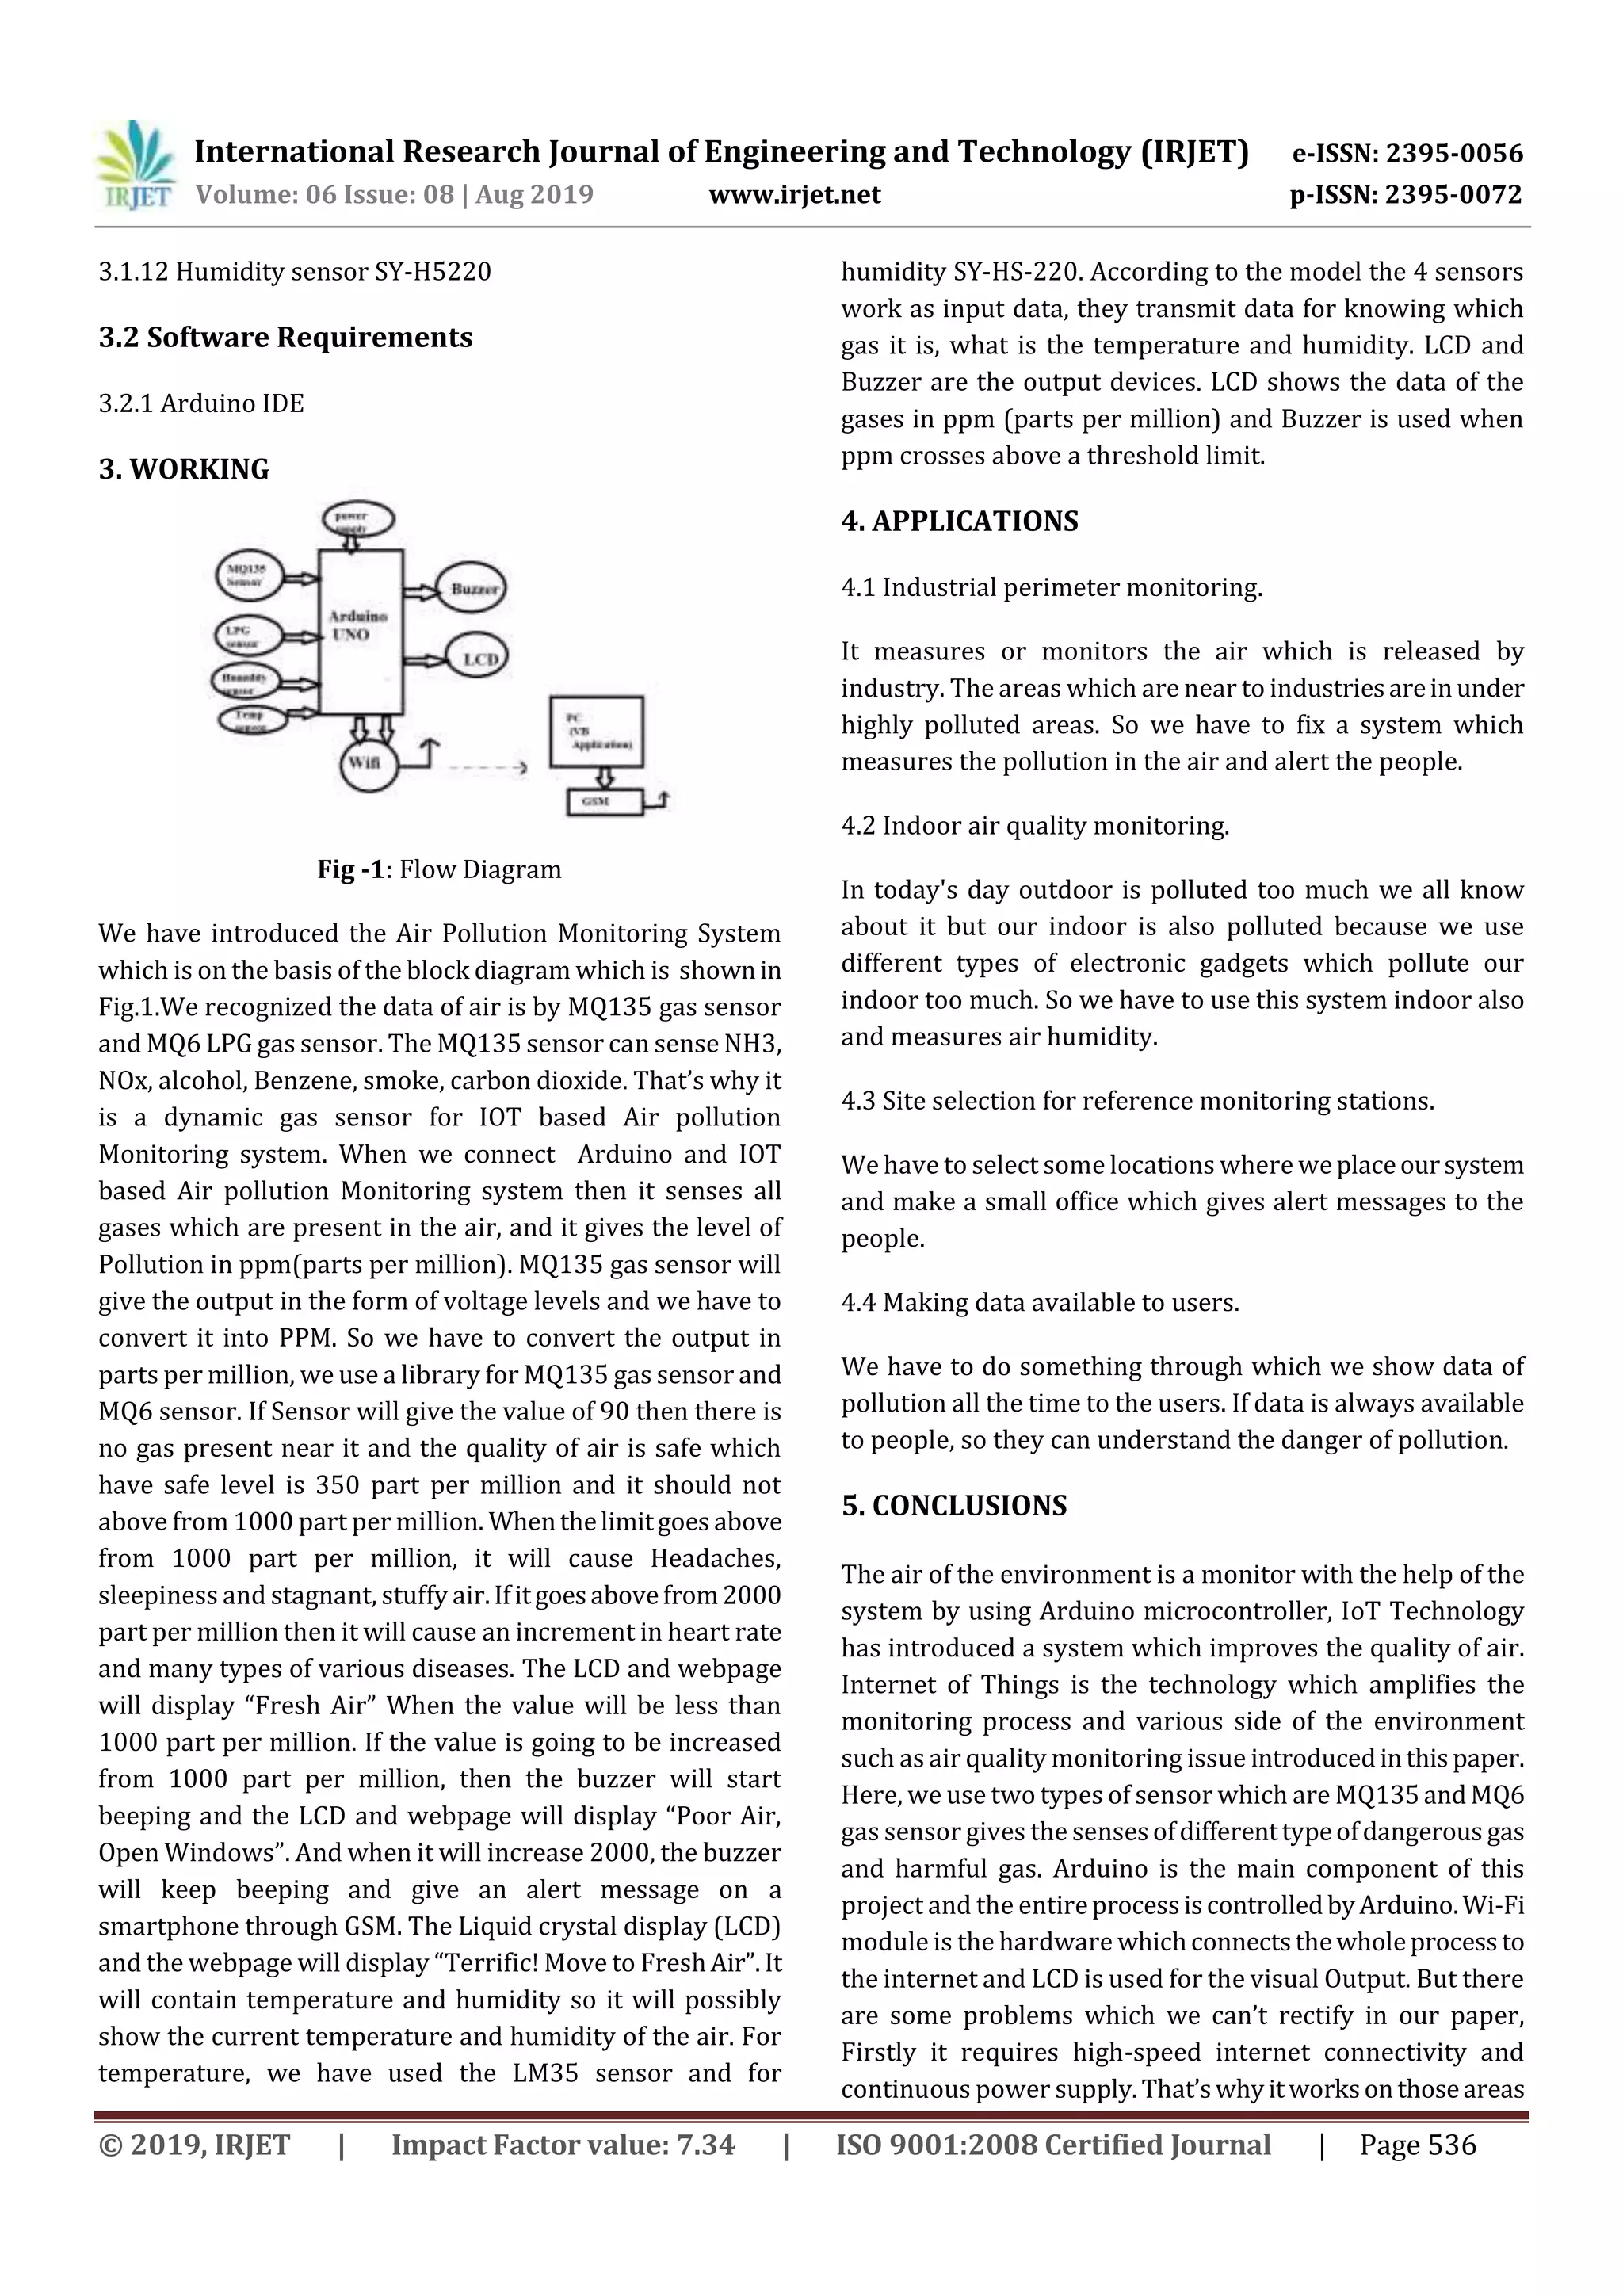
Here we monitor the pollution in the air by using sensors,
Arduino, LCD, buzzer, etc. Air Pollution Monitoring System
on the basis of Internet of Things monitors the Air Quality
over a webserver using internet and will trigger an alarm
when the air quality goes down beyond a certain level when
there are amount of harmful gases present in the air like
CO2, smoke, alcohol, benzene, NH3, NOx, and LPG. The
system will show the air quality in parts per million on the
LCD and as well as on webpages so that it can be monitored
very easily. Temperature and Humidity are detected and
monitored in the system. There is some disadvantage of the
traditional monitoring instruments like their large size,
heavyweight and extraordinaryexpensiveness.Theseleadto
sparse deployment of the monitoring stations. In orderto be
effective, the locations of the monitoring stations need
careful placement because the situation of air pollution in
urban areas is very related to humanactivitiesandthetraffic
dilemma have much worse air quality than average.
Fig-1: Relation between Pollution and Time
2.1 Motivation
LPG gas is detected using the MQ6 sensorandMQ135sensor
is used to monitor the Air Quality as it diagnoses most
dangerous gases and it can also measure their amount
accurately. In this project which is based on the Internet of
Things, you can monitor the level of pollution from
everywhere by using your computer or mobile. This system
can be installed everywhere and it can also trigger some
device when pollution goes beyond some level and we can
send an alert message to the user.]
Table -1: Analysis Table
S.No IoT Software
Platform
Integration Security
1. IOT Analysis
platform
Thing Worx APIs Encryption
of Link
2.
Amazon Web
Services IoT
platform
Representational
state transfer
Application
program
interface
Encryption
of Link
3. Bosch IoT Suite
- MDM IoT
Platform
Representational
state transfer
Application
program
interface
Unknown
4. Ericsson Device
Connection
Platform
Representational
state transfer
Application
program
interface
Encryption
of Link
5.
Appcelerator
Representational
state transfer
Application
program
interface
Encryption
of Link
3. REQUIREMENTS
3.1 Hardware Requirements
3.1.1 Gas sensor MQ135
3.1.2 Arduino Uno
3.1.3 ESP8266 Wi-Fi module
3.1.4 LCD 16x2
3.1.5 Breadboard
3.1.6 Potentiometer 10K
3.1.7 Ohm resistors 1K
3.1.8 Ohm resistor 220
3.1.9 Buzzer
3.1.10 MQ 6 LPG gas sensor
3.1.11 Temperature sensor LM35](https://image.slidesharecdn.com/irjet-v6i892-191127081907/75/IRJET-IoT-based-Air-Pollution-Monitoring-System-using-Arduino-2-2048.jpg)

This document describes an IoT-based air pollution monitoring system using Arduino. The system monitors air quality using sensors to detect harmful gases like carbon dioxide, smoke, and NOx. It displays the air quality in parts per million on an LCD screen and webpage. When air quality is poor or hazardous, it triggers an alarm. The system aims to easily monitor air pollution and provide alerts to encourage reducing pollution levels. It uses MQ135 and MQ6 sensors to accurately measure pollutants and temperature and humidity sensors.