
Recommended
Recommended
More Related Content
What's hot
What's hot (20)
Similar to IOT BASED AIR POLLUTION MONITORING
Similar to IOT BASED AIR POLLUTION MONITORING (20)
Recently uploaded
Recently uploaded (20)
IOT BASED AIR POLLUTION MONITORING
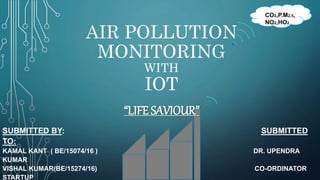
- 1. AIR POLLUTION MONITORING WITH IOT SUBMITTED BY: SUBMITTED TO: KAMAL KANT ( BE/15074/16 ) DR. UPENDRA KUMAR VISHAL KUMAR(BE/15274/16) CO-ORDINATOR STARTUP CO2,P.M2.5, NO2,HO2 “LIFE SAVIOUR”
- 2. THE PROBLEM • Increasing concentration of harmful gases in atmosphere.Problem? • All living 0rganism suffer from serious disease relating to respiration and lungs. Who has this problem? • To save human life and to control hazardous air pollution that is increasing day by day. Why should this problem be solved? • With the help of monitoring air pollutants with real-time data, can take preventive measures which gradually help in controlling the air pollution. How will we know this problem has been solved?
- 3. BACKGROUND INFORMATION • The model is using the VGA Monitor interfacing with microcontroller for directly displaying the monitored data, also helps to replace bulky and costly displays. • The increase in popullation and infrastructures alongside increases the pollution which can severly harm the living being and the environment. • On daily news relating to incresed air pollution and its harmfull effect made a matter of concern for our research. The following references is also been used: • Daily NEWS • Project mentor experience • Internet
- 4. WORKABLE SOLUTIONS Solution This model requires microcontroller and gaseous sensors. The final project model will take a form of portable device for plug-n-play at any vga display monitor. This device need to be mounted over vehicles for monitoring wide area and providing a real time data.
- 5. THE PROTOTYPE • Choose the best workable solution and create a plan to build a prototype • What materials will you use for your prototype? • The prototype be a model and also be further worked on to make more compact. <Insert a picture or drawing of your prototype here>
- 7. SENSORS DETAILS SENSOR SPECIFICATION DHT22 TEMPERATURE ,HUMIDITY MQ-7 CARBON MONOXIDE MQ-135 AIR QUALITY SENSOR DS3231 DATE AND TIME SENSOR SDS021 PARTICULATE MATTER
- 8. WORKING
- 9. TESTING THE PROTOTYPE • What worked? What did not work? Why? • What materials need to be changed and/or kept? Why? • Did the size of your prototype give you enough information to move forward with a final product? Why or why not? • Did you have other people test your design and give you feedback? Why or why not?
- 10. HOW DATA FROM SENSORS ARE UPLOADED OVER CLOUD
- 12. HOW TO USE • BASICALLY THE DATA STORED OVER CLOUD WILL BE ACCESSIBLE TO ALL AS WE ARE PROVIDING A WEB SERVICE TO THEM FROM WHICH THEY CAN GATHER ANY INFORMATION RELATED TO AIR POLLUTANTS IN THEIR VICINITY.
- 14. HOW THIS CAN HELP
- 15. REDESIGNING THE PROTOTYPE • Use the data from your testing to redesign with… • Different materials • Different builds • Different sizes • Write about or show images of your prototype redesigning process and result
- 16. FINAL RESULT • Once you have a final product, go back to your second slide and review the initial questions you answered • Does your final prototype solve your problem for the person or people for whom it needs to be solved? • If yes, WAY TO GO! But always think about if you can improve it even more! • If no, copy this PowerPoint and start the problem/solution cycle again • Insert pictures of your final design • Discuss why this design solves the problem • Reflect on how you feel about the process from start to finish in this project