Downloaded 2,231 times


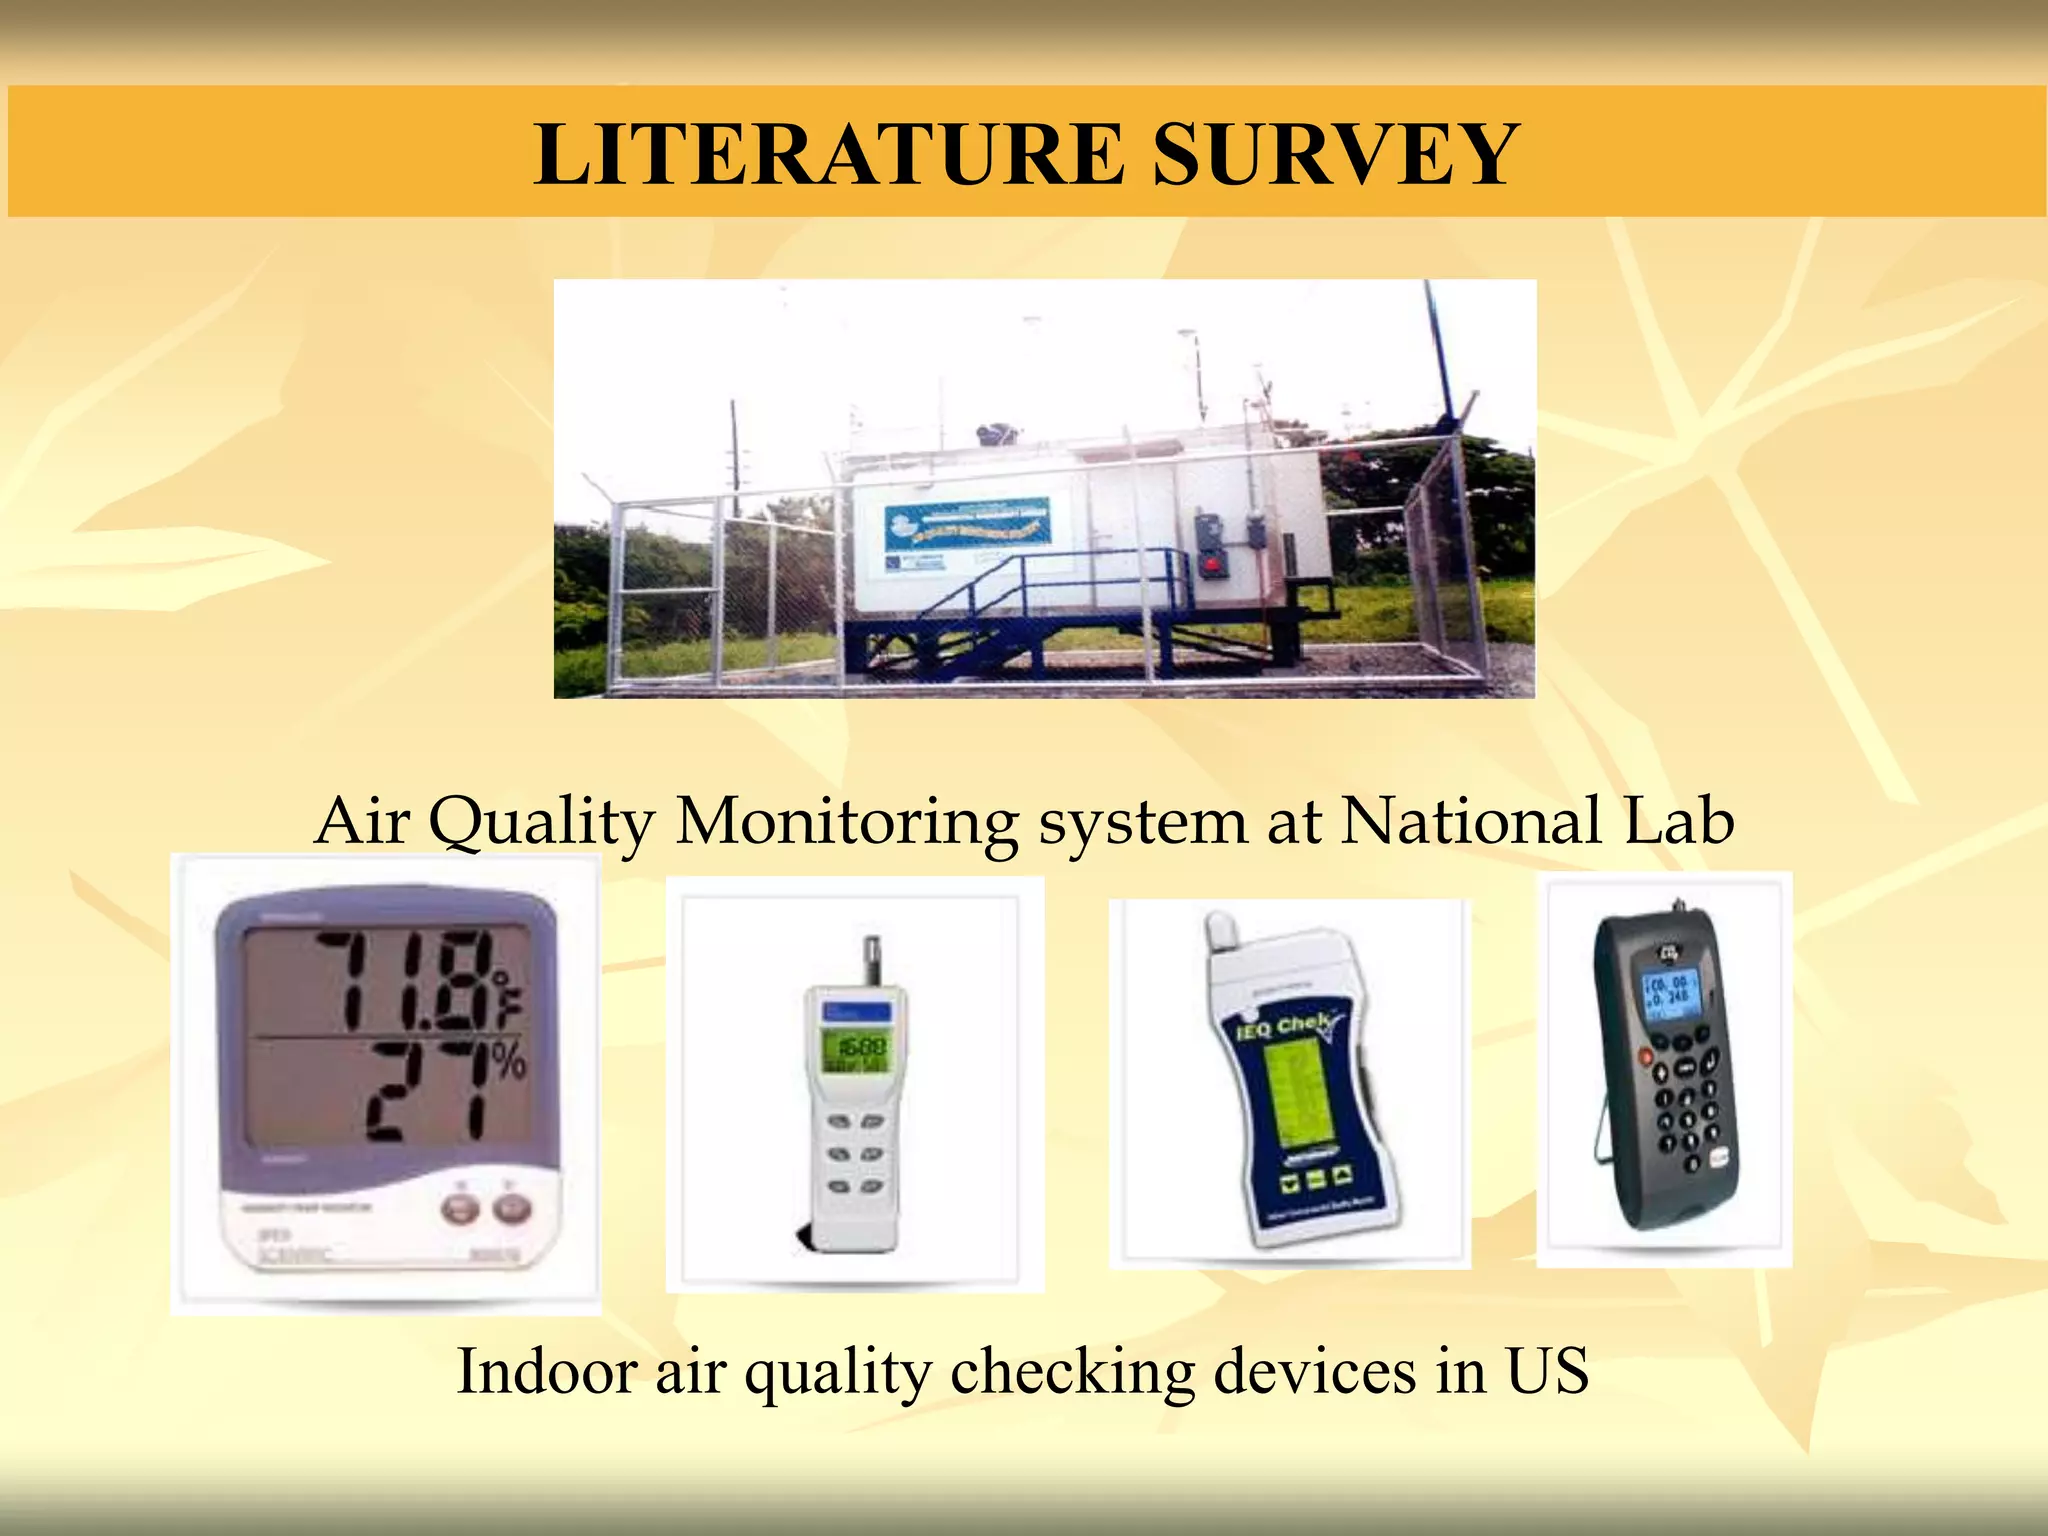
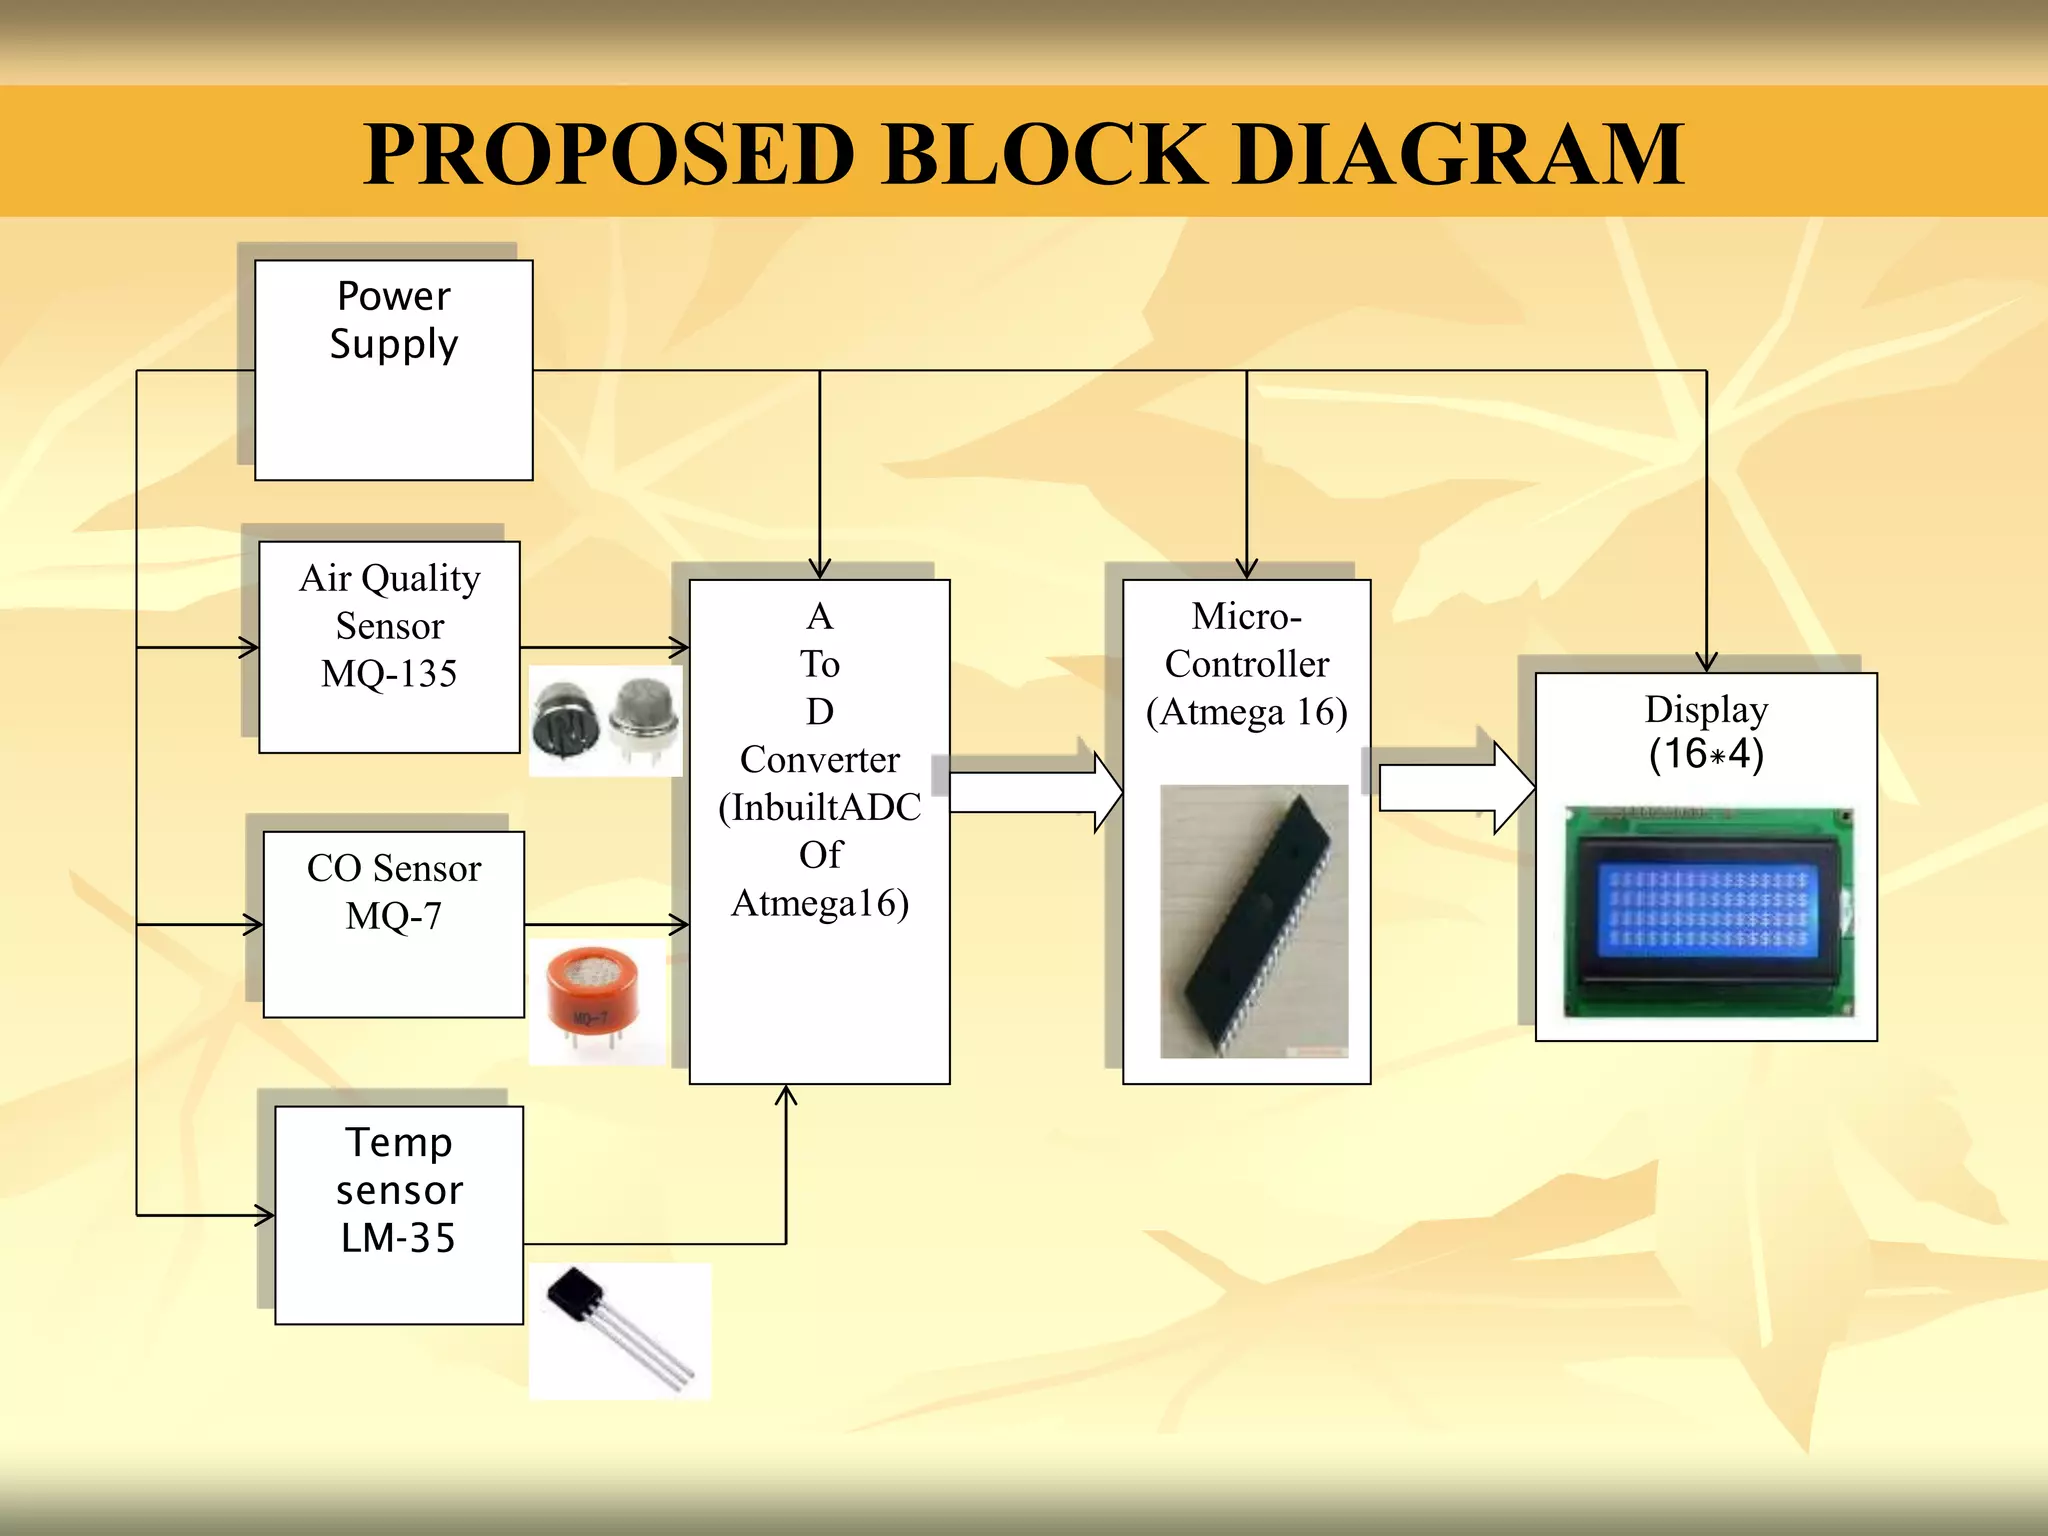
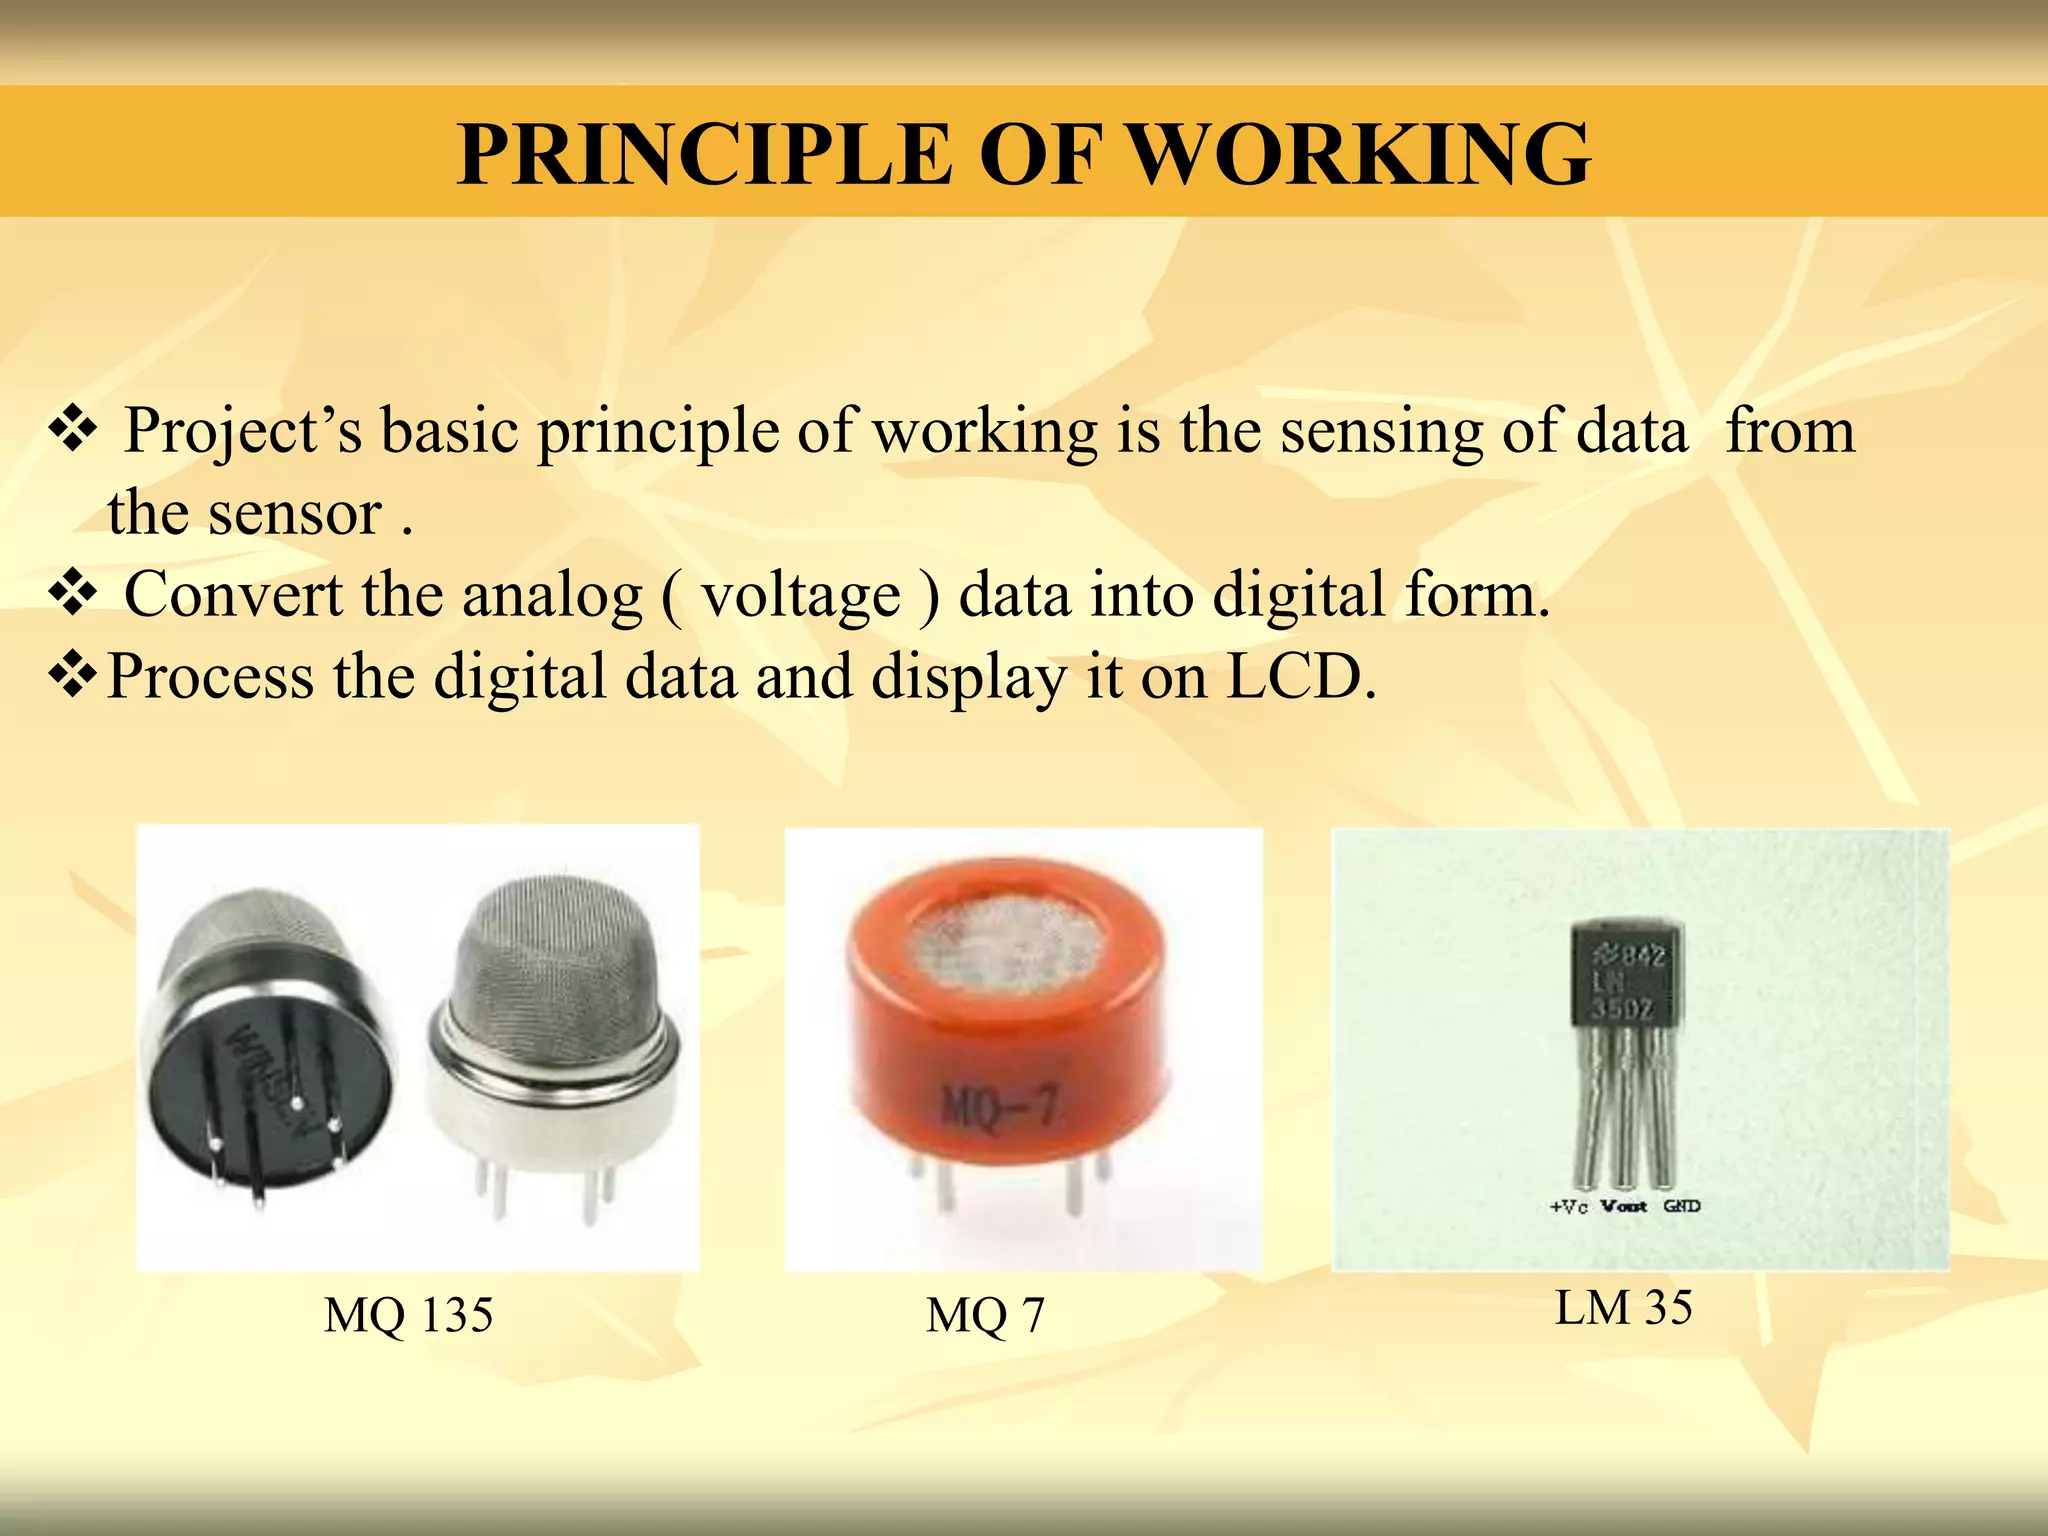
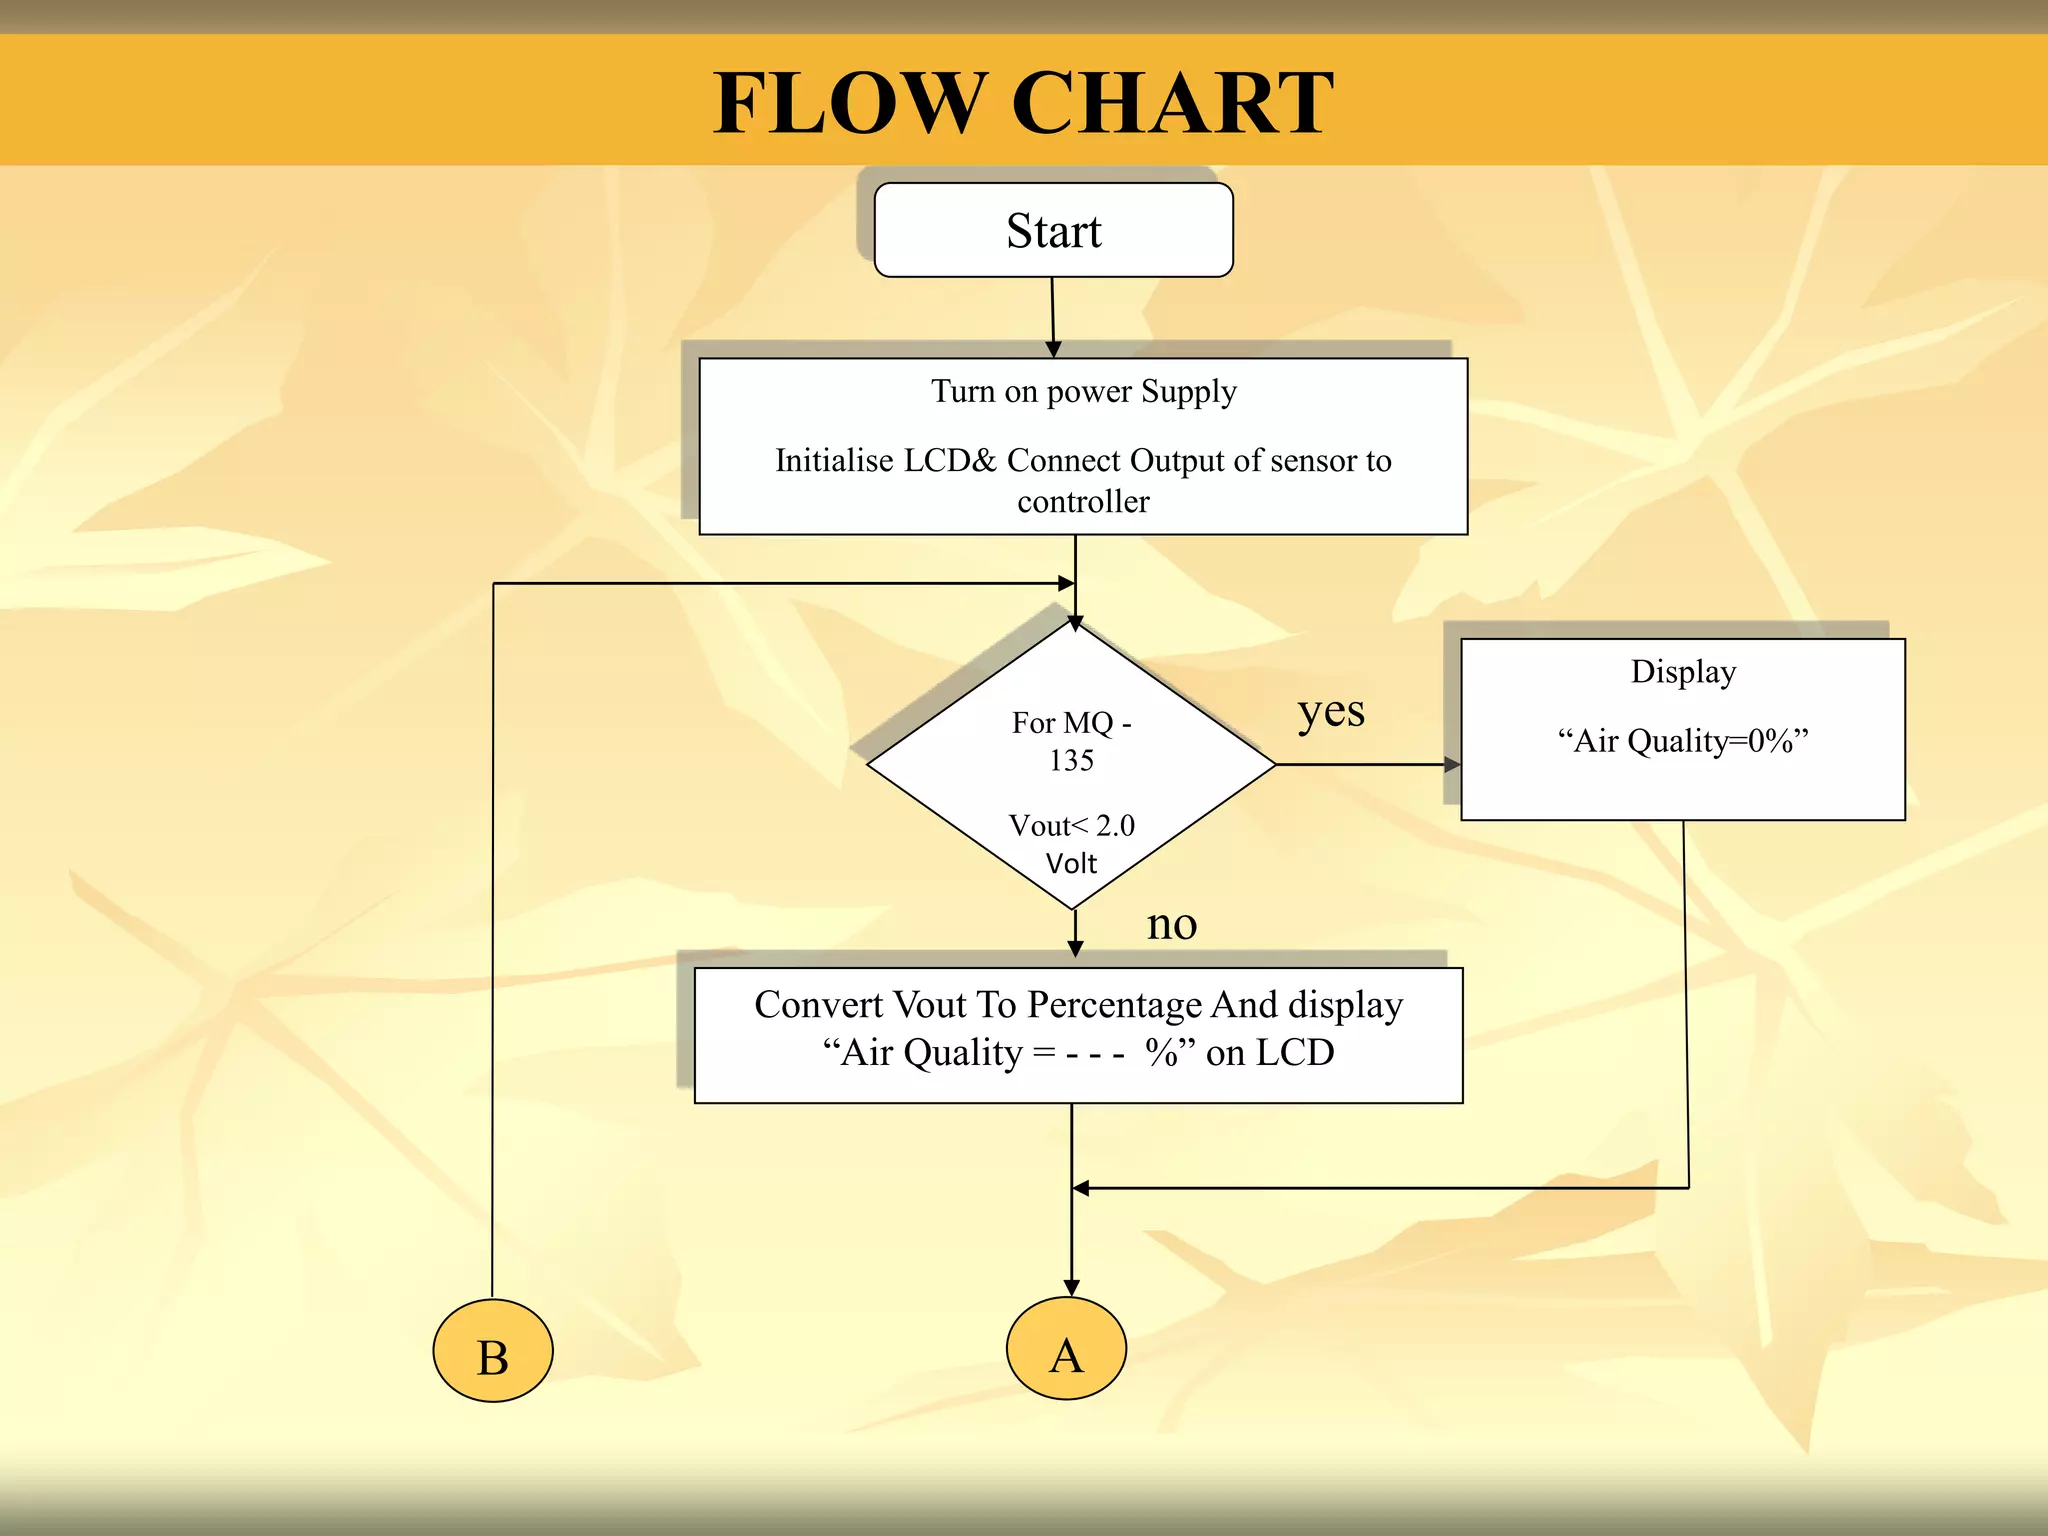
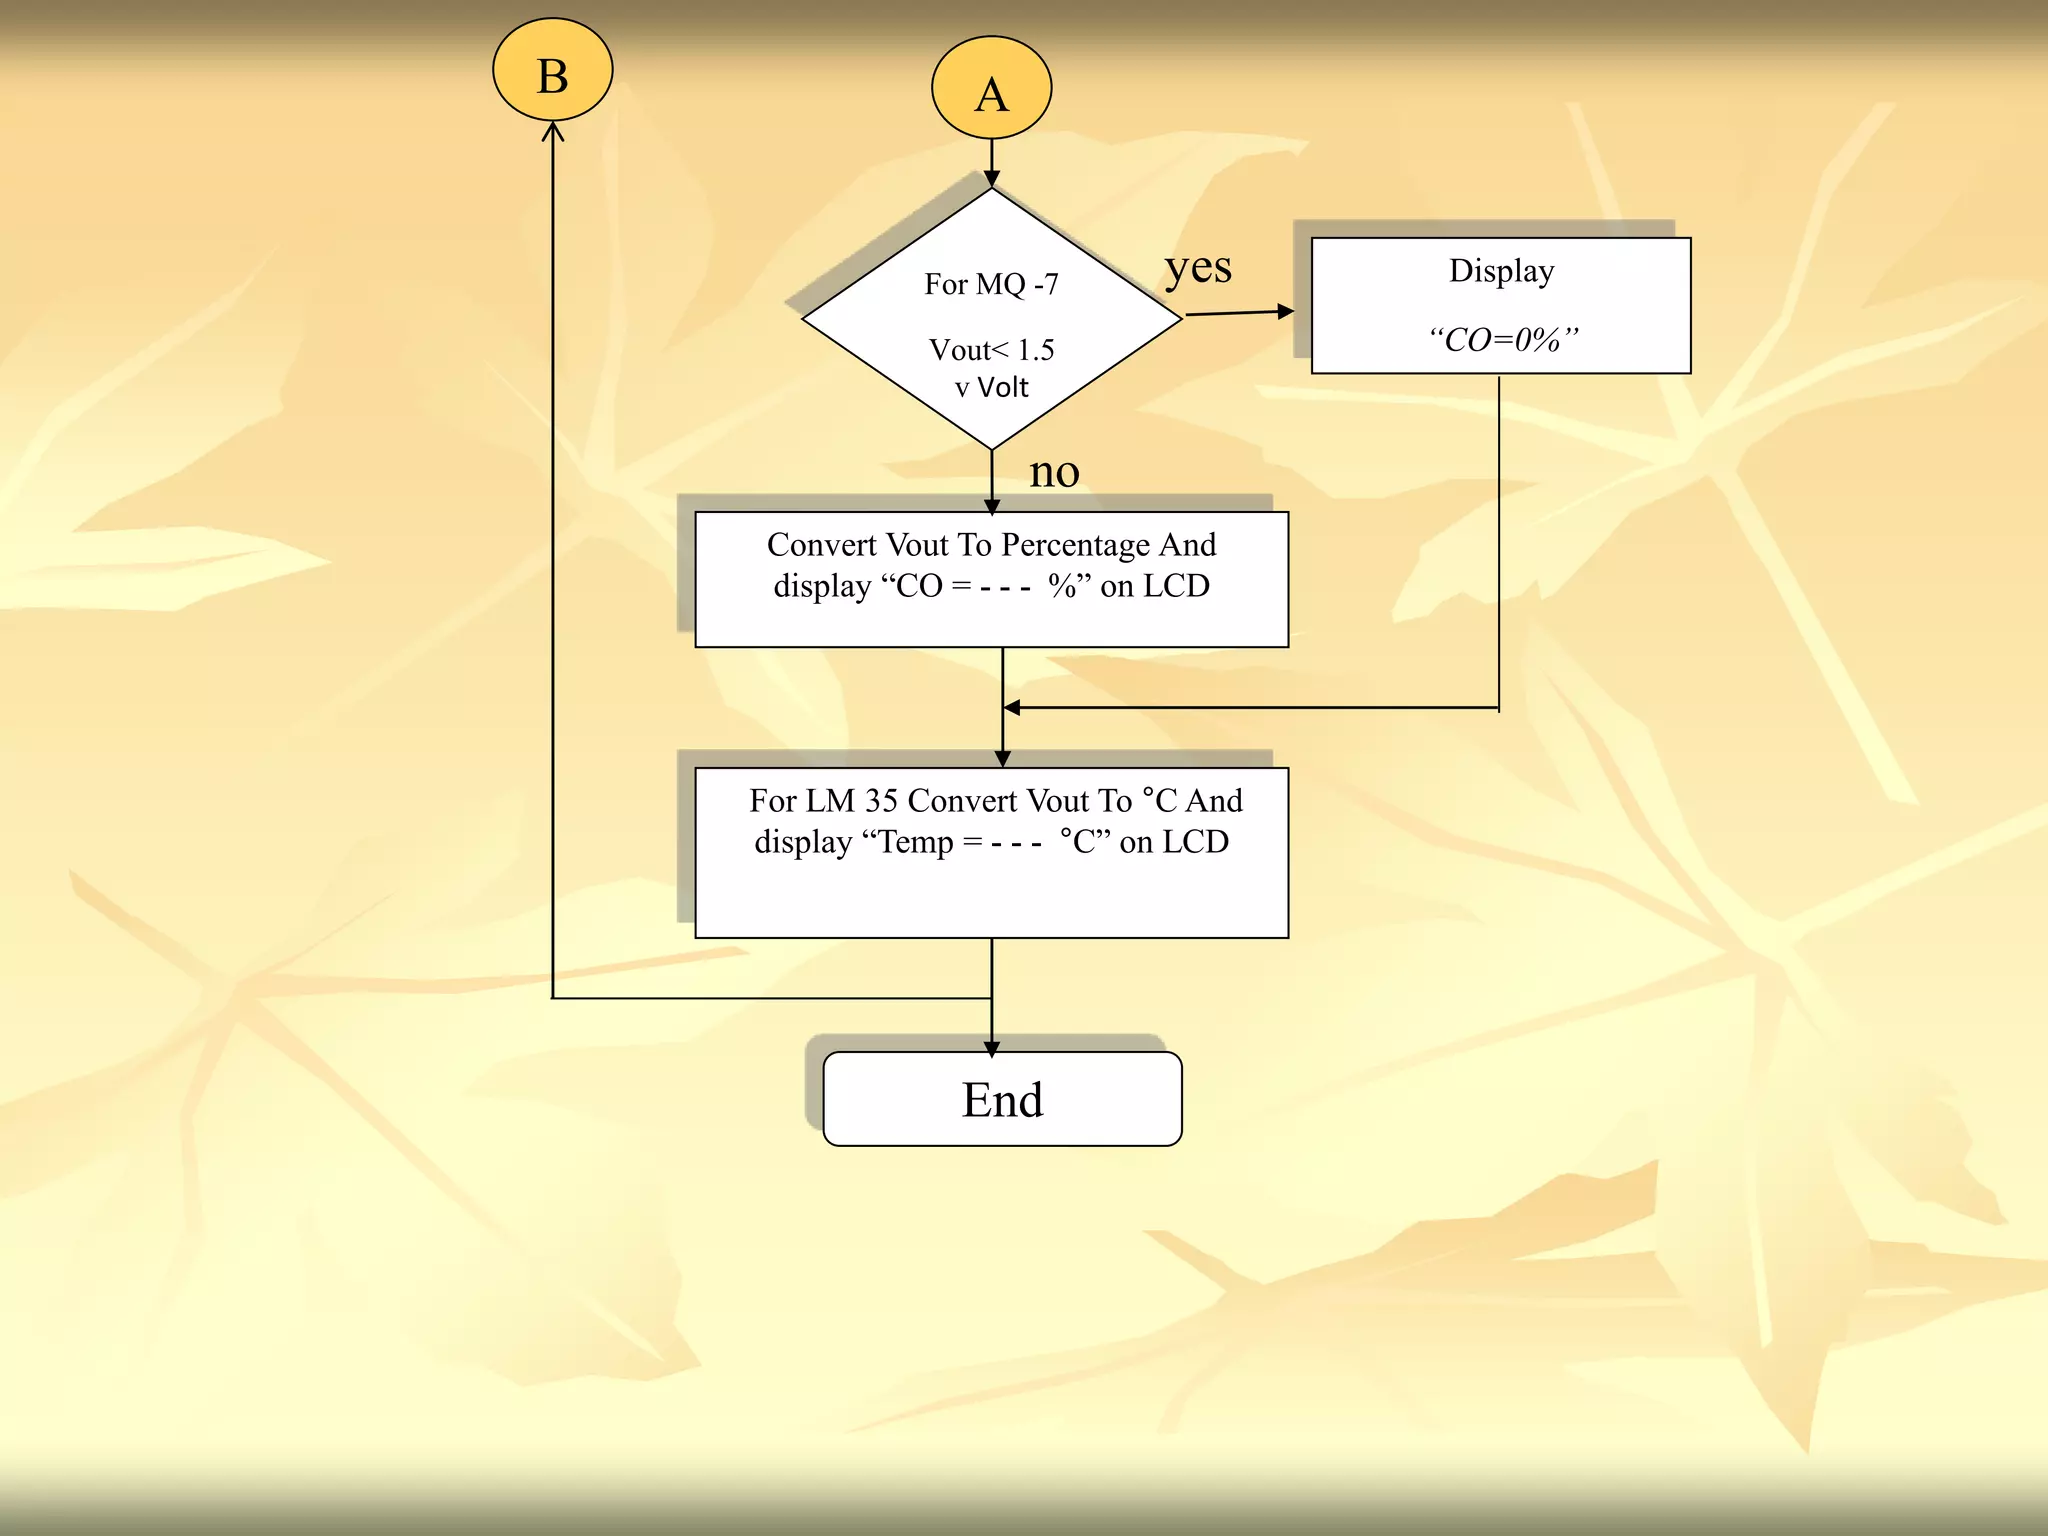
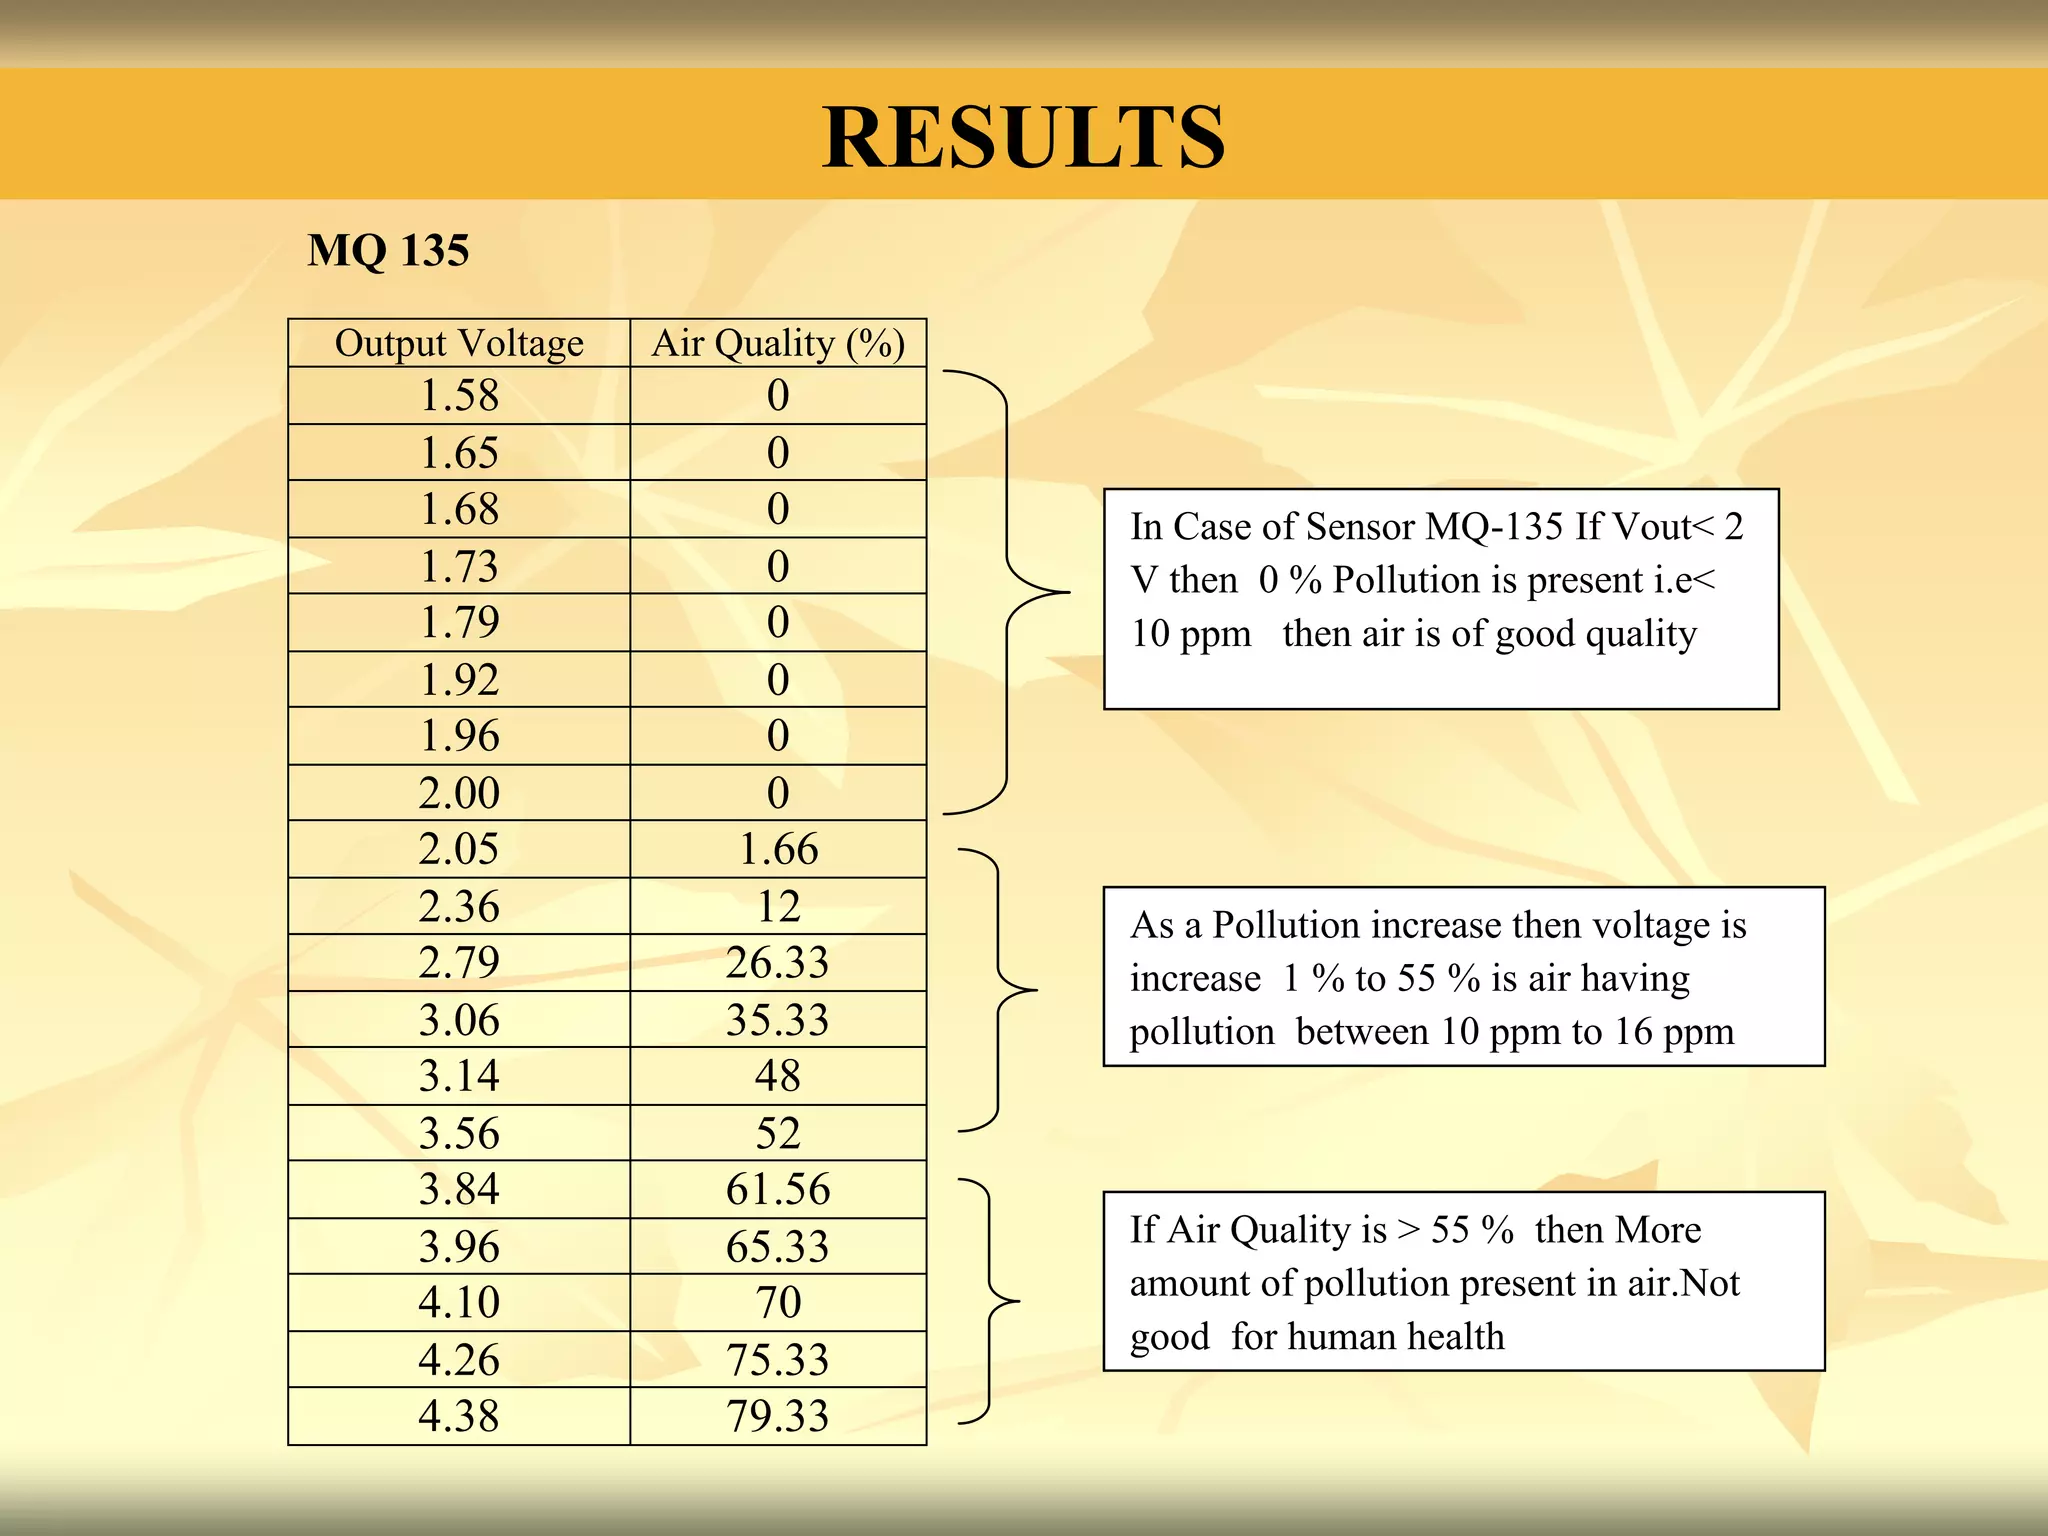
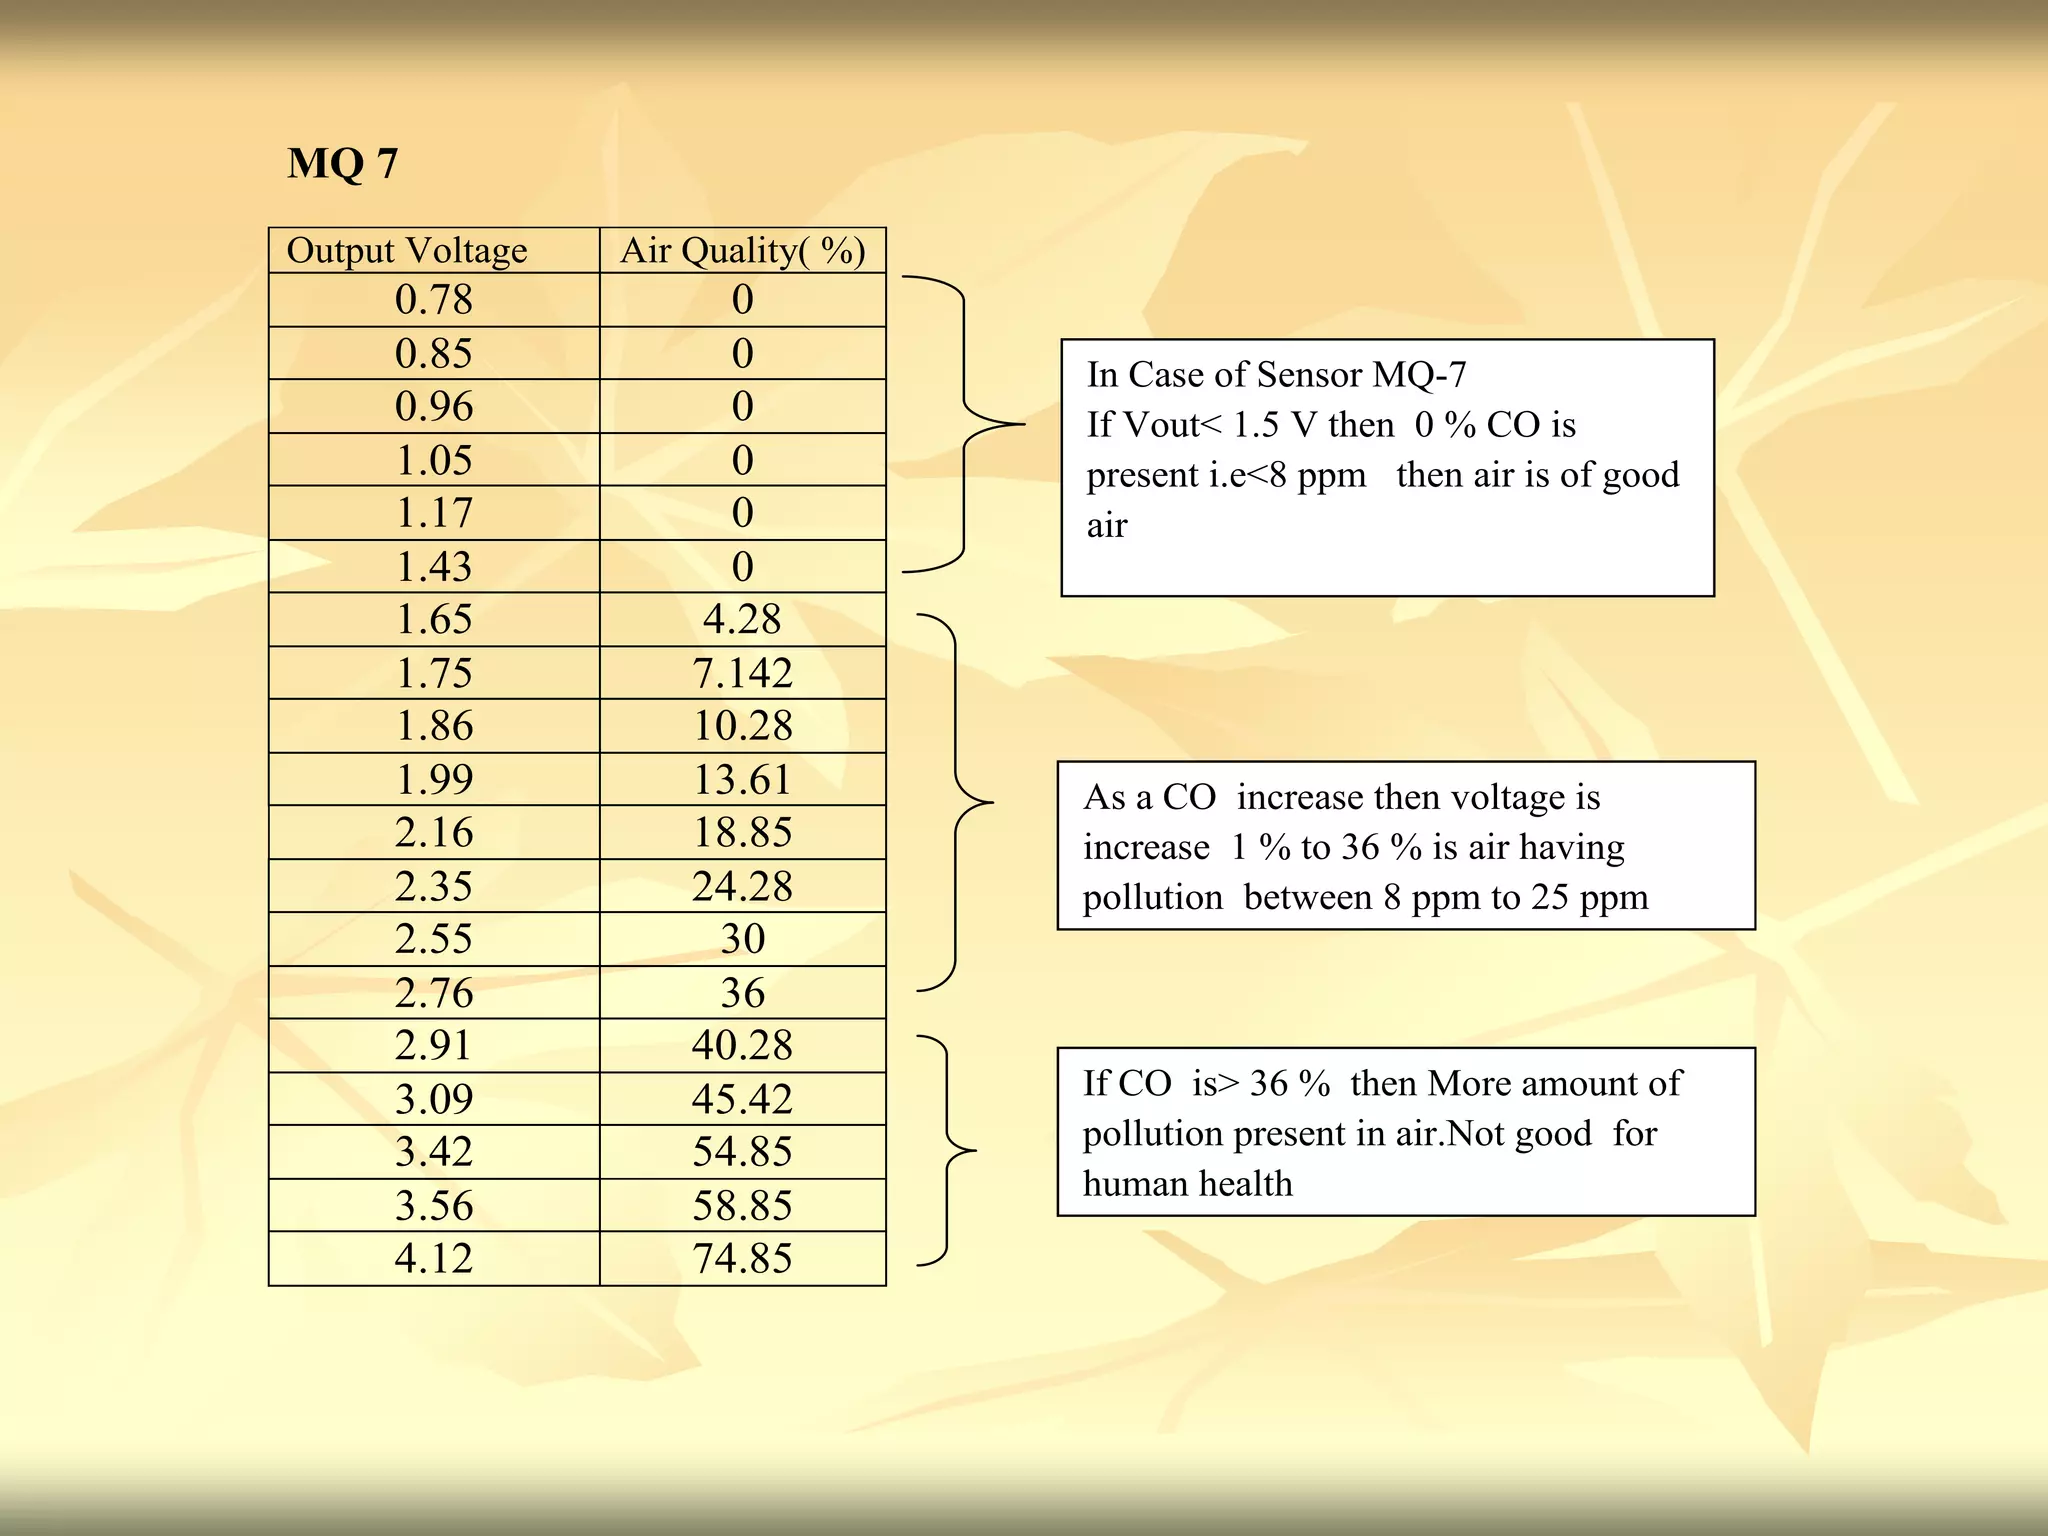
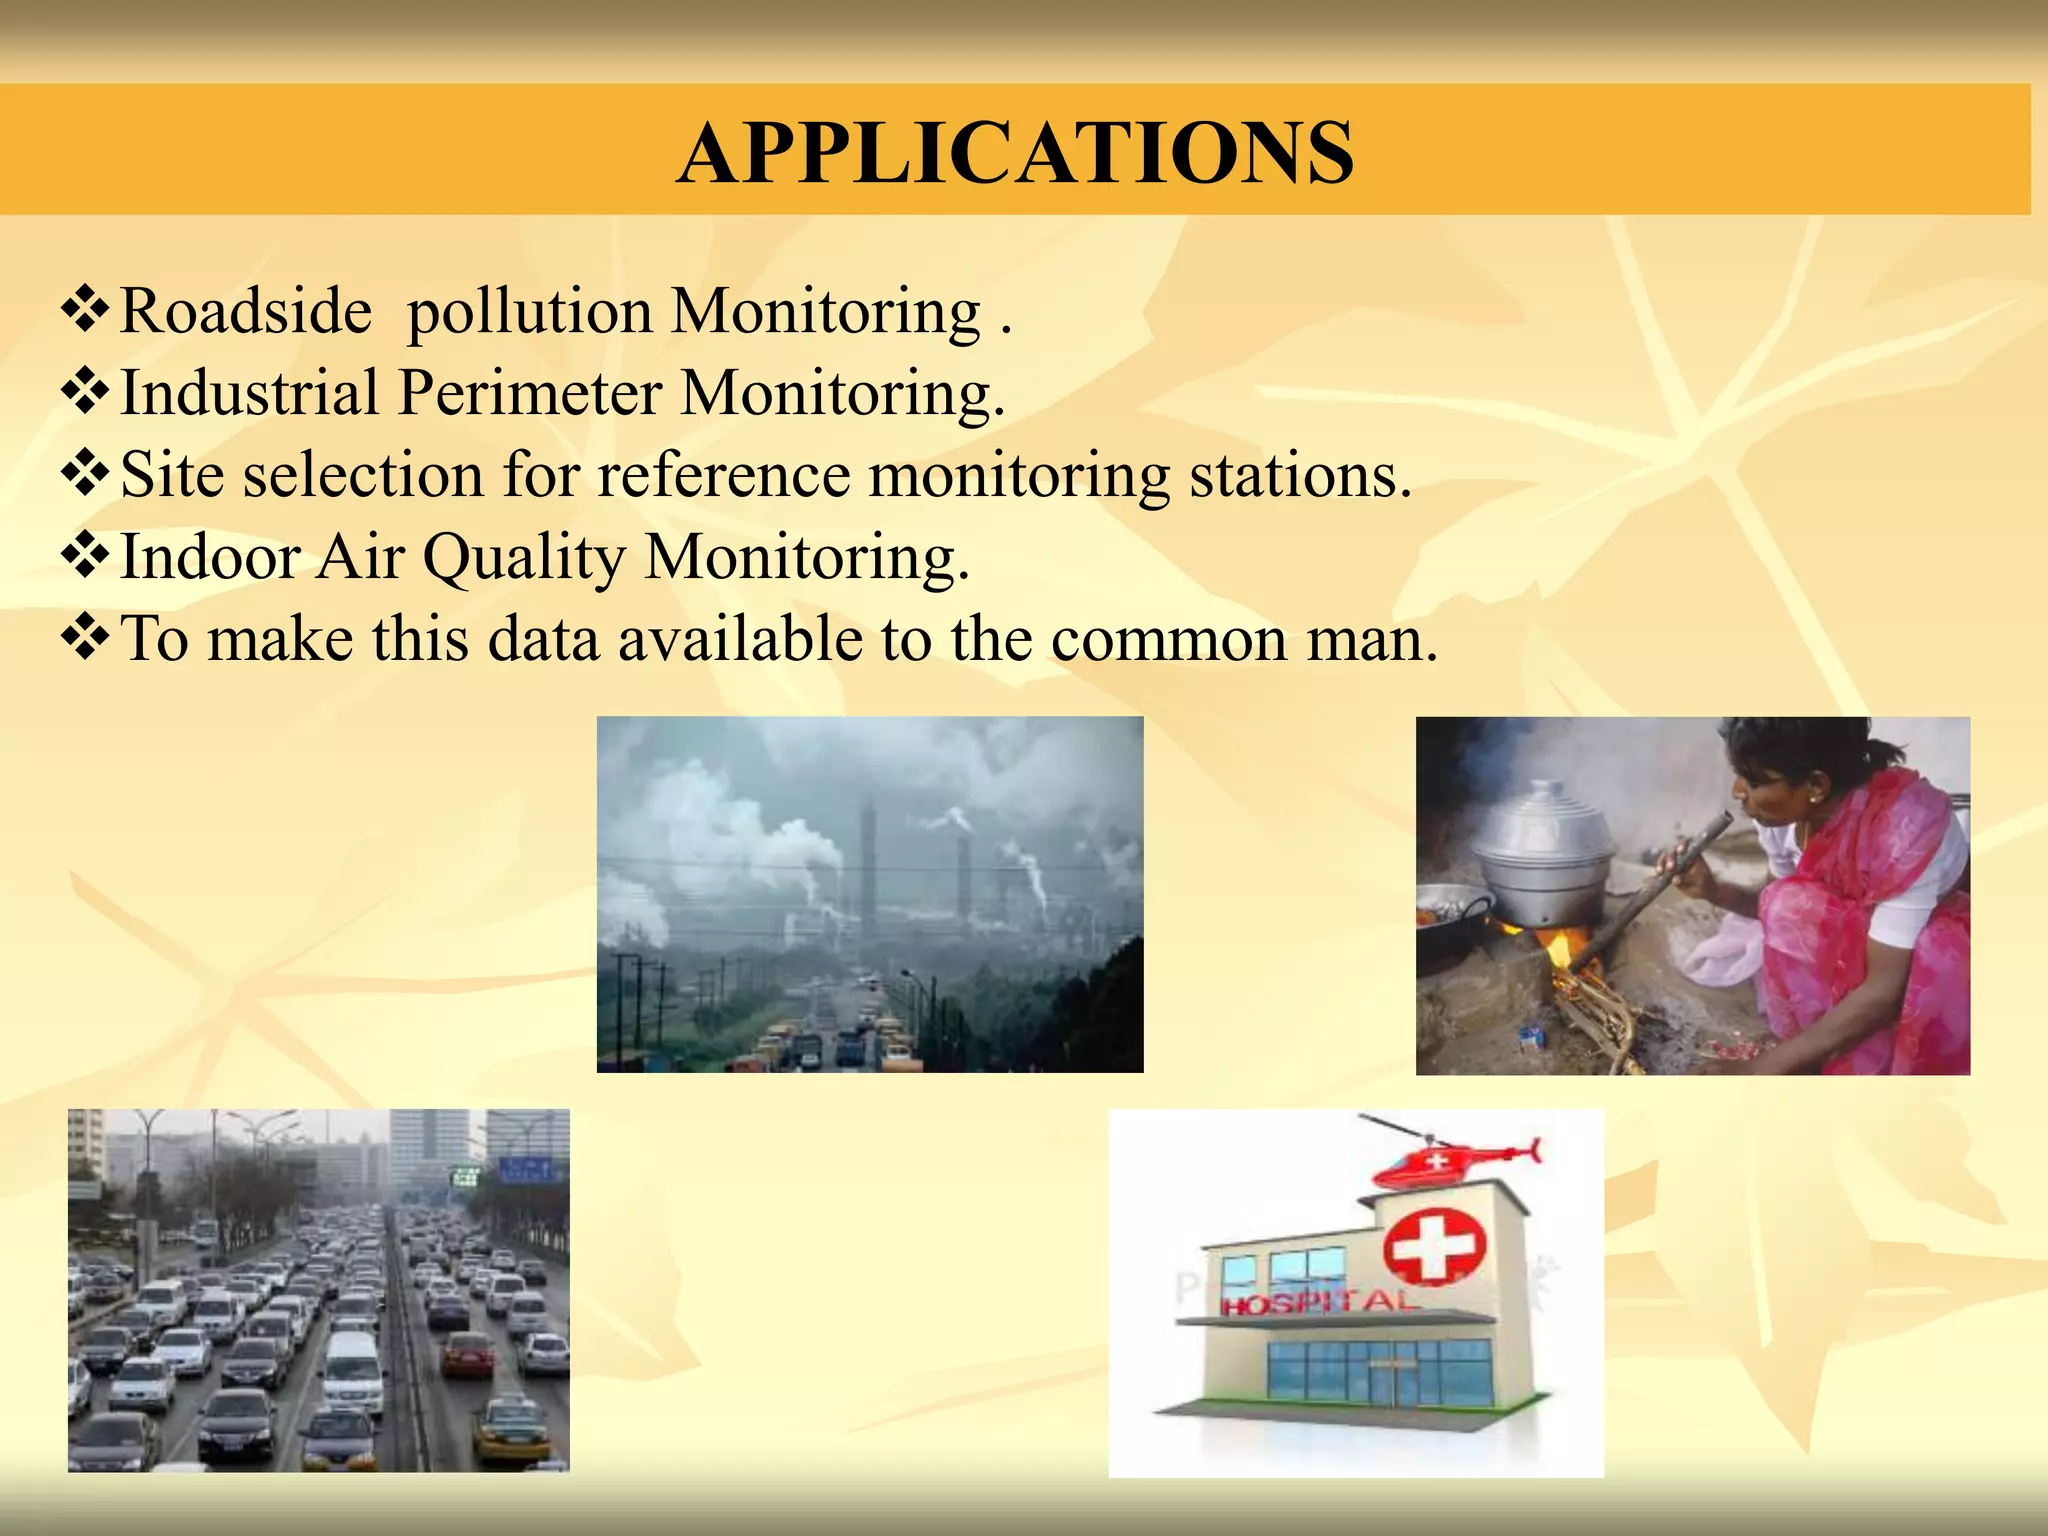
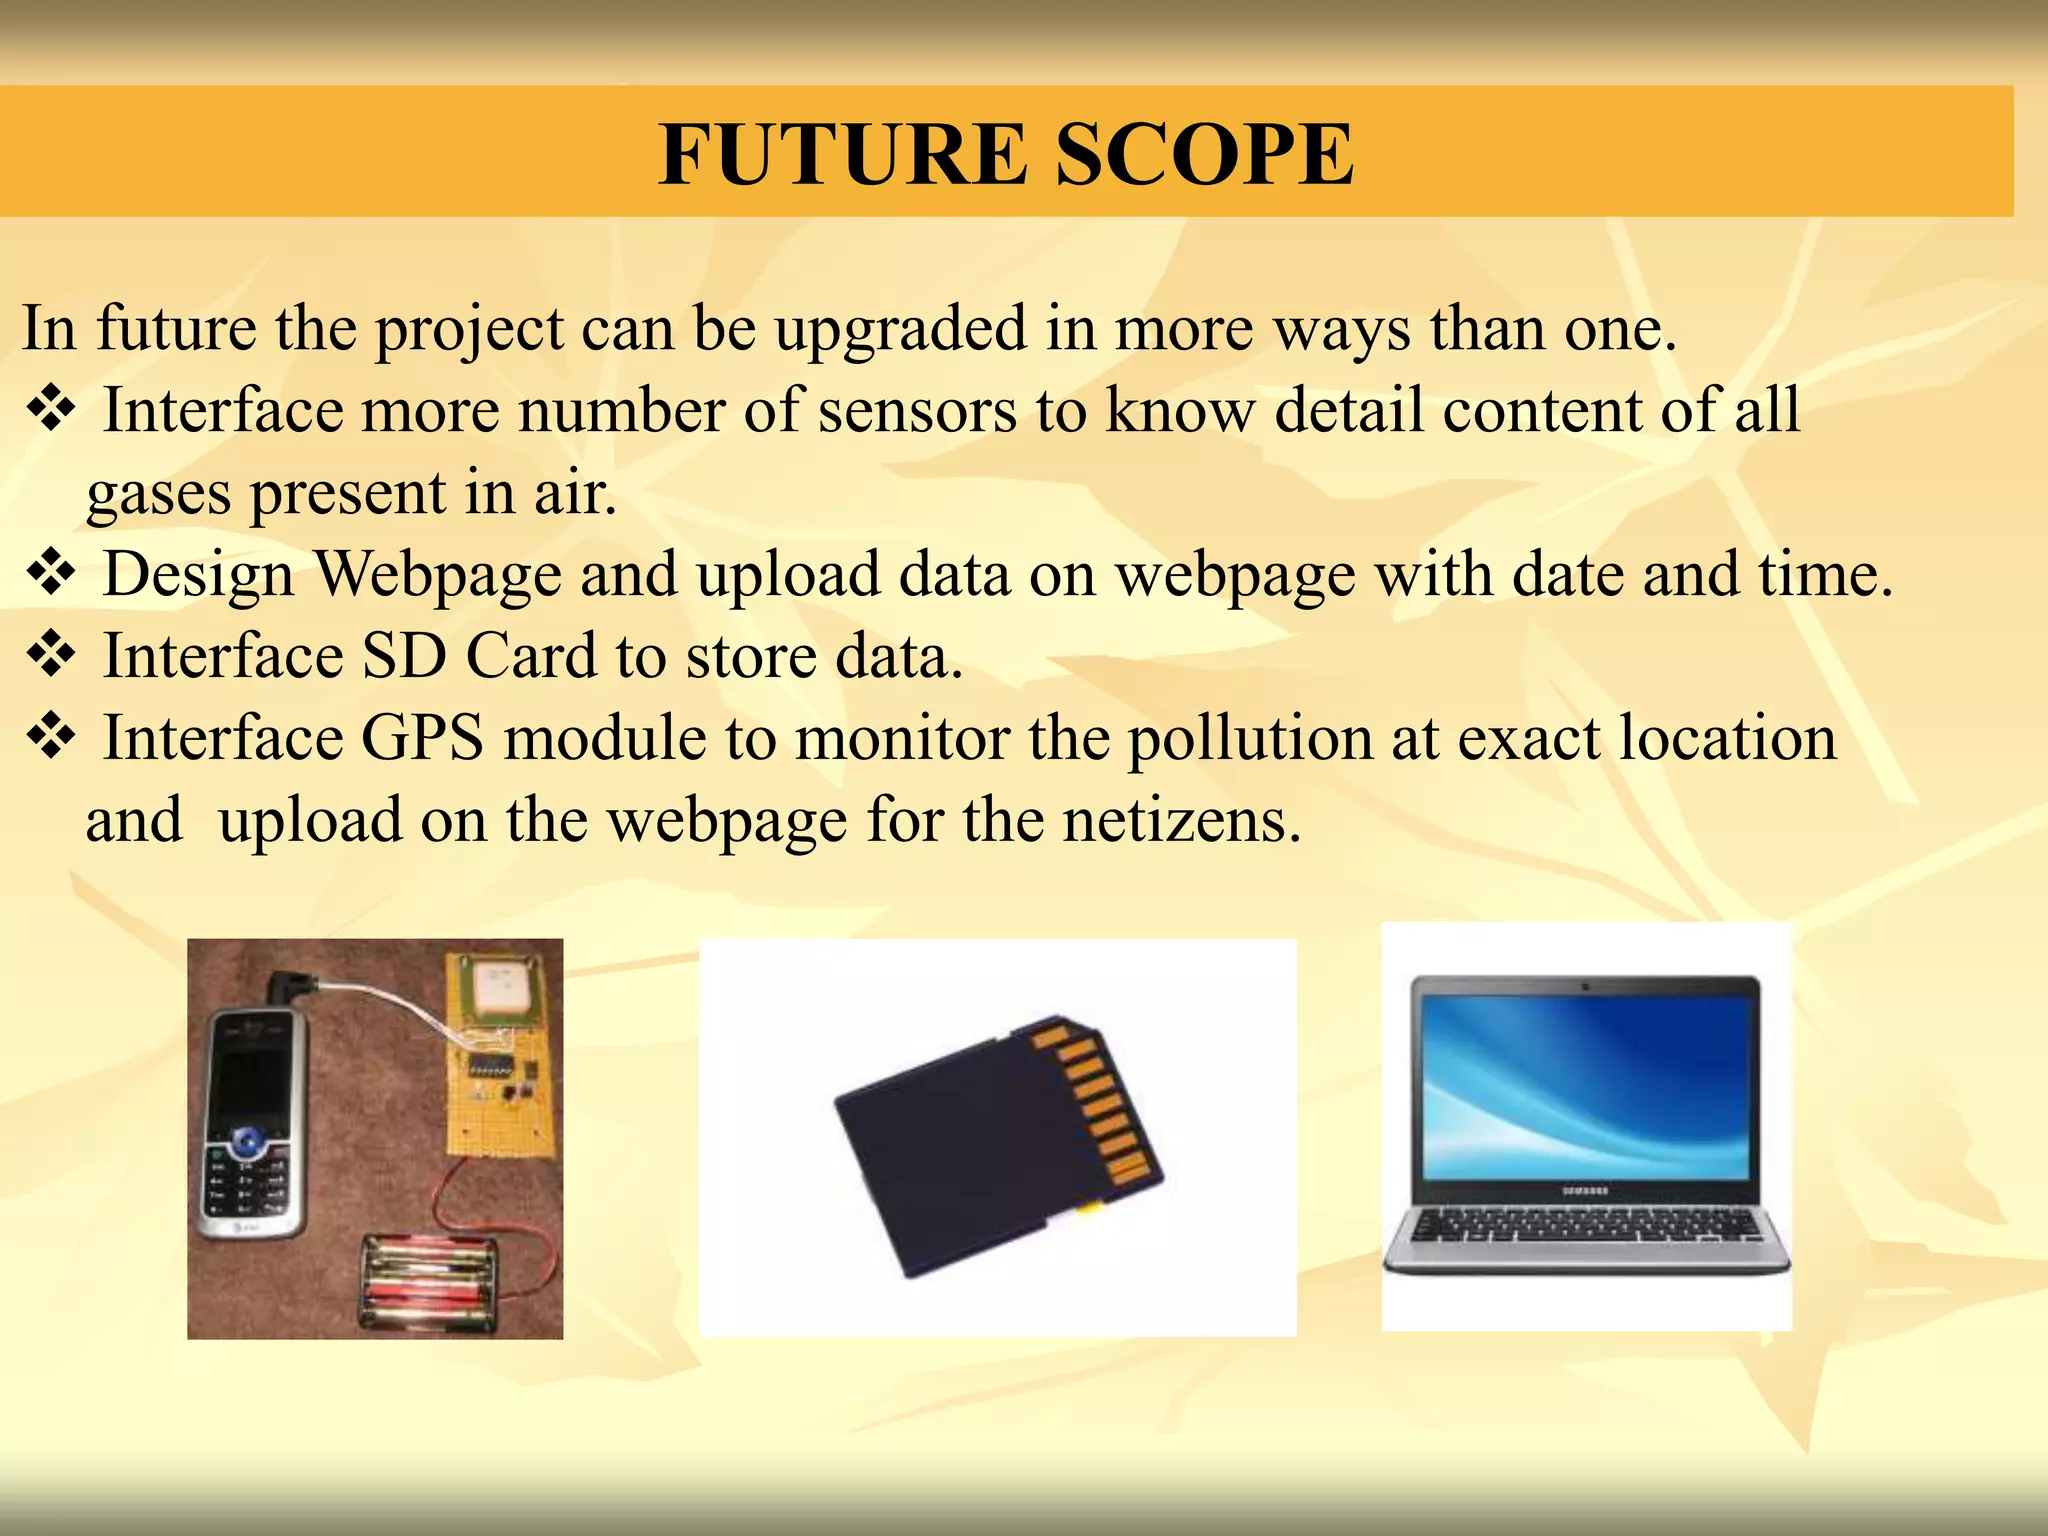


This presentation describes the design of an air quality monitoring system. The system uses sensors to detect the levels of air pollutants like carbon monoxide and air quality. It displays the sensor readings and pollutant percentages on an LCD screen. The system aims to continuously monitor indoor and outdoor air quality levels to provide data on air pollution levels. Future improvements could include adding more sensors, uploading real-time data online with location details, and storing readings on an SD card.