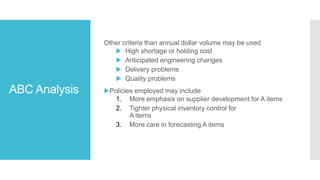
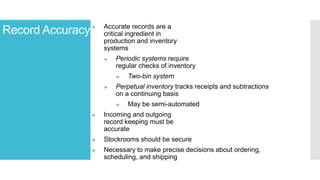
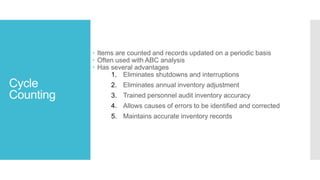
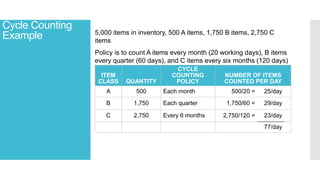
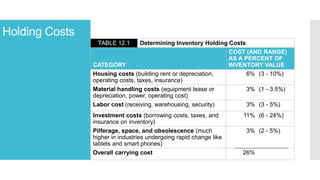
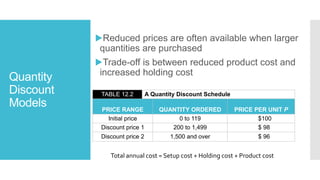
Chapter 6
Inventory Management
Inventory
Management
The objective of inventory management is to strike a balance
between inventory investment and customer service
Importance of
Inventory
▶One of the most expensive assets of many companies
representing as much as 50% of total invested capital
▶Less inventory lowers costs but increases chances of
running out
▶More inventory raises costs but always keeps customers
happy
Functions of
Inventory
1. To provide a selection of goods for anticipated demand
and to separate the firm from fluctuations in demand
2. To decouple or separate various parts of the production
process
3. To take advantage of quantity discounts
4. To hedge against inflation
Types of
Inventory
▶Raw material
▶Purchased but not processed
▶Work-in-process (WIP)
▶Undergone some change but not completed
▶A function of cycle time for a product
▶Maintenance/repair/operating (MRO)
▶Necessary to keep machinery and processes productive
▶Finished goods
▶Completed product awaiting shipment
The Material
FlowCycle
ABC Analysis
▶Divides inventory into three classes based on annual dollar
volume
▶Class A - high annual dollar volume
▶Class B - medium annual dollar volume
▶Class C - low annual dollar volume
▶Used to establish policies that focus on the few critical parts
and not the many trivial ones
ABC Analysis
A Items
B Items
| | | | | | | | | |
10 20 30 40 50 60 70 80 90 100
Percentage
of
annual
dollar
usage
80 –
70 –
60 –
50 –
40 –
30 –
20 –
10 –
0 –
Percentage of inventory items
Figure 12.2
C Items
ABC Analysis
Other criteria than annual dollar volume may be used
▶ High shortage or holding cost
▶ Anticipated engineering changes
▶ Delivery problems
▶ Quality problems
▶Policies employed may include
1. More emphasis on supplier development for A items
2. Tighter physical inventory control for
A items
3. More care in forecasting A items
Record Accuracy ► Accurate records are a
critical ingredient in
production and inventory
systems
► Periodic systems require
regular checks of inventory
► Two-bin system
► Perpetual inventory tracks receipts and subtractions
on a continuing basis
► May be semi-automated
► Incoming and outgoing
record keeping must be
accurate
► Stockrooms should be secure
► Necessary to make precise decisions about ordering,
scheduling, and shipping
Cycle
Counting
 Items are counted and records updated on a periodic basis
 Often used with ABC analysis
 Has several advantages
1. Eliminates shutdowns and interruptions
2. Eliminates annual inventory adjustment
3. Trained personnel audit inventory accuracy
4. Allows causes of errors to be identified and corrected
5. Maintains accurate inventory records
Cycle Counting
Example 5,000 items in inventory, 500 A items, 1,750 B items, 2,750 C
items
Policy is to count A items every month (20 working days), B items
every quarter (60 days), and C items every six months (120 days)
ITEM
CLASS QUANTITY
CYCLE
COUNTING
POLICY
NUMBER OF ITEMS
COUNTED PER DAY
A 500 Each month 500/20 = 25/day
B 1,750 Each quarter 1,750/60 = 29/day
C 2,750 Every 6 months 2,750/120 = 23/day
77/day
Control of
Service
Inventories
 Can be a critical component of profitability
 Losses may come from shrinkage or pilferage
 Applicable techniques include
1. Good personnel selection, training, and discipline
2. Tight control of incoming shipments
3. Effective control of all goods leaving facility
Shrinkage
Shrinkage
 Retail inventory that is unaccounted for between receipt and sale
 Retail Inventory Shrinkage
 This refers to the difference between the recorded inventory ad
actual physical inventory in a retail store.
 Causes
 Theft, damage, spoilage or administrative errors
 Measures to minimize shrinkage
 Security measures, inventory management and loss prevention
programs
Pilferage
Pilferage
Pilferage refers to the act of stealing small quantities of goods or
materials, often from an employer, organization or commercial
establishment.
 Employees, contractors or individuals with insider knowledge
may be more likely to engage in pilferage.
 Pilferage can be a pattern of repeated, small scale thefts, rather
than a single, isolated incident.
Inventory
Models
▶Independent demand - the demand for item is independent
of the demand for any other item in inventory
▶Dependent demand - the demand for item is dependent
upon the demand for some other item in the inventory
▶Holding costs - the costs of holding or “carrying”
inventory over time
▶Ordering cost - the costs of placing an order and receiving
goods
▶Setup cost - cost to prepare a machine or process for
manufacturing an order
▶May be highly correlated with setup time
Holding Costs
TABLE 12.1 Determining Inventory Holding Costs
CATEGORY
COST (AND RANGE)
AS A PERCENT OF
INVENTORY VALUE
Housing costs (building rent or depreciation,
operating costs, taxes, insurance)
6% (3 - 10%)
Material handling costs (equipment lease or
depreciation, power, operating cost)
3% (1 - 3.5%)
Labor cost (receiving, warehousing, security) 3% (3 - 5%)
Investment costs (borrowing costs, taxes, and
insurance on inventory)
11% (6 - 24%)
Pilferage, space, and obsolescence (much
higher in industries undergoing rapid change like
tablets and smart phones)
3% (2 - 5%)
Overall carrying cost 26%
Inventory
Models for
Independent
Demand
Need to determine when and how much to order
1. Basic economic order quantity (EOQ) model
2. Production order quantity model
3. Quantity discount model
Basic EOQ
Model
1. Demand is known, constant, and independent
2. Lead time is known and constant
3. Receipt of inventory is instantaneous and
complete
4. Quantity discounts are not possible
5. Only variable costs are setup (or ordering) and
holding
6. Stockouts can be completely avoided
Important Assumptions
Inventory
Usage Over
Time
Figure 12.3
Order quantity
= Q (maximum
inventory
level)
Usage rate
Average
inventory on
hand
Q
2
Minimum
inventory
Inventory
level
Time
0
Total order received
Minimizing
Costs
▶By minimizing the sum of setup (or ordering) and holding
costs, total costs are minimized
▶Optimal order size Q* will minimize total cost
▶A reduction in either cost reduces the total cost
▶Optimal order quantity occurs when holding cost and setup
cost are equal
Robust Model
▶The EOQ model is robust
▶It works even if all parameters and assumptions are not met
▶The total cost curve is relatively flat in the area of the EOQ
LeadTime
 LeadTime:
 In purchasing systems, the time between placing an order and
receiving it
 In production systems, the wait, move, queue, set up and run
times for each component produced
Re-order
Points
 The inventory level (point) at which action is take to replenish the
stocked item.
 The reorder point is given as:
 ROP= Demand per day x Lead time for a new order in days
 ROP= d x L
 The equation for ROP assumes that demand during lead time and
lead time itself are constant, otherwise extra stock should be
added.
 The ROP with safety stock then becomes
ROP=Expected demand during lead time x safety stock
Risk Pooling
 It is a strategy used in supply chain management to reduce the risk
of stock outs and overstocking by aggregating demand from
multiple locations or products.
 By pooling the risk, the overall variability in demand is reduced,
allowing for better forecasting and inventory management.
Types of Risk
Pooling
 Location Pooling
Aggregating demand from multiple locations to reduce the
variability in demand
 Product Pooling
 Aggregating demand from multiple products to reduce the
variability in demand
Risk Pooling:
Examples
Amazon's Fulfillment by Amazon (FBA) program:
Amazon pools the inventory of multiple sellers in its warehouses,
reducing the risk of stockouts and overstocking
Walmart's Distribution Centers:
Walmart aggregates the demand from multiple stores and pools the
inventory in its distribution centers, reducing the risk of stockouts and
overstocking
Dell's Build-to-Order Production:
Dell pools the demand from multiple customers and produces
computers to order, reducing the risk of overstocking and inventory
obsolescence.
Extra
Stock/Safety
Stock
Extra Stock/Safety Stock
Extra Stock to allow for uneven demand: A buffer
 It refers to the additional inventory that a company keeps in hand
to mitigate the risk of stock outs in supply chain.
Purpose of
SafetyStock
 The main purpose of safety stock are:
 Demand Uncertainty: To account for fluctuations in customer
demand that may be higher than forecasted.
 LeadTimeVariability: To buffer against delays in the supply of
raw materials, components or finished gods from suppliers.
 Unexpected Events: To provide a buffer against unforeseen
events like natural disasters, labor strikes or equipment
breakdowns that could disrupt the normal flow of inventory
Production
OrderQuantity
Model
1. Used when inventory builds up over a period of time after an
order is placed
2. Used when units are produced and sold simultaneously
Figure 12.6
Quantity
Discount
Models
▶Reduced prices are often available when larger
quantities are purchased
▶Trade-off is between reduced product cost and
increased holding cost
TABLE 12.2 A Quantity Discount Schedule
PRICE RANGE QUANTITY ORDERED PRICE PER UNIT P
Initial price 0 to 119 $100
Discount price 1 200 to 1,499 $ 98
Discount price 2 1,500 and over $ 96
Total annual cost = Setup cost + Holding cost + Product cost
Inventory
Metrics
 Inventory metrics are used to measure and evaluate the
efficiency and effectiveness of inventory management.
Inventory
Metrics
Inventory metrics include:
 1. InventoryTurnover: The number of times inventory is sold and
replaced within a given period.
 2. Inventory Days Supply: The number of days it would take to
sell through the current inventory
 .3. Fill Rate: The percentage of customer orders that are fulfilled
from existing inventory.
 4. Stockout Rate: The percentage of customer orders that cannot
be fulfilled due to inventory unavailability.
 5. Overstock Rate: The percentage of inventory that is excess or
surplus
Inventory
Metrics
6. Inventory Accuracy: The percentage of inventory records that
match actual physical inventory.
7. LeadTime: The time it takes to replenish inventory.
8. Inventory Carrying Cost: The cost of holding and storing
inventory, including storage, handling, and maintenance costs
9. Inventory Shrinkage: The loss of inventory due to theft, damage,
or administrative errors.
10. Gross Margin Return on Investment (GMROI): A measure of
the profitability of inventory, calculated by dividing gross margin by
the average inventory investment.
These metrics help businesses optimize their inventory levels,
reduce waste and excess, and improve customer satisfaction.

Chapter 6-Inventory Management ..........

  • 1.
  • 2.
    Inventory Management The objective ofinventory management is to strike a balance between inventory investment and customer service
  • 3.
    Importance of Inventory ▶One ofthe most expensive assets of many companies representing as much as 50% of total invested capital ▶Less inventory lowers costs but increases chances of running out ▶More inventory raises costs but always keeps customers happy
  • 4.
    Functions of Inventory 1. Toprovide a selection of goods for anticipated demand and to separate the firm from fluctuations in demand 2. To decouple or separate various parts of the production process 3. To take advantage of quantity discounts 4. To hedge against inflation
  • 5.
    Types of Inventory ▶Raw material ▶Purchasedbut not processed ▶Work-in-process (WIP) ▶Undergone some change but not completed ▶A function of cycle time for a product ▶Maintenance/repair/operating (MRO) ▶Necessary to keep machinery and processes productive ▶Finished goods ▶Completed product awaiting shipment
  • 6.
  • 7.
    ABC Analysis ▶Divides inventoryinto three classes based on annual dollar volume ▶Class A - high annual dollar volume ▶Class B - medium annual dollar volume ▶Class C - low annual dollar volume ▶Used to establish policies that focus on the few critical parts and not the many trivial ones
  • 8.
    ABC Analysis A Items BItems | | | | | | | | | | 10 20 30 40 50 60 70 80 90 100 Percentage of annual dollar usage 80 – 70 – 60 – 50 – 40 – 30 – 20 – 10 – 0 – Percentage of inventory items Figure 12.2 C Items
  • 9.
    ABC Analysis Other criteriathan annual dollar volume may be used ▶ High shortage or holding cost ▶ Anticipated engineering changes ▶ Delivery problems ▶ Quality problems ▶Policies employed may include 1. More emphasis on supplier development for A items 2. Tighter physical inventory control for A items 3. More care in forecasting A items
  • 10.
    Record Accuracy ►Accurate records are a critical ingredient in production and inventory systems ► Periodic systems require regular checks of inventory ► Two-bin system ► Perpetual inventory tracks receipts and subtractions on a continuing basis ► May be semi-automated ► Incoming and outgoing record keeping must be accurate ► Stockrooms should be secure ► Necessary to make precise decisions about ordering, scheduling, and shipping
  • 11.
    Cycle Counting  Items arecounted and records updated on a periodic basis  Often used with ABC analysis  Has several advantages 1. Eliminates shutdowns and interruptions 2. Eliminates annual inventory adjustment 3. Trained personnel audit inventory accuracy 4. Allows causes of errors to be identified and corrected 5. Maintains accurate inventory records
  • 12.
    Cycle Counting Example 5,000items in inventory, 500 A items, 1,750 B items, 2,750 C items Policy is to count A items every month (20 working days), B items every quarter (60 days), and C items every six months (120 days) ITEM CLASS QUANTITY CYCLE COUNTING POLICY NUMBER OF ITEMS COUNTED PER DAY A 500 Each month 500/20 = 25/day B 1,750 Each quarter 1,750/60 = 29/day C 2,750 Every 6 months 2,750/120 = 23/day 77/day
  • 13.
    Control of Service Inventories  Canbe a critical component of profitability  Losses may come from shrinkage or pilferage  Applicable techniques include 1. Good personnel selection, training, and discipline 2. Tight control of incoming shipments 3. Effective control of all goods leaving facility
  • 14.
    Shrinkage Shrinkage  Retail inventorythat is unaccounted for between receipt and sale  Retail Inventory Shrinkage  This refers to the difference between the recorded inventory ad actual physical inventory in a retail store.  Causes  Theft, damage, spoilage or administrative errors  Measures to minimize shrinkage  Security measures, inventory management and loss prevention programs
  • 15.
    Pilferage Pilferage Pilferage refers tothe act of stealing small quantities of goods or materials, often from an employer, organization or commercial establishment.  Employees, contractors or individuals with insider knowledge may be more likely to engage in pilferage.  Pilferage can be a pattern of repeated, small scale thefts, rather than a single, isolated incident.
  • 16.
    Inventory Models ▶Independent demand -the demand for item is independent of the demand for any other item in inventory ▶Dependent demand - the demand for item is dependent upon the demand for some other item in the inventory ▶Holding costs - the costs of holding or “carrying” inventory over time ▶Ordering cost - the costs of placing an order and receiving goods ▶Setup cost - cost to prepare a machine or process for manufacturing an order ▶May be highly correlated with setup time
  • 17.
    Holding Costs TABLE 12.1Determining Inventory Holding Costs CATEGORY COST (AND RANGE) AS A PERCENT OF INVENTORY VALUE Housing costs (building rent or depreciation, operating costs, taxes, insurance) 6% (3 - 10%) Material handling costs (equipment lease or depreciation, power, operating cost) 3% (1 - 3.5%) Labor cost (receiving, warehousing, security) 3% (3 - 5%) Investment costs (borrowing costs, taxes, and insurance on inventory) 11% (6 - 24%) Pilferage, space, and obsolescence (much higher in industries undergoing rapid change like tablets and smart phones) 3% (2 - 5%) Overall carrying cost 26%
  • 19.
    Inventory Models for Independent Demand Need todetermine when and how much to order 1. Basic economic order quantity (EOQ) model 2. Production order quantity model 3. Quantity discount model
  • 20.
    Basic EOQ Model 1. Demandis known, constant, and independent 2. Lead time is known and constant 3. Receipt of inventory is instantaneous and complete 4. Quantity discounts are not possible 5. Only variable costs are setup (or ordering) and holding 6. Stockouts can be completely avoided Important Assumptions
  • 21.
    Inventory Usage Over Time Figure 12.3 Orderquantity = Q (maximum inventory level) Usage rate Average inventory on hand Q 2 Minimum inventory Inventory level Time 0 Total order received
  • 22.
    Minimizing Costs ▶By minimizing thesum of setup (or ordering) and holding costs, total costs are minimized ▶Optimal order size Q* will minimize total cost ▶A reduction in either cost reduces the total cost ▶Optimal order quantity occurs when holding cost and setup cost are equal
  • 23.
    Robust Model ▶The EOQmodel is robust ▶It works even if all parameters and assumptions are not met ▶The total cost curve is relatively flat in the area of the EOQ
  • 24.
    LeadTime  LeadTime:  Inpurchasing systems, the time between placing an order and receiving it  In production systems, the wait, move, queue, set up and run times for each component produced
  • 25.
    Re-order Points  The inventorylevel (point) at which action is take to replenish the stocked item.  The reorder point is given as:  ROP= Demand per day x Lead time for a new order in days  ROP= d x L  The equation for ROP assumes that demand during lead time and lead time itself are constant, otherwise extra stock should be added.  The ROP with safety stock then becomes ROP=Expected demand during lead time x safety stock
  • 26.
    Risk Pooling  Itis a strategy used in supply chain management to reduce the risk of stock outs and overstocking by aggregating demand from multiple locations or products.  By pooling the risk, the overall variability in demand is reduced, allowing for better forecasting and inventory management.
  • 27.
    Types of Risk Pooling Location Pooling Aggregating demand from multiple locations to reduce the variability in demand  Product Pooling  Aggregating demand from multiple products to reduce the variability in demand
  • 28.
    Risk Pooling: Examples Amazon's Fulfillmentby Amazon (FBA) program: Amazon pools the inventory of multiple sellers in its warehouses, reducing the risk of stockouts and overstocking Walmart's Distribution Centers: Walmart aggregates the demand from multiple stores and pools the inventory in its distribution centers, reducing the risk of stockouts and overstocking Dell's Build-to-Order Production: Dell pools the demand from multiple customers and produces computers to order, reducing the risk of overstocking and inventory obsolescence.
  • 29.
    Extra Stock/Safety Stock Extra Stock/Safety Stock ExtraStock to allow for uneven demand: A buffer  It refers to the additional inventory that a company keeps in hand to mitigate the risk of stock outs in supply chain.
  • 30.
    Purpose of SafetyStock  Themain purpose of safety stock are:  Demand Uncertainty: To account for fluctuations in customer demand that may be higher than forecasted.  LeadTimeVariability: To buffer against delays in the supply of raw materials, components or finished gods from suppliers.  Unexpected Events: To provide a buffer against unforeseen events like natural disasters, labor strikes or equipment breakdowns that could disrupt the normal flow of inventory
  • 31.
    Production OrderQuantity Model 1. Used wheninventory builds up over a period of time after an order is placed 2. Used when units are produced and sold simultaneously Figure 12.6
  • 32.
    Quantity Discount Models ▶Reduced prices areoften available when larger quantities are purchased ▶Trade-off is between reduced product cost and increased holding cost TABLE 12.2 A Quantity Discount Schedule PRICE RANGE QUANTITY ORDERED PRICE PER UNIT P Initial price 0 to 119 $100 Discount price 1 200 to 1,499 $ 98 Discount price 2 1,500 and over $ 96 Total annual cost = Setup cost + Holding cost + Product cost
  • 33.
    Inventory Metrics  Inventory metricsare used to measure and evaluate the efficiency and effectiveness of inventory management.
  • 34.
    Inventory Metrics Inventory metrics include: 1. InventoryTurnover: The number of times inventory is sold and replaced within a given period.  2. Inventory Days Supply: The number of days it would take to sell through the current inventory  .3. Fill Rate: The percentage of customer orders that are fulfilled from existing inventory.  4. Stockout Rate: The percentage of customer orders that cannot be fulfilled due to inventory unavailability.  5. Overstock Rate: The percentage of inventory that is excess or surplus
  • 35.
    Inventory Metrics 6. Inventory Accuracy:The percentage of inventory records that match actual physical inventory. 7. LeadTime: The time it takes to replenish inventory. 8. Inventory Carrying Cost: The cost of holding and storing inventory, including storage, handling, and maintenance costs 9. Inventory Shrinkage: The loss of inventory due to theft, damage, or administrative errors. 10. Gross Margin Return on Investment (GMROI): A measure of the profitability of inventory, calculated by dividing gross margin by the average inventory investment. These metrics help businesses optimize their inventory levels, reduce waste and excess, and improve customer satisfaction.