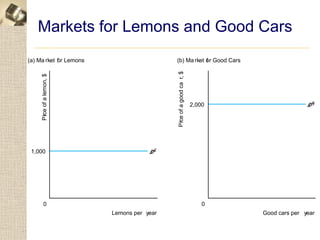
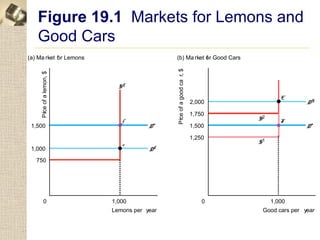
The document discusses asymmetric information in markets and how it can lead to inefficient outcomes. It provides examples of "lemons markets" where buyers cannot distinguish high-quality from low-quality goods. This can cause high-quality goods to be driven from the market if sellers cannot signal quality. The document also discusses how limited price information for consumers can give firms market power to charge above competitive prices, similar to a tourist trap model. Overall it analyzes how asymmetric information between buyers and sellers can disrupt efficient market outcomes.
This document discusses the relationship between risk and return in investments. It defines total risk as the sum of systematic and unsystematic risk. Systematic risk stems from external market factors that affect all investments, while unsystematic risk is specific to a particular company. The expected return and risk of individual stocks varies, with higher risk investments generally offering higher returns. A portfolio combines multiple assets to reduce overall risk through diversification. The portfolio risk depends on the covariance and correlation between the individual assets' returns. Diversifying across assets with low correlation is an effective way to reduce risk.
Akerlof's market for lemons theory describes how asymmetric information between buyers and sellers in a market can cause market failure. When buyers cannot reliably assess the quality of goods for sale, they will assume the average quality is lower and be unwilling to pay high prices. This forces sellers to lower prices which then incentivizes them to lower quality further. The market may reach a point where only low quality "lemons" remain for sale, even though buyers would pay more for higher quality goods if quality could be verified.
- Market forces of supply and demand determine an equilibrium price where the two curves intersect. At this price, the market is in a balanced state.
- Changes in non-price factors can shift the supply or demand curves, disrupting the equilibrium. However, market forces will bring supply and demand back into balance at a new equilibrium price.
- The interaction of supply, demand, and price is a fundamental concept for investors and traders to understand, as it underlies identifying profitable trades and investments. Price movements reflect changes in supply and demand.
Investment management chapter 5 the arbitrage pricing theoryHeng Leangpheng
The document discusses factor risk models and the arbitrage pricing theory (APT). It provides examples of the single index model (SIM) and multiple index model (MIM), showing how an asset's expected return is determined by systematic factors like inflation, GDP growth, and exchange rates, as well as an asset-specific error term. The APT states that in efficient markets with no arbitrage opportunities, the expected return is linearly related to factor sensitivities or betas. Tests provide some support that risk factors beyond the market affect returns as the APT predicts.
Investment strategies of famous investment gurusHarish Manchala
This document summarizes the investment strategies of several famous investors including Benjamin Graham, Peter Lynch, Warren Buffett, David Dreman, John Neff, Kenneth Fisher, Martin Zweig, Joel Greenblatt, Joseph Piotroski, and James O'Shaughnessy. It describes the key aspects of each of their strategies such as focusing on value, price/earnings ratios, earnings growth rates, contrarian approaches, and blending growth and value styles.
1) Options have intrinsic value, which is the difference between the stock price and exercise price if in the money, and time value, which is any additional premium above intrinsic value.
2) Key variables that affect option pricing are the stock price, exercise price, time to expiration, volatility, interest rates, and dividends. Higher stock prices and volatility increase call values while lowering put values.
3) Put-call parity states that the call price plus the present value of the strike price must equal the put price plus the stock price.
Derivative is a financial instrument that derives its value from the value of some underlying asset. When the prices of commodities, currencies, securities, and interest rate are not fixed and keep on fluctuating, it becomes very necessary to hedge. Copy the link given below and paste it in new browser window to get more information on Derivatives and Hedging:- http://www.transtutors.com/homework-help/finance/derivaties-and-hedging.aspx
This document provides an overview of portfolio theory and asset pricing models. It discusses key concepts such as the factors that affect stock prices like cash flows, risk, and timing. It also covers the weighted average cost of capital (WACC) and how it is used to calculate intrinsic value. Other topics include the capital market line, security market line, beta estimation through regression analysis, and tests of the capital asset pricing model (CAPM). The document provides examples of how to calculate portfolio expected returns, standard deviations, and betas. It also discusses the relationship between total, market, and diversifiable risk.
The document discusses the Capital Asset Pricing Model (CAPM). It defines systematic and unsystematic risk, the beta coefficient as a measure of systematic risk, and outlines the key assumptions and formula of CAPM. The Security Market Line (SML) graphs the relationship between risk and return predicted by CAPM. Some limitations of CAPM are that it assumes variance captures all risk and homogeneous investor expectations. Alternatives to CAPM discussed include Consumption CAPM, Intertemporal CAPM, and Arbitrage Pricing Theory.
1. The document discusses the IS-LM model and how it can be used to analyze the effects of fiscal and monetary policy. It presents the IS and LM curves and how they represent equilibrium in the goods and money markets.
2. Fiscal policy like increases in government spending can shift the IS curve right, raising output and interest rates. Monetary policy like increases in the money supply can shift the LM curve down, lowering interest rates and raising output.
3. Shocks to aggregate demand are analyzed using the IS-LM model, and the model can also show the transition from short-run to long-run equilibrium when prices adjust over time.
- Dokumen tersebut membahas manajemen piutang dagang dan persediaan
- Pembahasan mencakup faktor yang mempengaruhi piutang dan persediaan, kebijakan piutang, pengendalian piutang, serta penentuan saldo persediaan optimal menggunakan model EOQ
- Secara khusus dibahas mengenai pengertian, manfaat, dan biaya dari piutang dan persediaan bagi perusahaan
Risk Return Trade Off PowerPoint Presentation SlidesSlideTeam
Presenting this set of slides with name - Risk Return Trade Off Powerpoint Presentation Slides. This deck consists of total of twenty nine slides. It has PPT slides highlighting important topics of Risk Return Trade Off Powerpoint Presentation Slides. This deck comprises of amazing visuals with thoroughly researched content. Each template is well crafted and designed by our PowerPoint experts. Our designers have included all the necessary PowerPoint layouts in this deck. From icons to graphs, this PPT deck has it all. The best part is that these templates are easily customizable. Just click the DOWNLOAD button shown below. Edit the colour, text, font size, add or delete the content as per the requirement. Download this deck now and engage your audience with this ready made presentation.
This document discusses the concepts of asymmetric information, uncertainty, and auctions. It begins by defining asymmetric information as situations where one party has more or better information than the other party in a transaction. Examples given include hidden actions by workers that employers cannot observe, and hidden qualities of used goods like cars that buyers are unaware of. The document then explores the economic issues of moral hazard and adverse selection that can result from asymmetric information. It provides examples of signaling and screening methods that parties may use to help resolve information asymmetries.
Gains from trade: Consumer and Producer SurplusAndrew Tibbitt
This document discusses the gains from international trade using consumer and producer surplus models. It explains that static gains from trade occur as countries are able to use their resources more efficiently. When a country exports a good, producers gain from selling at a higher world price while consumers may lose from paying higher domestic prices. However, the overall community surplus increases. When a country imports a good, consumers gain from lower prices while domestic producers may lose sales. But again, the overall community surplus rises due to cheaper imports. Trade allows both exporting and importing countries to experience net benefits overall.
Dokumen tersebut membahas tentang pengertian kurs dan valuta asing, faktor yang mempengaruhinya, sistem nilai tukar valuta asing, dan contoh perhitungan nilai tukar.
The document discusses various metrics for measuring intra-industry trade, including the Grubel-Lloyd index. It provides examples of intra-industry trade between the Philippines and Japan in 1998 across various industries. It also examines the intra-industry trade index values of different countries from 1988-2000 and explores explanations for intra-industry trade such as economies of scale and variety in demand.
The Fama-French model predicts a lower required return for this stock compared to the CAPM. This is because the Fama-French model accounts for additional factors beyond just market risk.
The document discusses LIBOR (London Interbank Offered Rate), which is the average interest rate that leading banks in London charge when lending to other banks. It provides background information on LIBOR, including that it was established in 1986, has 15 maturity periods ranging from overnight to 12 months, and rates for 10 major currencies. The document then discusses how LIBOR manipulation by banks like Barclays impacted global financial markets and consumers through its effect on loans, mortgages, savings, and derivatives.
The document summarizes key concepts from the standard trade model, including:
1) Economic growth is usually "biased" toward certain sectors, changing relative supply and terms of trade. Export-biased growth reduces a country's terms of trade while import-biased growth increases them.
2) International transfers of income, such as foreign aid, can affect relative demand curves and terms of trade in complex ways depending on countries' spending behaviors.
3) While the model predicts that import-biased growth in countries like China should reduce U.S. welfare, data shows terms of trade impacts have been both positive and negative for developing and high-income countries.
The document provides an overview of key concepts related to expected returns, risk, and the security market line. It defines expected returns and how they differ from realized returns. It also discusses diversification and how it relates to systematic and unsystematic risk. The security market line models the relationship between risk and return, with the slope representing the market risk premium. The capital asset pricing model uses an asset's beta to determine its expected return based on the risk-free rate and market risk premium.
The document provides information about the foreign exchange market (FOREX). It explains that currencies are traded between countries and factors like preferences, quality, prices, incomes, and interest rates can impact currency exchange rates. The FOREX is represented worldwide and currencies are subjected to supply and demand. When factors change, it can cause one currency to appreciate or depreciate relative to another currency, impacting exports and imports between the two countries.
This document summarizes critiques of the Capital Asset Pricing Model (CAPM) and presents alternative models. It discusses empirical studies from the 1980s and 1990s that found variables other than beta help explain stock returns, contradicting CAPM. Fama and French's 1992 study found firm size and book-to-market ratio better predict returns than beta. Their three-factor model and the Arbitrage Pricing Theory were proposed as alternatives to CAPM. Overall, the document outlines major empirical challenges to CAPM and influential models that improved on its ability to explain stock returns.
The document discusses the Fisher effect, which states that the real interest rate equals the nominal interest rate minus the expected inflation rate. It provides examples of how nominal interest rates on savings accounts incorporate expected inflation. The document also defines nominal interest rates as actual rates provided by lenders and real interest rates as rates adjusted for purchasing power. Finally, it discusses how the Fisher effect shows that changes in the money supply will affect nominal interest rates and inflation in tandem, without impacting real interest rates.
Presentation by John Corkery (University of Hertfordshire, UK) on the occasion of the EESC hearing on New Psychoactive Substances (Brussels, 27 November 2013)
Counterfeiting has negative moral, social, and economic impacts. It harms legitimate producers who lose sales and brand reputation when fake versions of their goods are sold. Workers for both legitimate and counterfeiting operations are negatively impacted, with the latter being underpaid and the former losing jobs. Consumers are at risk when counterfeit goods like drugs, vehicles, or aircraft parts are dangerous. Governments lose tax revenue and can face economic slowdowns due to the effects of widespread counterfeiting on world trade. Famous cases like Frank Abagnale Jr. also show how identity theft through counterfeiting documents can successfully deceive many for long periods.
Adverse selection and moral hazard affect insurance markets. Adverse selection occurs when high-risk individuals are more likely to purchase insurance, leaving insurers with a riskier, costlier pool of policyholders. Moral hazard arises when insurance reduces incentives for careful behavior, raising costs. To address these issues, insurers offer different coverage options. High deductible plans with lower premiums alleviate moral hazard by requiring more out-of-pocket costs. A menu of prices also helps insurers distinguish between low and high-risk individuals, reducing adverse selection.
This chapter discusses moral hazard and adverse selection in insurance markets. Moral hazard refers to how insurance can change policyholders' behavior by reducing their incentives to prevent or minimize losses. Adverse selection refers to how asymmetric information between insurers and policyholders regarding risk levels can result in high-risk individuals being more likely to purchase insurance. The chapter examines how insurers can design contracts to mitigate these issues and provide appropriate incentives to policyholders.
Adverse selection and moral hazard in the finance and supply of health careThe Economics Network
From a course by Fiona Carmichael of Birmingham Business School, University of Birmingham. The course puts economics concepts in context for Business Management undergraduates. In this lecture, concepts from economics are applied to the provision of healthcare. This is a selection from the hundreds of teaching and learning materials available from the Economics Network site at economicsnetwork.ac.uk
Mo Tanweer's superb notes on aspects of information failures in markets and some of the approaches that can deal with imperfect, incorrect and incomplete information.
Dabur India Ltd is one of India's leading FMCG companies with revenues of US$750 million and a market capitalization of over US$3.5 billion. Dabur was founded in 1884 and is India's largest Ayurvedic and natural health care company with over 250 herbal products. Dabur operates in key categories like hair care, oral care, health care, skin care, home care, and foods, with a wide distribution network of over 2.8 million retail outlets in both urban and rural India. Dabur's products are also available in over 60 countries globally, with 20% of revenues coming from overseas markets. Dabur has transformed from a family-run business into a
The document discusses benchmarking, which is defined as the process of comparing business processes and performance metrics to industry best practices for the purpose of self-improvement. It outlines different types of benchmarking including strategic, process, functional, and competitive benchmarking. The benchmarking process typically involves identifying problem areas, finding organizations with superior performance to study, surveying them to understand metrics and practices, visiting top performers, and implementing improvements. Benchmarking is presented as a continuous process of measuring performance against leaders to drive organizational development.
The document provides an overview of the Indian wafer snacks market. It discusses the market size of approximately Rs. 4,500-5,000 crores annually and growth rate of 30%. Major players include Frito-Lay, Bingo, Haldiram, and Balaji. Frito-Lay commands 45% market share. The document then analyzes the industry attractiveness using Porter's 5 forces model, finding the threat of new entrants and competitive rivalry to be moderate and high respectively. Finally, it summarizes the marketing strategies of leaders Frito-Lay and Bingo, and challenger Smart Chips.
1) The document appears to be an exam paper containing questions from various topics in management and organizational behaviour.
2) It is divided into four sections - Section A contains short answer questions, Section B contains longer answer questions requiring discussion/explanation, Section C also contains longer answer descriptive questions, and Section D contains a case study with related questions.
3) The questions cover topics such as levels of management, emotional intelligence, conflict in organizations, motivation theories, leadership theories, sources of emotions/moods, and the Hawthorne experiments among others.
The document discusses Big Bazaar, a large retail chain in India. It provides details about Big Bazaar such as its size, number of outlets, products offered, target customers, and marketing strategies. It also discusses the Indian retail market size and growth. Finally, it analyzes Big Bazaar's marketing mix and future strategies to expand further.
The document discusses the Lifebuoy brand of soap, which was established in the 1890s in India. It provides key facts about the brand such as that it is owned by Unilever and focuses on health and hygiene. The summary discusses Lifebuoy's origins, positioning as an affordable antiseptic soap, and its health education programs in rural areas that have reached over 100 million people. It also covers Lifebuoy's brand extensions over time to adapt to competition and changing consumer needs.
This document provides an overview of Dabur India Limited, a leading Indian consumer goods company. Some key points:
- Dabur was founded in 1884 and has grown to become India's largest Ayurvedic and natural health care company with a portfolio of over 250 herbal products.
- It has a presence across multiple consumer product categories like hair care, oral care, health care, skin care, home care, and foods.
- Major brands include Dabur, Vatika, Hajmola, Réal, and Fem. Dabur Chyawanprash and Vatika hair oil are among its most popular products.
- The company has annual
Luis Jouselin Ayala Cano describes a strange experience he had one night while chatting online late at night. He heard the water taps in the kitchen sink turn on for a moment around midnight, when everyone else in his home was asleep. Unable to find an explanation for the noise and frightened by the darkness, he became very scared and stopped staying up so late to chat online after that night. He believes it was an unusual event since he clearly heard the water falling in the metal sink, and says we must respect things we don't understand.
The document summarizes key concepts about celestial bodies discussed in a 7th grade science course. It describes different types of celestial bodies like stars, galaxies, and clusters of galaxies. It also discusses the characteristics of stars, groups of stars, shapes of galaxies, and components of the solar system including rocky and gaseous planets. The document provides examples and details about these topics to teach students about the diversity of objects in the universe.
This document summarizes a public meeting held in November 2016 by Tumanako Christian College. The meeting discussed the college's vision to establish a co-ed, interdenominational Christian school in Wellington for years 7-13. It provided an update on the college's progress, including securing a property, applying for integration from the Ministry of Education, and its plans to open in 2018. It asked for financial support to raise the deposit by December 2016 and outlined future fundraising goals to cover costs to open the school.
This document discusses using a Kaizen approach to operations management for hospitals. The Kaizen approach focuses on continuous incremental improvements through small group activities and employee involvement. However, the summary is incomplete as the document text provided is too short and lacks essential details needed to create a meaningful 3 sentence summary.
This document discusses reward systems and legal issues related to performance management. It provides an overview of traditional and contingent pay plans, including reasons for introducing contingent pay plans and possible problems associated with them. It also discusses selecting a contingent pay plan based on organizational culture and strategic direction. Additionally, it covers putting pay in context using various rewards, designing pay structures through job evaluation methods, and legal principles around performance management systems.
Define performance & choosing a measurement approachkahogan62
This document discusses approaches to measuring job performance. It defines performance as behaviors rather than outcomes or results. Performance is determined by an employee's declarative knowledge, procedural knowledge, and motivation. Dimensions of performance include task and contextual performance. The document compares trait, behavior, and results approaches to measuring performance and their appropriate uses depending on factors like the link between behaviors and results.
This document discusses the economic order quantity (EOQ) model. The EOQ model determines the optimal order quantity that minimizes total inventory costs by balancing order processing costs and inventory holding costs. It assumes known demand, lead times, and costs. The formula for economic order quantity is derived and explained. An example application to a coffee maker order at SaveMart is provided to illustrate calculating optimal order quantity and reorder point using EOQ equations. Factors that could impact the EOQ are also listed.
Supply chain risk management is important to identify and mitigate risks from suppliers. A supplier risk scoring tool can help companies assess risks across multiple categories from various suppliers to determine their overall risk level and prioritize resource allocation. This tool evaluates suppliers on categories like financial stability, quality management, and geographic risks to provide an overall risk score for informed decision making.
1) Supply chain management involves coordinating the flow of goods from raw materials to the final consumer across multiple firms to maximize total profits. Distribution channels facilitate this movement and include various intermediaries.
2) Managing distribution effectively can reduce costs and increase profits through strategies like breaking bulk, creating product assortments, and dual distribution systems. Choosing efficient transportation modes is also important.
3) Vertical marketing systems involve cooperation among channel members and include administered, contractual, and corporate models. The level of coordination and control impacts which distribution and logistics strategies are selected.
The document discusses the role of a Project Management Office (PMO) in managing relationships with vendors and contractors. The PMO identifies qualified vendors, develops guidance for managing vendor contracts and performance, and provides oversight to maximize vendor value and optimize their use on projects. Specifically, the PMO establishes processes to acquire, contract with, and oversee vendors throughout a project to help ensure projects meet their objectives.
The document discusses key concepts in negotiation for supply management professionals. It covers objectives of negotiation, when to negotiate, supply management's role in negotiation, preparing for negotiation, and techniques used in negotiation. The preparation process involves establishing cost and non-cost objectives, identifying the desired relationship type, and conducting mock negotiations. Effective techniques include focusing on interests, inventing options for mutual gain, and separating people from problems. Negotiation should be well documented for future learning.
The document discusses conducting a total cost of operations (TCO) analysis when making procurement decisions. It provides an overview of strategic sourcing and the Federal Strategic Sourcing Initiative (FSSI). It defines TCO and explains that TCO looks at all costs associated with an asset over its lifecycle, not just the purchase price. The document outlines key cost elements to consider in a TCO analysis, such as acquisition costs, lifecycle costs including maintenance and operations, and end of life costs. It emphasizes the importance of analyzing both cost elements and cost drivers to fully understand TCO. Examples are provided to illustrate TCO analyses for different commodity types like printers and cars.
This document provides an overview of business process outsourcing (BPO). It discusses the history and growth of BPO since World War II. It also outlines some key advantages like cost savings and focus on core competencies, and disadvantages like loss of knowledge and quality control issues. Examples are provided of large companies participating in BPO, like HP outsourcing to India. Top players in different outsourcing sectors like call centers, software development and business services are listed. Factors that make India and China attractive for BPO are compared. Finally, best practices for companies managing BPO relationships are discussed.
The document discusses procurement processes for acquiring goods and services from outside sources. It covers:
1) Why organizations outsource including reducing costs, focusing on core business, and accessing new skills.
2) The key procurement management processes of planning, solicitation, source selection, contract administration, and closeout.
3) Factors to consider in procurement planning like what, when, and how much to procure as well as contract types involving fixed price, cost reimbursement, and unit prices.
The document discusses supply chain management concepts including the flow of goods and information through the supply chain, supply chain integration, distribution, transportation, and global supply chains. It provides examples of supply chain processes for various industries and discusses how information technology enables supply chain management. Key performance indicators for measuring supply chain performance are also summarized.
Developing Performance Based Work Statementskahogan62
The document discusses performance-based contracting and the importance of a clear Statement of Work (SOW). It provides guidance on developing an effective SOW in 9 steps: 1) establishing a scope statement, 2) listing tasks, 3) grouping tasks, 4) organizing tasks sequentially, 5) identifying inputs, 6) identifying outputs, 7) identifying timelines, 8) developing performance standards, and 9) determining monitoring methods. The SOW forms the basis for proposals, evaluations, and contractor performance assessments in performance-based contracts.
Krause Corporation must decide whether to manufacture 6,500 feet of HVAC piping in-house or purchase pre-fabricated piping from a supplier for a new laboratory building. Manufacturing the piping would require welding multiple 8-foot sections together to achieve the desired 20-foot lengths, increasing time and costs. Purchasing piping at $18.10 per linear foot and in 20-foot sections could reduce installation time and risks of leaks, but may have a higher overall cost than manufacturing. A thorough cost analysis is needed to determine the most cost-effective option while ensuring leak-proof piping for toxic laboratory exhaust.
Thomas Edison opened a laboratory in 1876 in New Jersey where he invented the light bulb. In the 1890s, several of Edison's business interests were consolidated to form the Edison General Electric Company. In 1892, Edison's company merged with Thomson Houston Electric Company to form General Electric Company. GE is now a global conglomerate operating in over 100 countries with over 300,000 employees and revenues of over $150 billion in 2019. GE focuses on industries like aviation, healthcare, renewable energy, and financial services.
This document discusses inventory management for food and beverage operations. It covers topics like inventory classification systems, calculating inventory turnover rates, and maintaining product quality during storage. Procedures for issuing controls are also addressed, with the objectives being to limit storage access, match items removed to production needs, and track quantities and costs removed from storage.
This document provides best practices for leading organizational change based on the experiences of change management experts. It discusses that change is multi-dimensional and involves not just new processes but impacts people. It also notes that change can be perceived positively or negatively. The document then covers why people resist change and common reasons for resistance. It emphasizes that the response to change is highly individual. Finally, it outlines over 20 best practices for leading successful change initiatives, such as developing a compelling vision, understanding resistance, communicating change effectively, and celebrating short-term wins.
The document discusses competitiveness, strategies, and productivity. It defines competitiveness as how well an organization meets customer needs relative to competitors. Competitive strategies include differentiation, cost leadership, and quick response. The document also discusses factors that affect organizational productivity such as capital investment, technology use, management practices, and outsourcing decisions. Improving productivity is important for competitiveness.
This document discusses vertical integration and how ownership structure impacts incentives. It provides examples of General Motors acquiring Fisher Body and PepsiCo owning bottlers. Vertical integration can improve incentives for relationship-specific investments that are non-contractible by giving the investing party control rights. The optimal ownership structure depends on whose actions are most important for value creation and hardest to encourage through contracts alone.
This document discusses key concepts related to Just-in-Time (JIT) and Lean operations including defining JIT, the Toyota Production System (TPS), Lean operations, the seven wastes, the 5Ss, JIT partnerships, variability reduction, and throughput improvement. It also covers JIT inventory techniques like pull systems, reduced lot sizes, and kanban. The overall goal of JIT and Lean is to eliminate waste and provide value to the customer.
The document discusses inventory management and various inventory systems. It defines inventory and different inventory types like raw materials, work in process, and finished goods. It describes the costs of carrying inventory and different inventory measurement methods. It also summarizes economic order quantity models, reorder points, periodic review systems, ABC classification, and anticipatory versus response-based inventory control systems. The goal of inventory management is to balance inventory levels and costs with customer service levels.
SATTA MATKA SATTA FAST RESULT KALYAN TOP MATKA RESULT KALYAN SATTA MATKA FAST RESULT MILAN RATAN RAJDHANI MAIN BAZAR MATKA FAST TIPS RESULT MATKA CHART JODI CHART PANEL CHART FREE FIX GAME SATTAMATKA ! MATKA MOBI SATTA 143 spboss.in TOP NO1 RESULT FULL RATE MATKA ONLINE GAME PLAY BY APP SPBOSS
[To download this presentation, visit:
https://www.oeconsulting.com.sg/training-presentations]
This presentation is a curated compilation of PowerPoint diagrams and templates designed to illustrate 20 different digital transformation frameworks and models. These frameworks are based on recent industry trends and best practices, ensuring that the content remains relevant and up-to-date.
Key highlights include Microsoft's Digital Transformation Framework, which focuses on driving innovation and efficiency, and McKinsey's Ten Guiding Principles, which provide strategic insights for successful digital transformation. Additionally, Forrester's framework emphasizes enhancing customer experiences and modernizing IT infrastructure, while IDC's MaturityScape helps assess and develop organizational digital maturity. MIT's framework explores cutting-edge strategies for achieving digital success.
These materials are perfect for enhancing your business or classroom presentations, offering visual aids to supplement your insights. Please note that while comprehensive, these slides are intended as supplementary resources and may not be complete for standalone instructional purposes.
Frameworks/Models included:
Microsoft’s Digital Transformation Framework
McKinsey’s Ten Guiding Principles of Digital Transformation
Forrester’s Digital Transformation Framework
IDC’s Digital Transformation MaturityScape
MIT’s Digital Transformation Framework
Gartner’s Digital Transformation Framework
Accenture’s Digital Strategy & Enterprise Frameworks
Deloitte’s Digital Industrial Transformation Framework
Capgemini’s Digital Transformation Framework
PwC’s Digital Transformation Framework
Cisco’s Digital Transformation Framework
Cognizant’s Digital Transformation Framework
DXC Technology’s Digital Transformation Framework
The BCG Strategy Palette
McKinsey’s Digital Transformation Framework
Digital Transformation Compass
Four Levels of Digital Maturity
Design Thinking Framework
Business Model Canvas
Customer Journey Map
3 Simple Steps To Buy Verified Payoneer Account In 2024SEOSMMEARTH
Buy Verified Payoneer Account: Quick and Secure Way to Receive Payments
Buy Verified Payoneer Account With 100% secure documents, [ USA, UK, CA ]. Are you looking for a reliable and safe way to receive payments online? Then you need buy verified Payoneer account ! Payoneer is a global payment platform that allows businesses and individuals to send and receive money in over 200 countries.
If You Want To More Information just Contact Now:
Skype: SEOSMMEARTH
Telegram: @seosmmearth
Gmail: seosmmearth@gmail.com
Digital Marketing with a Focus on Sustainabilitysssourabhsharma
Digital Marketing best practices including influencer marketing, content creators, and omnichannel marketing for Sustainable Brands at the Sustainable Cosmetics Summit 2024 in New York
At Techbox Square, in Singapore, we're not just creative web designers and developers, we're the driving force behind your brand identity. Contact us today.
Unveiling the Dynamic Personalities, Key Dates, and Horoscope Insights: Gemin...my Pandit
Explore the fascinating world of the Gemini Zodiac Sign. Discover the unique personality traits, key dates, and horoscope insights of Gemini individuals. Learn how their sociable, communicative nature and boundless curiosity make them the dynamic explorers of the zodiac. Dive into the duality of the Gemini sign and understand their intellectual and adventurous spirit.
Best practices for project execution and deliveryCLIVE MINCHIN
A select set of project management best practices to keep your project on-track, on-cost and aligned to scope. Many firms have don't have the necessary skills, diligence, methods and oversight of their projects; this leads to slippage, higher costs and longer timeframes. Often firms have a history of projects that simply failed to move the needle. These best practices will help your firm avoid these pitfalls but they require fortitude to apply.
Understanding User Needs and Satisfying ThemAggregage
https://www.productmanagementtoday.com/frs/26903918/understanding-user-needs-and-satisfying-them
We know we want to create products which our customers find to be valuable. Whether we label it as customer-centric or product-led depends on how long we've been doing product management. There are three challenges we face when doing this. The obvious challenge is figuring out what our users need; the non-obvious challenges are in creating a shared understanding of those needs and in sensing if what we're doing is meeting those needs.
In this webinar, we won't focus on the research methods for discovering user-needs. We will focus on synthesis of the needs we discover, communication and alignment tools, and how we operationalize addressing those needs.
Industry expert Scott Sehlhorst will:
• Introduce a taxonomy for user goals with real world examples
• Present the Onion Diagram, a tool for contextualizing task-level goals
• Illustrate how customer journey maps capture activity-level and task-level goals
• Demonstrate the best approach to selection and prioritization of user-goals to address
• Highlight the crucial benchmarks, observable changes, in ensuring fulfillment of customer needs
Event Report - SAP Sapphire 2024 Orlando - lots of innovation and old challengesHolger Mueller
Holger Mueller of Constellation Research shares his key takeaways from SAP's Sapphire confernece, held in Orlando, June 3rd till 5th 2024, in the Orange Convention Center.
The 10 Most Influential Leaders Guiding Corporate Evolution, 2024.pdfthesiliconleaders
In the recent edition, The 10 Most Influential Leaders Guiding Corporate Evolution, 2024, The Silicon Leaders magazine gladly features Dejan Štancer, President of the Global Chamber of Business Leaders (GCBL), along with other leaders.
𝐔𝐧𝐯𝐞𝐢𝐥 𝐭𝐡𝐞 𝐅𝐮𝐭𝐮𝐫𝐞 𝐨𝐟 𝐄𝐧𝐞𝐫𝐠𝐲 𝐄𝐟𝐟𝐢𝐜𝐢𝐞𝐧𝐜𝐲 𝐰𝐢𝐭𝐡 𝐍𝐄𝐖𝐍𝐓𝐈𝐃𝐄’𝐬 𝐋𝐚𝐭𝐞𝐬𝐭 𝐎𝐟𝐟𝐞𝐫𝐢𝐧𝐠𝐬
Explore the details in our newly released product manual, which showcases NEWNTIDE's advanced heat pump technologies. Delve into our energy-efficient and eco-friendly solutions tailored for diverse global markets.
[To download this presentation, visit:
https://www.oeconsulting.com.sg/training-presentations]
This PowerPoint compilation offers a comprehensive overview of 20 leading innovation management frameworks and methodologies, selected for their broad applicability across various industries and organizational contexts. These frameworks are valuable resources for a wide range of users, including business professionals, educators, and consultants.
Each framework is presented with visually engaging diagrams and templates, ensuring the content is both informative and appealing. While this compilation is thorough, please note that the slides are intended as supplementary resources and may not be sufficient for standalone instructional purposes.
This compilation is ideal for anyone looking to enhance their understanding of innovation management and drive meaningful change within their organization. Whether you aim to improve product development processes, enhance customer experiences, or drive digital transformation, these frameworks offer valuable insights and tools to help you achieve your goals.
INCLUDED FRAMEWORKS/MODELS:
1. Stanford’s Design Thinking
2. IDEO’s Human-Centered Design
3. Strategyzer’s Business Model Innovation
4. Lean Startup Methodology
5. Agile Innovation Framework
6. Doblin’s Ten Types of Innovation
7. McKinsey’s Three Horizons of Growth
8. Customer Journey Map
9. Christensen’s Disruptive Innovation Theory
10. Blue Ocean Strategy
11. Strategyn’s Jobs-To-Be-Done (JTBD) Framework with Job Map
12. Design Sprint Framework
13. The Double Diamond
14. Lean Six Sigma DMAIC
15. TRIZ Problem-Solving Framework
16. Edward de Bono’s Six Thinking Hats
17. Stage-Gate Model
18. Toyota’s Six Steps of Kaizen
19. Microsoft’s Digital Transformation Framework
20. Design for Six Sigma (DFSS)
To download this presentation, visit:
https://www.oeconsulting.com.sg/training-presentations
Navigating the world of forex trading can be challenging, especially for beginners. To help you make an informed decision, we have comprehensively compared the best forex brokers in India for 2024. This article, reviewed by Top Forex Brokers Review, will cover featured award winners, the best forex brokers, featured offers, the best copy trading platforms, the best forex brokers for beginners, the best MetaTrader brokers, and recently updated reviews. We will focus on FP Markets, Black Bull, EightCap, IC Markets, and Octa.
IMPACT Silver is a pure silver zinc producer with over $260 million in revenue since 2008 and a large 100% owned 210km Mexico land package - 2024 catalysts includes new 14% grade zinc Plomosas mine and 20,000m of fully funded exploration drilling.
Zodiac Signs and Food Preferences_ What Your Sign Says About Your Tastemy Pandit
Know what your zodiac sign says about your taste in food! Explore how the 12 zodiac signs influence your culinary preferences with insights from MyPandit. Dive into astrology and flavors!
2. Problems Due to Asymmetric
Information
adverse selection - opportunism
characterized by an informed person’s
benefiting from trading or otherwise
contracting with a less-informed person
who does not know about an
unobserved characteristic of the
informed person
3. Problems Due to Asymmetric
Information
moral hazard - opportunism
characterized by an informed person’s
taking advantage of a less informed
person through an unobserved action
4. Controlling Opportunistic Behavior
Through Universal Coverage
Adverse selection can be prevented if
informed people have no choice.
A government can avoid adverse selection
by providing insurance to everyone or by
mandating that everyone buy insurance.
5. Equalizing Information
screening - an action taken by an
uninformed person to determine the
information possessed by informed
people.
signaling - an action taken by an
informed person to send information to
an uninformed person.
6. Lemons Market with Fixed Quality
When buyers cannot judge a product’s
quality before purchasing it, low-quality
products—lemons—may drive high-
quality products out of the market.
7. Lemons Market with Fixed Quality
Cars that appear to be identical on the
outside often differ substantially in the
number of repairs they will need.
Some cars —lemons— have a variety of
insidious problems that become apparent to
the owner only after the car has been driven
for a while.
The seller of a used car knows from
experience whether the car is a lemon.
We assume that the seller cannot alter the
quality of the used car
8. Lemons Market with Fixed Quality
Suppose that there are many potential
buyers for used cars.
All are willing to pay $1,000 for a lemon and
$2,000 for a good used car.
9. Markets for Lemons and Good Cars
(a) Ma rket f r Lemons
o (b) Ma rket or Good Cars
f
Prce of a good ca r, $
Prce of a lemon, $
2,000 DG
i
i
1,000 DL
0 0
Lemons per year Good cars per year
10. Lemons Market with Fixed Quality
1,000 owners of lemons and 1,000 owners
of good cars are willing to sell.
The reservation price of owners of lemons—
the lowest price at which they will sell their
cars—is $750.
The reservation price of owners of high-
quality used cars is v, which is less than
$2,000.
11. Markets for Lemons and Good Cars
(a) Ma rket f r Lemons
o (b) Ma rket or Good Cars
f
Prce of a good ca r, $
Prce of a lemon, $
SL
E
2,000 DG
1,750
i
f S2 F
i
1,500 D* 1,500 D*
1,250
e S1
1,000 DL
750
0 1,000 0 1,000
Lemons per year Good cars per year
12. Lemons Market with Fixed Quality
If both sellers and buyers know the quality
of all the used cars before any sales take
place, all the cars are sold, and good cars
sell for more than lemons.
This market is efficient because the goods
go to the people who value them the most.
All the cars are sold if everyone has the
same information
13. Lemons Market with Fixed Quality
The amount of information they have
affects the price at which the cars sell.
If no one can tell a lemon from a good car at
the time of purchase, both types of cars sell
for the same price.
14. Lemons Market with Fixed Quality
Suppose that everyone is risk neutral and
no one can identify the lemons: Buyers
and sellers are equally ignorant.
A buyer has an equal chance of buying a
lemon or a good car.
The expected value of a used car is
15. Lemons Market with Fixed Quality
This market is efficient because the cars
go to people who value them more than
their original owners.
Sellers of good-quality cars are implicitly
subsidizing sellers of lemons.
16. Asymmetric Information.
If sellers know the quality but buyers do
not, this market may be inefficient:
The better-quality cars may not be sold
even though buyers value good cars more
than sellers do.
The equilibrium in this market depends on
whether the value that the owners of good
cars place on their cars, v, is greater or less
than the expected value of buyers, $1,500.
17. Figure 19.1 Markets for Lemons and
Good Cars
(a) Ma rket f r Lemons
o (b) Ma rket or Good Cars
f
Prce of a good ca r, $
Prce of a lemon, $
SL
E
2,000 DG
1,750
i
f S2 F
i
1,500 D* 1,500 D*
1,250
e S1
1,000 DL
750
0 1,000 0 1,000
Lemons per year Good cars per year
18. Asymmetric Information.
Consequently, asymmetric information
does not cause an efficiency problem,
but it does have equity implications.
Sellers of lemons benefit and sellers of
good cars suffer from consumers’ inability
to distinguish quality.
19. Asymmetric Information.
Now suppose that the sellers of good cars
place a value of v = $1,750 on their cars and
thus are unwilling to sell them for $1,500.
As a result, the lemons drive good cars out of the
market.
Buyers realize that, at any price less than $1,750,
they can buy only lemons.
Consequently, in equilibrium, the 1,000 lemons sell
for the expected (and actual) price of $1,000, and
no good cars change hands.
20. Asymmetric Information.
This equilibrium is inefficient because
high-quality cars remain in the hands of
people who value them less than
potential buyers do.
21. Lemons Market with Variable Quality
Suppose that it costs $10 to produce a low-
quality book bag and $20 to produce a high-
quality bag,
consumers cannot distinguish between the
products before purchase,
there are no repeat purchases, and
consumers value the bags at their cost of
production.
The five firms in the market produce 100 bags
each.
A firm produces only high-quality or only low-
quality bags.
22. Lemons Market with Variable Quality
If one firm makes a high-quality bag and
all the others make low-quality bags, the
expected value per bag to consumers is
Thus, if one firm raises the quality of its
product, all firms benefit because the bags
sell for $12 instead of $10.
23. Lemons Market with Variable Quality
Because the high-quality firm incurs all
the expenses of raising quality, $10
extra per bag, and reaps only a fraction,
$2, of the benefits, it opts not to produce
the high-quality bags.
Therefore, due to asymmetric
information, the firms do not produce
high-quality goods even though
consumers are willing to pay for the
extra quality.
24. Limiting Lemons
Laws to Prevent Opportunism.
Consumer Screening.
Third-Party Comparisons.
Standards and Certification.
Signaling by Firms.
25. Price Discrimination Due to False
Beliefs About Quality
One way in which firms confuse
consumers is to create noise by selling
virtually the same product under various
brand names.
26. Market Power from Price
Ignorance
Suppose that many stores in a town sell
the same good.
If consumers have full information about
prices, all stores charge the full-information
competitive price, p*.
If one store were to raise its price above p*,
the store would lose all its business.
Each store faces a residual demand curve
that is horizontal at the going market price
and has no market power.
27. Market Power from Price
Ignorance
If consumers have limited information
about the price that firms charge for a
product, one store can charge more
than others and not lose all its
customers.
Customers who do not know that the
product is available for less elsewhere keep
buying from the high-price store.
Thus, each store faces a downward-sloping
residual demand curve and has some
market power.
28. Tourist-Trap Model
You arrive in a small town near the site of the
discovery of gold in California. Souvenir shops crowd
the street. Wandering by one of these stores, you see
that it sells the town’s distinctive snowy: a plastic ball
filled with water and imitation snow featuring a model
of the Donner Party. You instantly decide that you
must buy at least one of these tasteful mementos—
perhaps more if the price is low enough. Your bus will
leave very soon, so you can’t check the price at each
shop to find the lowest price. Moreover, determining
which shop has the lowest price won’t be useful to
you in the future because you do not intend to return
anytime soon.
29. Tourist-Trap Model
Let’s assume that you and other tourists
have a guidebook that reports how
many souvenir shops charge each
possible price for the snowy, but the
guidebook does not state the price at
any particular shop. There are many
tourists in your position, each with an
identical demand function.
30. Tourist-Trap Model
It costs each tourist c in time and
expenses to visit a shop to check the
price or buy a snowy.
Thus, if the price is p, the cost of buying a
snowy at the first shop you visit is p + c.
If you go to two souvenir shops before
buying at the second shop, the cost of the
snowy is p + 2c.
31. When Price Is Not Competitive.
Will all souvenir shops charge the same
price?
If so, what price will they charge?
32. When Price Is Not Competitive.
If all other shops charge p*, a firm can
profitably charge p1 = p* + ε,
where ε, a small positive number, is the
shop’s price markup.
If consumers have limited information
about price, an equilibrium in which all
firms charge the full-information,
competitive price is impossible.
33. Monopoly Price.
Can there be an equilibrium in which all
stores charge the same price and that
price is higher than the competitive
price?
The monopoly price may be an equilibrium
price.
34. Monopoly Price.
When consumers have asymmetric
information and when search costs and
the number of firms are large, the only
possible single-price equilibrium is at the
monopoly price.