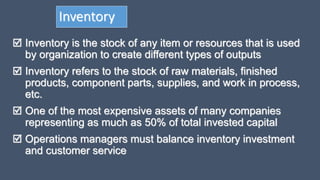
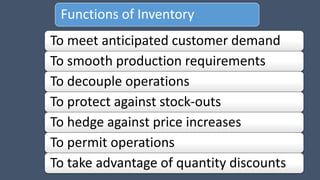
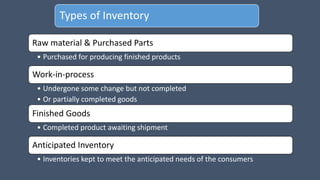
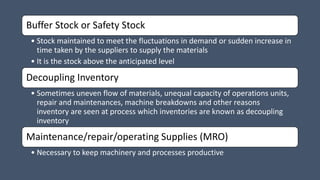
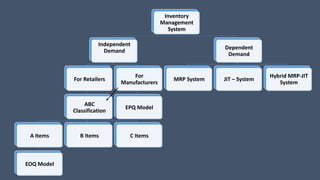
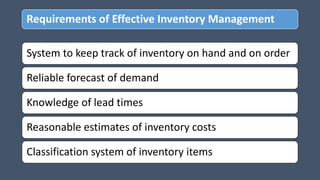
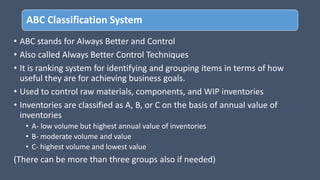
Inventory Management
Inventory
 Inventory is the stock of any item or resources that is used
by organization to create different types of outputs
 Inventory refers to the stock of raw materials, finished
products, component parts, supplies, and work in process,
etc.
 One of the most expensive assets of many companies
representing as much as 50% of total invested capital
 Operations managers must balance inventory investment
and customer service
Functions of Inventory
To meet anticipated customer demand
To smooth production requirements
To decouple operations
To protect against stock-outs
To hedge against price increases
To permit operations
To take advantage of quantity discounts
Types of Inventory
Raw material & Purchased Parts
• Purchased for producing finished products
Work-in-process
• Undergone some change but not completed
• Or partially completed goods
Finished Goods
• Completed product awaiting shipment
Anticipated Inventory
• Inventories kept to meet the anticipated needs of the consumers
Buffer Stock or Safety Stock
• Stock maintained to meet the fluctuations in demand or sudden increase in
time taken by the suppliers to supply the materials
• It is the stock above the anticipated level
Decoupling Inventory
• Sometimes uneven flow of materials, unequal capacity of operations units,
repair and maintenances, machine breakdowns and other reasons
inventory are seen at process which inventories are known as decoupling
inventory
Maintenance/repair/operating Supplies (MRO)
• Necessary to keep machinery and processes productive
Inventory Costs
Holding Cost(Carrying Cost)
Ordering Cost (Setup Cost)
Stock Out Cost (Back Log Cost)
Total Inventory Cost
Holding Costs: Interest, insurance, taxes, depreciation,
obsolescence, deterioration, spoilage, breakage and
warehouse costs
Ordering Costs: cost of placing order, cost of postage,
telephone expenses, fax expenses, email expenses, labor
cost, etc.
Stock Out Cost: opportunity cost of not making sale, loss of
customer goodwill, customer loyalty, etc
Total Inventory Cost: Purchase Cost + Ordering Cost +
Carrying Cost + Shortage cost
Inventory Management System
• A system to manage the flow of materials
• It provides the organizational structure and the operating
policies for maintaining and controlling goods to be stocked.
• Involves
• Timing the order placement
• Keeping track of what has been offered, how much and from
whom
• Ensures
• Whether supplier have received the order
• Are the goods shipped
• Dates are correct or not
Inventory
Management
System
Independent
Demand
For Retailers
ABC
Classification
A Items
EOQ Model
B Items C Items
For
Manufacturers
EPQ Model
Dependent
Demand
MRP System JIT – System
Hybrid MRP-JIT
System
Requirements of Effective Inventory Management
System to keep track of inventory on hand and on order
Reliable forecast of demand
Knowledge of lead times
Reasonable estimates of inventory costs
Classification system of inventory items
Independent Demand Vs Dependent Demand
• Differentiated on the basis of if the inventory systems are predicated on
whether demand is derived from and end item or is related to the item
itself
• If the demand for any product is dependent on other economic variables
rather than other products such demand is called independent demand
• If the demand of any product is dependent on other products, such
demand is called dependent demand
• In independent demand, the demands for various items are unrelated to
each other.
• In dependent demand, demand for any one item is a direct result of
some other item(usually of a higher level)
Finished
Product
Component 1
Sub-
component 1-
1
Sub-
component 1-
2
Component 2
Sub
component 2
Independent
Demand
Dependent
Demand
E.g. Motorbike and Tyre
Inventory Counting Systems
•Periodic Inventory System
•Perpetual Inventory System
•Two-bin system
•Universal bar code
•Periodic System
•Inventory items are counted at periodic intervals
(week, month, quarter, half year, year, etc)
•It involves ordering at a particular point of time
•Perpetual Inventory System
•Inventory is counted on a continuous basis
•Reordering is done if the inventory reaches a
predetermined minimum level
•It involves two systems
• Two-bin system
• Universal Product Code/Bar Code
Two-bin System
•Involves use of two containers for inventory
•Items are withdrawn from the first bin
•When items are finished, reordering is done
•Sometimes order card is placed at the bottom of
the first bin to remind for reordering
•The second container contains the safety stock
Universal Product Code/Bar Code
•Bar code is used to detect information about
product
•The data is recorded and re-ordering is done
ABC Classification System
• ABC stands for Always Better and Control
• Also called Always Better Control Techniques
• It is ranking system for identifying and grouping items in terms of how
useful they are for achieving business goals.
• Used to control raw materials, components, and WIP inventories
• Inventories are classified as A, B, or C on the basis of annual value of
inventories
• A- low volume but highest annual value of inventories
• B- moderate volume and value
• C- highest volume and lowest value
(There can be more than three groups also if needed)
• Based on the principle of Juran, law of vital few and trivial
many, originally derived by Pareto as few causes account for
most effect, also called 80:20 rule.
• Focus on 20% of vital inventory which covers 80% of total
inventory cost.
Features of ABC Analysis
ITEM A: Cover around 70 – 85% of total inventory cost and constitute
10 – 20% of total items
• Frequently purchased from suppliers in small quantity
• Needs rigid control done by top management
• Focus on maintaining low safety stock
• Needs good forecasting
• Large no. of alternative suppliers needed
ITEM B: Cover around 10 – 25% of total inventory cost and constitute
20 – 30% of total items
• They need moderate control
• Purchased on the basis of past requirements
• Safety stocks up to 2 – 3 months are kept
• Few reliable sources of supply are made
• Controlled by middle management
ITEM C: Cover around 5 – 15% of total inventory cost and
constitute 60 – 70% of total items
• Needs least control
• Procured just before they finish
• Safety stock of more than 3 months are kept
• Future requirements are never calculated only rough estimates
work
• Clerks and supervisors manage such inventory
Procedural steps for ABC Analysis
• Identify all the items used in the industry
• List the items as per their value
• Annual value = Unit cost * Annual consumption rate
• Arrange these items in descending order on the basis of
value
• Compute the percentage of total value of all the items also
calculate the cumulative percentage of values
• Compute the percentage of number of items and also the
cumulative percentage of number of items
• Draw a graph plotting percentage of number of items in X-
axis and value in Y-axis.
Materials Requirement Planning
It is a computer based information system that
translates the finished product requirement of
the master production schedule into time-
phased requirements for subassemblies,
component parts, and raw materials
MRP begins with a schedule for finished goods
that is converted into a schedule of requirements
for the subassemblies, component parts, and raw
materials needed to produce the finished items
in the specified time frame
Master Production Schedule
It specifies what is to be made and when
It should be in accordance with the Aggregate Production Plan
it tells us what is required to satisfy demand and meet
production plan
While aggregate production plan is established in gross terms
such as families of products or tons of steel, the master
production schedule is established in terms of specific
products
The Planning Process
Change
production
plan?Master production
schedule
Management
Return on
investment
Capital
Engineering
Design
completion
Aggregate
production
plan
Procurement
Supplier
performance
Human resources
Manpower
planning
Production
Capacity
Inventory
Marketing
Customer
demand
Finance
Cash flow
The Planning Process
Is capacity plan
being met?
Is execution
meeting the
plan?
Change master
production
schedule?
Change capacity?
Change
requirements?
No
Execute
material plans
Execute capacity plans
Yes
Realistic?
Capacity requirements
plan
Material requirements
plan
Master production
schedule
Aggregate
Production Plan
Months January February
Aggregate Production Plan 1,500 1,200
(Shows the total
quantity of amplifiers)
Weeks 1 2 3 4 5 6 7 8
Master Production Schedule
(Shows the specific type and
quantity of amplifier to be
produced
240-watt amplifier 100 100 100 100
150-watt amplifier 500 500 450 450
75-watt amplifier 300 100
MRP System
•MRP inputs MRP Processing MRP Outputs
MRP Structure
Output Reports
MRP by period
report
MRP by date
report
Planned order report
Purchase advice
Exception reports
Order early or late or not
needed
Order quantity too small
or too large
Data Files
Purchasing data
BOM
Lead times
(Item master file)
Inventory data
Master
production schedule
Material requirement
planning programs
(computer and
software)
MRP Inputs
1. Master Production Schedule(MPS)
• It is developed initially from firm customer orders or from
forecasts of demand before the MRP system begins to
operate
• MPS identifies the quantity of each end product and when
it needs to be produced during each future period
• MPS governs the MRP system’s recommended actions on
the timing of procuring materials and producing
subcomponents, which are geared to meeting the MPS
output schedule
2. Bills of Materials (BOM)
• It identifies how each end product is manufactured,
specifying all subcomponent items, their sequence
of buildup, their quantity in each finished unit,
and the work centers performing the buildup
sequence
• The primary information from the BOM is the
product structure tree
• A product structure tree exhibits the product,
components and subcomponents
3. The Inventory Records
•It refers to stored information on the status of
each item by time period
•This includes gross requirements, scheduled
receipts, and expected amount on hand
MRP Processing
• The MRP processing accepts the master schedule and
determines the components schedules for
successively lower level items of the product
structures
• It calculates gross requirements, how many units from
inventory are already available, the net quantity that
must be planned or receiving new shipments and
when orders for the new shipments mush be placed
MRP Output
•Primary Reports
• Planned orders, a schedule indicating the amount and timing
of future orders
• Order releases, authorizing the execution of planned orders
• Changes to the planned orders, including revisions to due
dates or order quantitative and cancellations of orders
•Secondary Reports
• Performance Control Reports- evaluate the system
operations
• Planning Reports- forecasting future inventory requirements
• Exception Reports- major discrepancies
MRP Objectives
•Inventory reduction- MRP enables managers to
procure that component as it is needed
•Reduction of production and delivery lead times- By
coordinating inventories, procurement,
and production decision
•Realistic commitment- Using MRP, production can
give marketing timely information about
likely delivery times to prospective customers
•Increased efficiency- Close coordination, fewer
unplanned interruptions, etc. can help boost
efficiency
Benefits of MRP
•Low levels of in-process inventories
•The ability to keep track of material
requirements
•The ability to evaluate capacity requirements
generated by a given master schedule
•A means of allocating production line
Requirements of MRP
•A computer and necessary software
programs to handle computations and
maintain records
•Accurate and up to date
•Master schedules
•Bills of materials
•Inventory records
MRP in Services
•E.g. Restaurant
Enterprise Resource Planning (ERP)
 It is a method of effective planning of all the resources
in an enterprise or organization.
 An extension of the MRP system to tie in customers
and suppliers
1. Allows automation and integration of many business
processes
2. Shares common data bases and business practices
3. Produces information in real time
 Coordinates business from supplier evaluation to
customer invoicing
•ERP is a software package that organizes and
manages a company’s business processes by
sharing information across all functional areas in
the organization
ERP System
• An ERP system is a set of integrated business
applications or models which carryout common
business functions such as general ledger accounting,
accounts receivables, material requirement planning,
order management, inventory control and HRM.
• With ERP, companies could integrate their accounting,
sales, distribution, manufacturing, planning
purchasing, human resources and other transactions
into one application software.
ERP system is superior than old approaches of
integration in two ways
•ERP modules are integrated, primarily though a
common set of definitions and a common
database
•ERP systems are based on a value chain view of
the business in which functional departments
coordinate their work
Advantages of ERP System
• Helps managing resources efficiently
• Simplifies customer interaction and speeds production
with it’s configure to order capabilities
• Facilitates interaction through database
• Centralizes control over information and standardize
process
• Helps to build corporate image
• Facilitates integration
Disadvantages of ERP Systems
• Difficult to implement. The company must change its
way of doing business.
• Expensive
• For multi-divisional firms, implementing an ERP
system is a very complex
Methods of Minimizing Non-sampling Errors
• Checking the sampling process
• Preparation of questionnaire
• Pilot survey
• Fix procedures
• Use of competent manpower
• Provide information
• Provide training
• Use of experts
• Checking data processing and analysis

Inventory management

  • 1.
  • 2.
    Inventory  Inventory isthe stock of any item or resources that is used by organization to create different types of outputs  Inventory refers to the stock of raw materials, finished products, component parts, supplies, and work in process, etc.  One of the most expensive assets of many companies representing as much as 50% of total invested capital  Operations managers must balance inventory investment and customer service
  • 3.
    Functions of Inventory Tomeet anticipated customer demand To smooth production requirements To decouple operations To protect against stock-outs To hedge against price increases To permit operations To take advantage of quantity discounts
  • 4.
    Types of Inventory Rawmaterial & Purchased Parts • Purchased for producing finished products Work-in-process • Undergone some change but not completed • Or partially completed goods Finished Goods • Completed product awaiting shipment Anticipated Inventory • Inventories kept to meet the anticipated needs of the consumers
  • 5.
    Buffer Stock orSafety Stock • Stock maintained to meet the fluctuations in demand or sudden increase in time taken by the suppliers to supply the materials • It is the stock above the anticipated level Decoupling Inventory • Sometimes uneven flow of materials, unequal capacity of operations units, repair and maintenances, machine breakdowns and other reasons inventory are seen at process which inventories are known as decoupling inventory Maintenance/repair/operating Supplies (MRO) • Necessary to keep machinery and processes productive
  • 6.
    Inventory Costs Holding Cost(CarryingCost) Ordering Cost (Setup Cost) Stock Out Cost (Back Log Cost) Total Inventory Cost
  • 7.
    Holding Costs: Interest,insurance, taxes, depreciation, obsolescence, deterioration, spoilage, breakage and warehouse costs Ordering Costs: cost of placing order, cost of postage, telephone expenses, fax expenses, email expenses, labor cost, etc. Stock Out Cost: opportunity cost of not making sale, loss of customer goodwill, customer loyalty, etc Total Inventory Cost: Purchase Cost + Ordering Cost + Carrying Cost + Shortage cost
  • 8.
    Inventory Management System •A system to manage the flow of materials • It provides the organizational structure and the operating policies for maintaining and controlling goods to be stocked. • Involves • Timing the order placement • Keeping track of what has been offered, how much and from whom • Ensures • Whether supplier have received the order • Are the goods shipped • Dates are correct or not
  • 9.
    Inventory Management System Independent Demand For Retailers ABC Classification A Items EOQModel B Items C Items For Manufacturers EPQ Model Dependent Demand MRP System JIT – System Hybrid MRP-JIT System
  • 10.
    Requirements of EffectiveInventory Management System to keep track of inventory on hand and on order Reliable forecast of demand Knowledge of lead times Reasonable estimates of inventory costs Classification system of inventory items
  • 11.
    Independent Demand VsDependent Demand • Differentiated on the basis of if the inventory systems are predicated on whether demand is derived from and end item or is related to the item itself • If the demand for any product is dependent on other economic variables rather than other products such demand is called independent demand • If the demand of any product is dependent on other products, such demand is called dependent demand • In independent demand, the demands for various items are unrelated to each other. • In dependent demand, demand for any one item is a direct result of some other item(usually of a higher level)
  • 12.
    Finished Product Component 1 Sub- component 1- 1 Sub- component1- 2 Component 2 Sub component 2 Independent Demand Dependent Demand E.g. Motorbike and Tyre
  • 13.
    Inventory Counting Systems •PeriodicInventory System •Perpetual Inventory System •Two-bin system •Universal bar code
  • 14.
    •Periodic System •Inventory itemsare counted at periodic intervals (week, month, quarter, half year, year, etc) •It involves ordering at a particular point of time •Perpetual Inventory System •Inventory is counted on a continuous basis •Reordering is done if the inventory reaches a predetermined minimum level •It involves two systems • Two-bin system • Universal Product Code/Bar Code
  • 15.
    Two-bin System •Involves useof two containers for inventory •Items are withdrawn from the first bin •When items are finished, reordering is done •Sometimes order card is placed at the bottom of the first bin to remind for reordering •The second container contains the safety stock
  • 16.
    Universal Product Code/BarCode •Bar code is used to detect information about product •The data is recorded and re-ordering is done
  • 17.
    ABC Classification System •ABC stands for Always Better and Control • Also called Always Better Control Techniques • It is ranking system for identifying and grouping items in terms of how useful they are for achieving business goals. • Used to control raw materials, components, and WIP inventories • Inventories are classified as A, B, or C on the basis of annual value of inventories • A- low volume but highest annual value of inventories • B- moderate volume and value • C- highest volume and lowest value (There can be more than three groups also if needed)
  • 18.
    • Based onthe principle of Juran, law of vital few and trivial many, originally derived by Pareto as few causes account for most effect, also called 80:20 rule. • Focus on 20% of vital inventory which covers 80% of total inventory cost.
  • 19.
    Features of ABCAnalysis ITEM A: Cover around 70 – 85% of total inventory cost and constitute 10 – 20% of total items • Frequently purchased from suppliers in small quantity • Needs rigid control done by top management • Focus on maintaining low safety stock • Needs good forecasting • Large no. of alternative suppliers needed ITEM B: Cover around 10 – 25% of total inventory cost and constitute 20 – 30% of total items • They need moderate control • Purchased on the basis of past requirements • Safety stocks up to 2 – 3 months are kept • Few reliable sources of supply are made • Controlled by middle management
  • 20.
    ITEM C: Coveraround 5 – 15% of total inventory cost and constitute 60 – 70% of total items • Needs least control • Procured just before they finish • Safety stock of more than 3 months are kept • Future requirements are never calculated only rough estimates work • Clerks and supervisors manage such inventory
  • 21.
    Procedural steps forABC Analysis • Identify all the items used in the industry • List the items as per their value • Annual value = Unit cost * Annual consumption rate • Arrange these items in descending order on the basis of value • Compute the percentage of total value of all the items also calculate the cumulative percentage of values • Compute the percentage of number of items and also the cumulative percentage of number of items • Draw a graph plotting percentage of number of items in X- axis and value in Y-axis.
  • 23.
    Materials Requirement Planning Itis a computer based information system that translates the finished product requirement of the master production schedule into time- phased requirements for subassemblies, component parts, and raw materials MRP begins with a schedule for finished goods that is converted into a schedule of requirements for the subassemblies, component parts, and raw materials needed to produce the finished items in the specified time frame
  • 24.
    Master Production Schedule Itspecifies what is to be made and when It should be in accordance with the Aggregate Production Plan it tells us what is required to satisfy demand and meet production plan While aggregate production plan is established in gross terms such as families of products or tons of steel, the master production schedule is established in terms of specific products
  • 25.
    The Planning Process Change production plan?Masterproduction schedule Management Return on investment Capital Engineering Design completion Aggregate production plan Procurement Supplier performance Human resources Manpower planning Production Capacity Inventory Marketing Customer demand Finance Cash flow
  • 26.
    The Planning Process Iscapacity plan being met? Is execution meeting the plan? Change master production schedule? Change capacity? Change requirements? No Execute material plans Execute capacity plans Yes Realistic? Capacity requirements plan Material requirements plan Master production schedule
  • 27.
    Aggregate Production Plan Months JanuaryFebruary Aggregate Production Plan 1,500 1,200 (Shows the total quantity of amplifiers) Weeks 1 2 3 4 5 6 7 8 Master Production Schedule (Shows the specific type and quantity of amplifier to be produced 240-watt amplifier 100 100 100 100 150-watt amplifier 500 500 450 450 75-watt amplifier 300 100
  • 28.
    MRP System •MRP inputsMRP Processing MRP Outputs
  • 29.
    MRP Structure Output Reports MRPby period report MRP by date report Planned order report Purchase advice Exception reports Order early or late or not needed Order quantity too small or too large Data Files Purchasing data BOM Lead times (Item master file) Inventory data Master production schedule Material requirement planning programs (computer and software)
  • 30.
    MRP Inputs 1. MasterProduction Schedule(MPS) • It is developed initially from firm customer orders or from forecasts of demand before the MRP system begins to operate • MPS identifies the quantity of each end product and when it needs to be produced during each future period • MPS governs the MRP system’s recommended actions on the timing of procuring materials and producing subcomponents, which are geared to meeting the MPS output schedule
  • 31.
    2. Bills ofMaterials (BOM) • It identifies how each end product is manufactured, specifying all subcomponent items, their sequence of buildup, their quantity in each finished unit, and the work centers performing the buildup sequence • The primary information from the BOM is the product structure tree • A product structure tree exhibits the product, components and subcomponents
  • 32.
    3. The InventoryRecords •It refers to stored information on the status of each item by time period •This includes gross requirements, scheduled receipts, and expected amount on hand
  • 33.
    MRP Processing • TheMRP processing accepts the master schedule and determines the components schedules for successively lower level items of the product structures • It calculates gross requirements, how many units from inventory are already available, the net quantity that must be planned or receiving new shipments and when orders for the new shipments mush be placed
  • 34.
    MRP Output •Primary Reports •Planned orders, a schedule indicating the amount and timing of future orders • Order releases, authorizing the execution of planned orders • Changes to the planned orders, including revisions to due dates or order quantitative and cancellations of orders •Secondary Reports • Performance Control Reports- evaluate the system operations • Planning Reports- forecasting future inventory requirements • Exception Reports- major discrepancies
  • 35.
    MRP Objectives •Inventory reduction-MRP enables managers to procure that component as it is needed •Reduction of production and delivery lead times- By coordinating inventories, procurement, and production decision •Realistic commitment- Using MRP, production can give marketing timely information about likely delivery times to prospective customers •Increased efficiency- Close coordination, fewer unplanned interruptions, etc. can help boost efficiency
  • 36.
    Benefits of MRP •Lowlevels of in-process inventories •The ability to keep track of material requirements •The ability to evaluate capacity requirements generated by a given master schedule •A means of allocating production line
  • 37.
    Requirements of MRP •Acomputer and necessary software programs to handle computations and maintain records •Accurate and up to date •Master schedules •Bills of materials •Inventory records
  • 38.
  • 39.
    Enterprise Resource Planning(ERP)  It is a method of effective planning of all the resources in an enterprise or organization.  An extension of the MRP system to tie in customers and suppliers 1. Allows automation and integration of many business processes 2. Shares common data bases and business practices 3. Produces information in real time  Coordinates business from supplier evaluation to customer invoicing
  • 40.
    •ERP is asoftware package that organizes and manages a company’s business processes by sharing information across all functional areas in the organization
  • 41.
    ERP System • AnERP system is a set of integrated business applications or models which carryout common business functions such as general ledger accounting, accounts receivables, material requirement planning, order management, inventory control and HRM. • With ERP, companies could integrate their accounting, sales, distribution, manufacturing, planning purchasing, human resources and other transactions into one application software.
  • 42.
    ERP system issuperior than old approaches of integration in two ways •ERP modules are integrated, primarily though a common set of definitions and a common database •ERP systems are based on a value chain view of the business in which functional departments coordinate their work
  • 43.
    Advantages of ERPSystem • Helps managing resources efficiently • Simplifies customer interaction and speeds production with it’s configure to order capabilities • Facilitates interaction through database • Centralizes control over information and standardize process • Helps to build corporate image • Facilitates integration
  • 44.
    Disadvantages of ERPSystems • Difficult to implement. The company must change its way of doing business. • Expensive • For multi-divisional firms, implementing an ERP system is a very complex
  • 45.
    Methods of MinimizingNon-sampling Errors • Checking the sampling process • Preparation of questionnaire • Pilot survey • Fix procedures • Use of competent manpower • Provide information • Provide training • Use of experts • Checking data processing and analysis