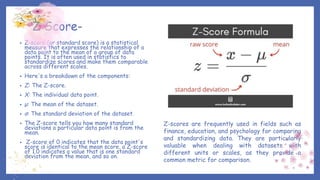
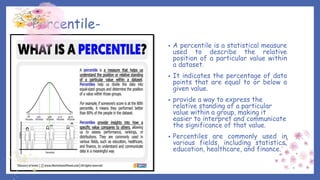
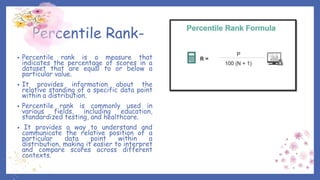
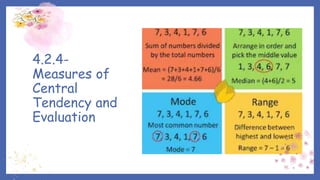
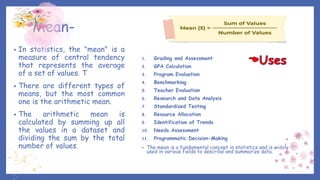
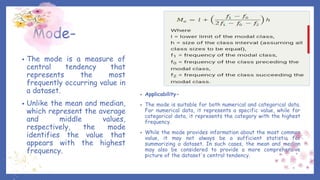
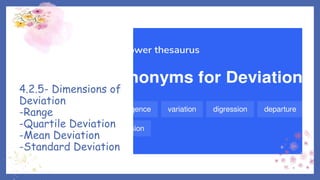
Evaluation Unit 4
Statistics in the View point of Evaluation
Unit 4 Syllabus-
4.2.1- Measuring Scales- Meaning and Statistical Use
4.2.2- Conversion and interpretation of Test Score
4.2.3- Normal Probability Curve
4.2.4- Central Tendency and its importance in Evaluation.
4.2.5- Dimensions of Deviation
The Unit 4 is all about Statistics…
Statistics is the study of the collection, analysis, interpretation, presentation, and organization of data.
In other words, it is a mathematical discipline to collect, summarize data.
Also, we can say that statistics is a branch of applied mathematics.
Statistics is simply defined as the study and manipulation of data. As we have already discussed in the introduction that statistics deals with the analysis and computation of numerical data.
Projective methods of Evaluation through Statistics-
Measurement is a process of assigning numbers to individuals or their characteristics according to specific rules.” (Eble and Frisbie, 1991, p.25).
This is very common and simple definition of the term ‘measurement’.
You can say that measurement is a quantitative description of one’s performance. Gay (1991) further simplified the term as a process of quantifying the degree to which someone or something possessed a given trait, i.e., quality, characteristics, or features.
Measurement assigns a numeral to quantify certain aspects of human and non-human beings.
It is numerical description of objects, traits, attributes, characteristics or behaviours.
Measurement is not an end in itself but definitely a means to evaluate the abilities of a person in education and other fields as well.
Measurement Scale-
Whenever we measure anything, we assign a numerical value. This numerical value is known as scale of measurement. A scale is a system or scheme for assigning values or scores to the characteristics being measured (Sattler, 1992). Like for measuring any aspect of the human being we assign a numeral to quantify it, further we can provide an order to it if we know the similar type of measurement of other members of the group, we can also make groups considering equal interval scores within the group.
Psychologist Stanley Stevens developed the four common scales of measurement:
Nominal
Ordinal
Interval &
Ratio
Each scale of measurement has properties that determine how to properly analyze the data.
Nominal scale-
In nominal scale, a numeral or label is assigned for characterizing the attribute of the person or thing.
That caters no order to define the attribute as high-low, more-less, big-small, superior-inferior etc.
In nominal scale, assigning a numeral is purely an individual matter.
It is nothing to do with the group scores or group measurement.
Statistics such as frequencies, percentages, mode, and chi-square tests are used in nominal measurement.
Examples include gender (male, female), colors (red, blue, green), or types of fruit (apple, banana, orange).
Ordinal scale-
Ordinal scale is synonymous to ranking or g
CRM 101: What is CRM?
This is a simple definition of CRM.
Customer relationship management (CRM) is a technology for managing all your company’s relationships and interactions with customers and potential customers. The goal is simple: Improve business relationships to grow your business. A CRM system helps companies stay connected to customers, streamline processes, and improve profitability.
When people talk about CRM, they are usually referring to a CRM system, a tool that helps with contact management, sales management, agent productivity, and more. CRM tools can now be used to manage customer relationships across the entire customer lifecycle, spanning marketing, sales, digital commerce, and customer service interactions.
A CRM solution helps you focus on your organization’s relationships with individual people — including customers, service users, colleagues, or suppliers — throughout your lifecycle with them, including finding new customers, winning their business, and providing support and additional services throughout the relationship.
Who is CRM for?
A CRM system gives everyone — from sales, customer service, business development, recruiting, marketing, or any other line of business — a better way to manage the external interactions and relationships that drive success. A CRM tool lets you store customer and prospect contact information, identify sales opportunities, record service issues, and manage marketing campaigns, all in one central location — and make information about every customer interaction available to anyone at your company who might need it.
With visibility and easy access to data, it's easier to collaborate and increase productivity. Everyone in your company can see how customers have been communicated with, what they’ve bought, when they last purchased, what they paid, and so much more. CRM can help companies of all sizes drive business growth, and it can be especially beneficial to a small business, where teams often need to find ways to do more with less.
Here’s why CRM matters to your business.
CRM is the largest and fastest-growing enterprise application software category, and worldwide spending on CRM is expected to reach USD $114.4 billion by the year 2027. If your business is going to last, you need a strategy for the future that’s centered around your customers, and enabled by the right technology. You have targets for sales, business objectives, and profitability. But getting up-to-date, reliable information on your progress can be tricky. How do you translate the many streams of data coming in from sales, customer service, marketing, and social media monitoring into useful business information?
A CRM system can give you a clear overview of your customers. You can see everything in one place — a simple, customizable dashboard that can tell you a customer’s previous history with you, the status of their orders, any outstanding customer service issues, and more. You can even choose to include information
Business Research Method - Unit III, AKTU, Lucknow SyllabusKartikeya Singh
Business Research Method - Unit III, AKTU, Lucknow Syllabus,
Research Methodology - Topics Covered - Scaling & Measurement techniques: Concept of Measurement: Need of Measurement; Problems in measurement in management research – Validity and Reliability. Levels of measurement – Nominal, Ordinal, Interval, Ratio.
Attitude Scaling Techniques: Concept of Scale – Rating Scales viz. Likert Scales, Semantic Differential Scales, Constant Sum Scales, Graphic Rating Scales – Ranking Scales – Paired comparison & Forced Ranking – Concept and Application.
1. Introduction to statistics in curriculum and Instruction
1 The definition of statistics and other related terms
1.2 Descriptive statistics
3 Inferential statistics
1.4 Function and significance of statistics in education
5 Types and levels of measurement scale
2. Introduction to SPSS Software
3. Frequency Distribution
4. Normal Curve and Standard Score
5. Confidence Interval for the Mean, Proportions, and Variances
6. Hypothesis Testing with One and two Sample
7. Two-way Analysis of Variance
8. Correlation and Simple Linear Regression
9. CHI-SQUARE
Evolution of Democracy by Samruddhi Chepe.pptxSamruddhi Chepe
Phase OneAssembly Democracy
Starting around 2,500 BCE, in lands now within the territories of Iran, Iraq and Syria
“During the first phase of democracy the seeds of its basic institution – self-government through an assembly of equals – were scattered across many different soils and climes, ranging from the Indian subcontinent and the prosperous Phoenician empire to the western shores of provincial Europe.
These popular assemblies took root, accompanied by various ancillary institutional rules and customs, like written constitutions, the payment of jurors and elected officials, the freedom to speak in public, voting machines, voting by lot and trial before elected or selected juries. There were efforts as well to stop bossy leaders in their tracks, using such methods as the mandatory election of kings…” (The Life and Death of Democracy, p.xvi)
Best-known example – Athens, 5th century BCE
Athenian Democracy
Direct democracy: citizens (about 10% of the population) participated directly in initiating, deliberating, and passing of, the legislation. The Assembly, no less than 6,000 strong (out of 22,000 citizens of Athens), convened about every 10 days. Supreme power to decide on every issue of state policy
Citizen juries: justice is responsibility of citizens (juries composed of 501-1001 citizens)
Appointment of citizens to political office by lot
Citizen-soldiers: every citizen had a duty to serve in the army
Ostracism: a bad politician could be kicked out of office by the people
Phase TwoRepresentative Democracy
Started around 10th-12th centuries in Western Europe with the invention of parliamentary assemblies
Reaches its classic forms in the 18th century. Officially regarded as normative today.
Marquis d’Argenson, Foreign Minister of French King Louis XV, 1765.
Phase Two
The Glorious revolution laid the foundation of the first democratic principles of the Rule of Law.
Earlier it was believed that the king was the ‘representative of the God’ and that the King’s wishes were the law.
The people strongly protested the idea and dethroned King James II of England.
They passed the Bill Of Rights which firmly stated that the country should be governed by the laws passed by the people and not by the whims of the king.
The French Revolution took place between 1789 and 1851.
In the revolution King Louis XVI was executed .
It was decided that the country should be ruled by the laws passed by the people.
It laid down the ‘Declaration of the Rights of Man’ which highlighted that liberty, Equality etc. were important in a Democracy.
In 1792, France became a Republic.
Phase Three Monitory Democracy
(term coined by John Keane)- After World War II
Increase citizen ability to control the state which is organized on the basis of representative democracy
Public integrity commissionsJudicial activismLocal courtsWorkplace tribunalsCitizens assembliesThink tanksThe InternetEtc.
How much power do they have? And whose interests do they serve?
Key
Various views on Human Learning - All 5 Theories Merged.pdfSamruddhi Chepe
Module 2:Various views on human learning (Credit 1, Hours 15, Marks 25)
Objectives: After learning this module the student teacher will be able to -
- compare various views on human learning
- consider various roles of learner and teacher for planning of various learning
situations
Contents
1. Views on human learning with reference to (i) Concepts and principles of each view and
their applicability in different learning situations (ii) Relevance and applicability of
various theories of learning for different kinds of learning situations(iii) Role of learner
and teacher in various learning situations (15)
Behaviourist (conditioning by Pavlov and Skinner in brief),
Cognitivist ( views of Bruner and Ausubel)
Course 4
Learning and Teaching
SNDT Women’s University, Churchgate, Mumbai 20 . 23
Information-processing view(Atkinson Shifrin)
Humanist( Carl Rogers)
Social-constructivist ( Views of Piaget and Lev Vygotski)
Skill of Probing Questions
Samruddhi Chepe
Questioning to promote higher-order Thinking
To open new ideas and creative mental habits
An open-ended- Which encourage divergent thinking
Nurturing educational environment strengthens the brain
Taxonomy of Benjamin Bloom
Categorized level of abstraction of questions-
Knowledge-List, define, tell, describe, identify, show, label, collect, examine, tabulate, quote, name, who, when, where, etc.
Comprehension- Summarize, describe, interpret, contrast, predict, associate, distinguish, estimate, differentiate, discuss, extend
Application- Apply, demonstrate, calculate, complete, illustrate, show, solve, examine, modify, relate, change, classify, experiment, discover
Strategies to make classrooms more interrogative
Use the think-pair-share strategy to allow students to respond to questions cooperatively
Avoid predictable question patterns
Ask students to “unpack their thinking”
Promote active listening by asking for summaries
Ask students why they hold a particular position or point of view on a subject
Survey the class
Encourage student-constructed questions
Use hypothetical thinking
Employ reversals
Apply different symbol
Use analogies
Analyze points of view
Questioning skill
Structure-
Grammatically correct
Relevant
Specific
Concise
Process-
Speed of asking questions
Voice
Unnecessary repetition of questions as well as students’ answers
Distribution
Product-
Interest created, attentiveness
Rapport built
Previous knowledge of pupils
Maturity level of pupils
Difficulty level of questions
Avoid
Questions requiring yes or no answers
Leading, suggestive questions
Double barreled questions
Elliptical questions
General/ambiguous questions
Terms beyond the understanding of students
Rhetorical questions
Unnecessary repetition of questions
Unnecessary repetition of answers given by students
Answering your own
Showing anger, impatience, ridicule for wrong, inadequate or slow answer
Asking only the recall/memory based questions
Responses
No response
Wrong response
Partially correct response
Incomplete response
Correct (criterion) response
The components of skill of probing questions
Prompting- No response, a partially correct response or wrong response
Seeking further information- When response obtained from the student is incomplete
Refocusing- Correct response, to view students responses in relation to other similar situations
Increasing Critical Awareness-To increase student ability to look at situations deeply, critically
Criterion Response- To clear ideas and to get correct response
Guidelines……
Questions were grammatically correct
Questions were relevant to the top
Questions were specific
Questions were concise
Questions were put with paper pause
Questions were followed by proper pause
Questions were put with proper voice
Skill of Reinforcement
Need
Reinforcement is a term taken from Psychology of Learning. It is directly related with the learning of students. The term implies for the use of technique for influencing behaviour of individuals in the desired direction.
The concept is based on Hedonistic principle which states that an individual tends to repeat the pleasant experiences and avoid the unpleasant ones.
Thorndike’s Laws of Learning
Law of Readiness
Law of Repetition
Law of Effect
The third law is directly related to the skill of reinforcement. The action having pleasant results are learnt better.
Importance
Reinforcement hence constitutes one of the essential conditions of learning. It motivates and increases the speed of learning. The behaviour of the learner can be controlled and changed and thus can help learning.
Related Study ….
Pavlov
Skinner
Pavlov’s Classical conditioning
Skinner’s Operant conditioning
Objectives
To arrest the attention of the pupils and increase pupil’s verbal /nonverbal participation during teaching-learning process.
To use reinforcers selectively.
To motivate the pupils.
To control the destructive behaviour of pupils.
To provide feedback about the appropriateness of the feedback of the pupil.
Reinforcers
The stimuli that provide or contribute to the pleasant experience are called positive reinforcers, while the stimuli providing unpleasant experiences can be termed as negative reinforcers.
Positive reinforcers are used for strengthening the responses or behaviours and negative are used for eliminating the undesirable responses.
Reinfocers can be verbal as well as nonverbal.
The types of reinforcers are-
Types of Reinforcers
Positive Verbal Reinforcers Ex-good, yes, correct
Positive Non Verbal Reinforcers Ex-Smile , nod, patting
Negative Verbal Reinforcers Ex- No, Wrong, incorrect
Negative Nonverbal Reinforcers Ex- Frowning, shaking head.
Extra Verbal Reinforcers Ex-aah, hmm, unh-hun
Desirable Components
Acceptance
Supportive Denial
Praise
Acceptance with Personal Reference
Positive Non- Verbal Cues
Undesirable Components
Inappropriate use of verbal reinforcers.
Negative Verbal Cues
Lack of Reinforcement
Negative Non-Verbal Cues
Thank You
Models of Teaching
How do models and methods of teaching differ?
Teaching is an interactive process, primarily involving class room talk which takes place between teacher and pupil and occurs during certain definable activity.
A teaching method comprises the principles and methods used for instruction. Commonly used teaching methods may include class participation, demonstration, recitation, memorization, or combination of these.
Models of teaching are nothing but planning of lesson to formulate its structure and outline useful for successful teaching.
American Educationists Bruce Joyce and Marsha Weill have invented these models of teaching.
5 aspects of a Model-
Objectives of a Model
Syntax
Support System
Social System
Principles of Reaction
Inquiry Training Model
Suchman’s Inquiry Training Model
J. Richard Suchman presented his model in the United States in 1962.
This model is designed to assist students in developing the skills required to raise questions and seek out answers stemming from their curiosity
Suchman’s Theory:-
Student inquire when they are puzzled.
They can become conscious of and learn to analyze their thinking strategies.
New strategies of thinking can be taught.
Co-operative inquiry enriches thinking, helps student to learn about the tentative nature of knowledge & to appreciate alternative explanations.
When do we use this model
The Suchman’s Inquiry Training Model is most commonly used in
Science
Social Studies
Languages in Story Telling
Objectives of Inquiry Training Model
To develop scientific process skills-observing, collecting, and organizing data, formulating hypothesis, testing etc
To develop among students the strategies for creative inquiry.
To develop among students an independence or autonomy in learning.
To develop among students the ability to tolerate ambiguity.
To make students realize that all knowledge is tentative.
To develop verbal expressiveness among students.
Syntax
Phase I - Presentation of discrepant event
Phase II - Data gathering: Verification
Phase III - Data Gathering :Experimentation
Phase IV - Formulation of explanation
Phase V - Analysis of Inquiry process.
Phase I - Presentation of Discrepant (inconsistent) Event
Confrontation with the problem.
Explain inquiry procedures.
Present discrepant event.
Phase II- Data gathering : Verification(Yes/No)
Verify the nature of object & condition.
Verify the occurrence of the problem.
Phase III- Data Gathering :Experimentation (‘If‘)
Isolate relevant variables .
Hypothesize.
Phase IV- Formulation of Explanation
Organizing, formulating explanation
Formulate rules, explanations.
Phase V -Analysis of Inquiry Process
Analysis of Inquiry process.
Analyze Inquiry strategy.
Develop more effective ones.
Social System
The teacher exercises control over the interactions.
All the ideas are open for discussion.
Teachers and pupils participate as equal partners.
Support System
A set of confronting materials and resources relate
Modern Trends in Evaluation
Unit 5
Syllabus of Unit 5-
5.2.1- Continuous Comprehensive Evaluation
5.2.2 -Modern Trends in Evaluation
5.2.3 -Constructivist Assessment
5.2.4 -Examination Reforms and Question Bank
5.2.5 -Areas of Research in Evaluation
Continuous Comprehensive Evaluation-
Continuous Comprehensive Evaluation (CCE) is an educational assessment strategy that goes beyond traditional examination-oriented assessments.
It aims to evaluate a student's performance in a holistic manner, considering various aspects of their learning and development throughout the academic year.
CCE has been introduced to shift the focus from rote learning and exam scores to a more comprehensive understanding of a student's capabilities.
It is a shift towards a more student-centric and holistic approach to education.
CCE implemented effectively, can contribute to a more comprehensive understanding of a student's abilities and encourage a broader range of skills and competencies beyond academic achievements.
CCE Meaning-
CCE is a process of evaluating the child’s development in all the school-related activities.
This proposal was directed under the Right to Education Act in 2009 by the Central Board of Secondary Education of India and the state governments in India.
Using CCE, teachers can diagnose learners' deficiencies using a variety of assessment activities.
After completing the assessment activities, learners are given valuable feedback.
The teacher guides and supports them to identify the problems.
Aim Of Continuous And Comprehensive Evaluation (CCE)-
Evaluate and guide the students in all aspects of education
Improve learning outcomes by focusing on skills and cognitive abilities of students
Encourage regular assessment and constructive criticism
Reduce stress and pressure on students
Enable the instructors with prolific teaching
Functions Of Continuous And Comprehensive Evaluation (CCE)-
Helps in the development of new and effective teaching strategies
Aids regular assessment to understand student’s progress
Helps to understand the weaknesses and strengths of students
Enables the teacher to understand problems faced by students and make changes in teaching techniques
Encourages self-assessment among the students
Helps students to develop good habits, work on their weaknesses and correct the errors
It gives an idea about the change in student’s attitudes and values
It gives reports about student’s progress over a period of time
Reduced Exam Stress
Encourages Participation
Identifies Learning Gaps
Challenges in Implementing CCE and Role of Teacher-
Challenges:
Implementation Issues: CCE may face challenges in terms of effective implementation and standardization across different educational institutions.
Assessment Load: Managing continuous assessments can be demanding for both teachers and students.
Teacher's Role:
Facilitator of Learning: Teachers play a crucial role in creating an environment that promotes learning and development.
Regular F
Unit 3 : Assessment and various aspects of evaluation
Syllabus of Unit 3-
3.2.1- Evaluation of different aspects of Human being
3.2.2 – Models of Evaluation
3.2.3 - Evaluation for Mastery Learning
3.2.4 - Feedback Techniques
3.2.5 – Role of Educator as an Evaluator
3.2.1- Evaluation of different aspects of Human being
Attitude Test
Intelligence Test
Interest Inventory
Aptitude Assessment
Creativity Test
Attitude Test-
An attitude test is a type of psychological assessment designed to measure an individual's opinions, beliefs, and feelings about a particular subject or set of subjects. Attitude tests are commonly used in various fields, including psychology, sociology, marketing, and human resources, to understand how individuals perceive and respond to different stimuli.
Attitude tests can be structured in different ways, and they often use scales or questionnaires to gather information about an individual's attitudes. Here are some key points about attitude tests:
Open-ended Questions: Attitude tests may also include open-ended questions to allow respondents to express their opinions and thoughts in their own words. This provides a more qualitative understanding of attitudes.
Attitude Components: Attitude tests often assess three main components of attitudes:
Cognitive Component: The beliefs and thoughts an individual holds about a particular subject.
Affective Component: The emotions and feelings associated with a particular subject.
Behavioral Component: The intended or actual behavior related to the attitude.
Thurstone Method-
In psychology and sociology, the Thurstone scale was the first formal technique to measure an attitude.
It was developed by Louis Leon Thurstone in 1928, originally as a means of measuring attitudes towards religion. Today it is used to measure attitudes towards a wide variety of issues.
Likert Scales-
Here individuals rate their agreement or disagreement with a series of statements. For example, respondents might be asked to indicate how strongly they agree or disagree with statements such as "I enjoy working in a team" or "I feel confident in my abilities."
The Likert scale is used to measure the intensity of an individual's agreement or disagreement with a particular statement or set of statements.
Named after its creator, psychologist Rensis Likert, this scale is designed to capture the strength and direction of a person's attitude towards a given subject.
Scale Structure:
Respondents are presented with a series of statements related to the topic of interest.
Each statement is accompanied by a scale of response options, typically ranging from "Strongly Disagree" to "Strongly Agree."
Overall, the Likert scale is a versatile and widely used tool for assessing attitudes in various fields, including psychology, sociology, education, and business. Its simplicity and ease of use make it a popular choice for both researchers and practitioners.
Importance of Attitude Scale-
Attitude tests are used in various contexts,
Assessment and evaluation- A new perspective
Unit 2- Tests and its Application
Syllabus of Unit 2
Testing- Concept and Nature
Developing and Administering Teacher Developed Tests
Characteristics of a good Test
Standardization of Test
Types of Tests- Psychological Test, Reference Test, Diagnostic Tests
2.2.1. Introduction-
Teachers construct various tools for the assessment of various traits of their students.
The most commonly used tools constructed by a teacher are the achievement tests. The achievement tests are constructed as per the requirement of a particular class and subject area they teach.
Besides achievement tests, for the assessment of the traits, a teacher observes his students in a classroom, playground and during other co-curricular activities in the school. The social and emotional behavior is also observed by the teacher. All these traits are assessed. For this purpose too, tools like rating scales are constructed.
Evaluation Tools used by the teacher may both be standardized and non-standardised.
A standardized tool is one which got systematically developed norms for a population. It is one in which the procedure, apparatus and scoring have been fixed so that precisely the same test can be given at different time and place as long as it pertains to a similar type of population. The standardized tools are used in order to:
Compare achievements of different skills in different areas
Make comparison between different classes and schools They have norms for the particular population. They are norm referenced.
On the other hand, teachers make tests as per the requirements of a particular class and the subject area they teach. Hence, they are purposive and criterion referenced. They want:
to assess how well students have mastered a unit of instruction;
to determine the extent to which objectives have been achieved;
to determine the basis for assigning course marks and find out how effective their teaching has been.
So our syllabus here revolves around the Tests.
2.2.2- Developing and Administering Teacher Developed Tests-
2.2.3-CHARACTERISTICS OF GOOD MEASURING INSTRUMENT -
1. VALIDITY-
Any measuring instruments must fulfill certain conditions. This is true in all spheres, including educational evaluation.
Test validity refers to the degree to which a test accurately measures what it claims to measure. It is a critical concept in the field of psychometrics and is essential for ensuring that a test is meaningful and useful for its intended purpose. It is the test is meant to examine the understanding of scientific concept; it should do only that and should not be attended for other abilities such as his style of presentation, sentence patterns or grammatical construction. Validity is specific rather than general criterion of a good test. Validity is a matter of degree. It may be high, moderate or low.
There are several types of validity, each addressing different aspects of the testing process:
1. Face-validity, 2.Content
Unit 1.Evaluation, Assessment and Measurement pptxSamruddhi Chepe
Assessment and evaluation- Modern Viewpoint
Syllabus-
Concept of Assessment and Evaluation
Tests and its Application
Various aspects of Assessment and Evaluation
Statistics in Evaluation
Modern Trends in Assessment
Unit 1-Concept of Assessment and evaluation
Syllabus of Unit 1-
Measurement and Assessment-- Meaning, Nature, Need, Importance, and Scope
Evaluation-Meaning, Nature, Need, Importance, and Scope
Functions of Evaluation, Measurement and Assessment in Education
Interrelationship between Educational Objectives, Learning Experiences and Evaluation
Various Types of Evaluation and its Limitations
1.2.1-Measurement - Meaning
Measurement has been the practice with teachers since a very long time. They have been testing their students and assigning numbers regarding the progress of their students in studies, and adopt corrective measures accordingly.
According to Bradfield & Moredock (1957), ‘Measurement is the process of assigning symbols to the dimension of phenomenon in order to characterize the status of phenomenon as precisely as possible’. Measurement is the process by which a characteristic of an object, person or activity is perceived and understood on specific standards and is described in standard words, symbols or definite units.
Measurement requires the use of numbers but does not require the value judgments be made about the numbers obtained from the process. We measure achievement with a test by counting the number of test items a student answers correctly, and we use exactly the same rule to assign a number to the achievement of each, student in the class.
Example: Raman got 93 marks in a test of Mathematics. Measurement is all about the numbers and being able to quantify the performance or the abilities. Measurements are more objective as they have numerical standards to compare and record. It answers the question “how much”.
Scope of Measurement in Education
The scope of educational measurement includes measurement of educational achievement, intelligence, interest, ability, aptitude, and other traits of students. Using methods, tests, tools, and activities to determine a student's level and what he or she has learned and developed.
Need and Importance of Measurement in Education–
Measurement also helps in considering external assessment for the students, and it helps in understanding the cognitive areas of the individual.
Measuring and evaluating pupils' progress is helpful in establishing how much they have learnt.
Without measuring and analyzing what he has taught, the instructor would be unable to determine how far his students have progressed.
History of Indian Education System
India has a rich history of academia and the formal dissemination of education. We are aware of the Gurukuls of ancient India, where pupils were taught several subjects that prepared them for survival in the world. Since then, the subcontinent's cultural climate has massively shaped how the youth are instructed about the ways of the world and how they contribute to it. The following text systematically examines this progression.
The Upanishads and Dharanshastras can be used to trace the origins of education in ancient India. The idea of Gurukulas is the most significant gift of the old Indian educational system. Unfortunately, the Gurukula educational system is unquestionably declining despite numerous initiatives to Indianize our education via organizations like Vishwa Bharti University, Sri Aurobindo University, Jarnia Millia International, Vidya Bhawan, and Banasthatividyapith, to mention just a few. Candidates from all over the world flocked to ancient Indian institutions like Takshashila and Nalanda, which were renowned for the calibre of their education.
While the British promoted education in India for purely selfish reasons, credit must be given to them for establishing the superior western educational system, which is unquestionably responsible for the current Indian educational system. Though it remains an ideal that has not been completely achieved, the Indian Constitution after Independence provided particular provisions for the promotion of education at different levels through the achievement of universal and compulsory schooling. The Indian government appointed numerous consultants to evaluate the Indian educational system at various stages and times. The Indian government did everything it could to promote education. The nation has unquestionably made significant progress in all areas of education, but we were never able to reach the magnificent ideal of universal kindergarten education or total literacy.
Vedic Spiritual Beginnings
Education in ancient India was closely tied to religious and spiritual practices and was primarily the domain of religious teachers and scholars. Education in ancient India was focused on the study of scriptures and the development of spiritual knowledge and wisdom. It was largely centered around religious institutions such as temples, monasteries, and ashrams. In ancient India, education was largely an oral tradition, with knowledge being passed down through generations of teachers and students. Students typically begin their education at a young age and study under a guru or spiritual teacher for many years. The education system in ancient India was highly hierarchical, with the guru at the top and the students at the bottom. The curriculum in ancient India was largely focused on studying scriptures and spiritual texts, such as the Vedas, the Upanishads, and the Bhagavad Gita. Students would also study subjects such as Sanskrit, grammar, logic, and ethics. Education
Logical or deductive reasoning involves using a given set of facts or data to deduce other facts by reasoning logically. It involves drawing specific conclusions based on premises. Reasoning is the process of using existing knowledge to draw conclusions, make predictions, or construct explanations. Three methods of reasoning are the deductive, inductive, and abductive approaches. The development of Indian logic dates back to the anviksiki of Medhatithi Gautama (c. 6th century BCE); the Sanskrit grammar rules of Pāṇini (c. 5th century BCE); the Vaisheshika school's analysis of atomism (c. 6th century BCE to 2nd century BCE); the analysis of inference by Gotama.
Module 2: Planning of teaching Science and Technology (Credit 1, Hours 15, Marks 25)
Objectives: After learning this module the student teacher will be able to-
- explain importance and characteristics of planning
- plan for teaching major concepts, principles and theories of Science and Technology
at school level
- design co-curricular activities for Science learning
Contents
1. Importance and characteristics of good planning(1)
2. Planning for designing learning experiences, field visits, activities and developing
instructional material for teaching following content:(12)
Properties and states of matter, structure of atom, Plant and animal cells, classification of
plants and animals, diseases and their prevention, kinematic equations, modern periodic
table, Electricity, lenses and mirrors, life processes, life cycle, Origin of life and
evolution, Heat, Electricity, Magnetism, Light, Contribution of eminent scientists such as
Isaac Newton, Dalton, Neils Bohr, Darwin, J. C. Bose, C. V. Raman, Albert Einstein, etc.
3. Planning for organizing various co-curricular activities such as debate, drama, poster
making on issues related to science/biology, Day celebrations such as Science Day, Earth
Day, Environment Day, etc(2)
Total Credits: 4; Marks: 100; Hours: 60 for theory excluding hours to be spent by student
teachers for completing assignments
Note: Figures in the bracket show hours for curriculum transaction
Module 1: Understanding Curriculum and Aims of Science and Technology (Credit 1,
Hours 15, Marks 25)
Objectives: After learning this module the student teacher will be able to-
- explain the nature and structure of science
- understand the aims of Science education
- plan for imbibing values through Science teaching
- write instructional objectives of teaching of a topic
- analyze features of existing curriculum of Science and Technology in the light of
NCF 2005 and principles of curriculum development
- establish correlation of Science with other subjects
Contents :
1. Nature and Structure of Science: Characteristics and functions of Science and
Technology, Branches of Science; Facts, concepts, principles, laws and theories in
context of science (3)
2. Aims of teaching Science and Technology:(2)
3. Developing scientific attitude and scientific temper
4. Nurturing the natural curiosity, aesthetic senses and creativity in Science
5. Acquiring the skills to understand the method and process of science that lead to
exploration, generation and validation of knowledge in science
6. Relating Science education to the environment (natural environment, artifacts and
people)
7. Solving problems of everyday life
8. Values and Learning Science: Imbibing the values of honesty, integrity, cooperation,
concern for life and preservation of environment, health, peace, equity (2)
9. Objectives at upper primary and secondary school level as given by State curriculum (1)
10. Determining acceptable evidences that show learners‘ understanding with the help of
Bloom and Anderson‘s hierarchy of objectives of teaching ( 2)
11. Expectations about constructivist science teaching in NCF 2005, General principles of
curriculum development and Trends in Science curriculum; Consideration in developing
learner centered curriculum in science, Analysis of Features of existing curriculum of
science and technology at upper primary and secondary school level and textbooks(4)
12. Establishing correlation of Science with other school subjects and life(1)
Module 1 of SNDT University of FYBEd.
A numerical reasoning test is an aptitude test measuring ability to perform calculations and interpret data in the form of charts. There are five common types of numerical reasoning tests: calculation, estimation, number sequence, word problem, and data interpretation. Most of them are in multiple-choice format. Numerical ability is defined as the capacity to comprehend, reason about, and apply basic numerical ideas. Understanding basic arithmetical operations such as additions, reduction, multiply, and divisions constitute basic numeracy abilities. How do you prepare numerical ability?
Our final top numerical reasoning test tips
Numerical Test Tip 1: Understand the questions. ...
Numerical Test Tip 2: Bring your own calculator. ...
Numerical Test Tip 3: Know your calculator. ...
Numerical Test Tip 4: Use the rough paper. ...
Numerical Test Tip 5: Consider only the options available. What are numeracy skills? Numeracy skills refer to the ability to use, interpret and communicate mathematical information to solve real-world problems. These include the ability to understand basic math like addition, subtraction, division and multiplication.
Present ppt can be useful for B.Ed. CET.
Module 1: Learner as a Developing Individual (Credit 1, Hours 15, Marks 25)
Objectives : After learning this module the student teacher will be able to-
- explain concept and stages of growth and development
- bring out relationship between development and environmental factors
- elaborate developmentally appropriate learning opportunities based on brain research
- explain relationship of development with learning
- organize activities according to different roles of learner
Contents:
1. Concept of growth and development and principles of development(2 periods)
2. Growth and development across various stages from infancy to post adolescence
(Special emphasis on concerns of later childhood and adolescence) (2 periods)
3. Developmental Influences: Development as a resultant of interactions between individual
potential (innate, acquired) and external environment (physical, socio-cultural, ecological,
economic and technological). Nature and nurture, growth and maturation.(3 periods)
4. Growth and development of brain and its lifelong impact:
Brain development and language development
Functions of brain
Windows of opportunities
Left brain and right brain functions
Concept of 'developmentally appropriate' learning opportunities, getting education for
appropriate parenting. Guidelines provided by neuroscience with respect to designing
and developing appropriate learning environment. (4)
5. Relationship between development and learning, Viewing different roles of learners and
organization of classroom activities accordingly- Learner as Imitator, Knower, Thinker,
knowledge worker, Performer, Implications for teachers to develop holistic understanding of
the learner (4)
Inclusive education means all children in the same classrooms, in the same schools. It means real learning opportunities for groups who have traditionally been excluded – not only children with disabilities, but speakers of minority languages too. Current content deals with the Module 1 of Inclusive Education as per S.Y.B.Ed. SNDT University Syllabus.
Module: 3 Understanding Right to Education(Credit: 1, hours: 15, Marks: 25)
Objectives: After learning this module the student teacher will be able to-
- explain the nature of RTE.
- elaborate the objectives and features of RTE.
- elaborate the provisions of RTE.
- create teaching and evaluation strategies for RTE
- explain duties and responsibilities of school and teachers
- evaluate the role of stakeholder, parents, media and government organization in
implementation of RTE.
Content:
1. Nature, need and importance of RTE in India.(2)
2. History of RTE: Directive principles of state policy, laws and commission regarding
Indian education, UNO declaration about child‘s Rights, RTE ACT 2009.(3)
3. Objectives and Features of RTE Act2009.(2)
4. Provisions of RTE Act 2009(3)
5. Teaching learning and evaluation strategies in RTE (2)
6. Duties and responsibilities of school and teachers(2)
7. Role of stakeholder, parents, media (1)
Module no. 3 of optional paper Human Rights Education of S.Y.B.Ed. SNDT University.
Module - 2: Understanding ICT in Education (Credit 1, Hours 15, Marks 25)
Objectives: After learning this module the student teacher will be able to
- explain the meaning and characteristics of Computer.
- operate various hardware devices.
- explain the software and its uses in Education.
Course 3
Critical Understanding of ICT
SNDT Women’s University, Churchgate, Mumbai 20 . 19
Content:
1. Computer - Definition ,Characteristics & Types of Computer – Speed, Storage,
Accuracy, Versatile, Automation, Diligence (3)
2. Hardware and uses.-(6)
Input devices - Key Board, Mouse, Scanner, Microphone, Digital camera.
Output devices - Monitor, Printer, Speaker, Screen image projector
Storage devices - Hard Disk, CD & DVD, Mass Storage Device (Pen drive)
ICT Tools-Touch screen, Personal Digital Assistants (PDA),Bar Code Readers, LCD
Projectors, Game Pads and Joy Sticks.
3. Software‘s and its uses in Education. (6)
Operating System - Concept and function.
Application Software
• Word Processors
• Presentation software
• Data management -Spread sheet
• Content access software –Media Player,
• Media development software-Image Editing Software
Module 2 of Critical Understanding of ICT as per the F.Y.B.Ed. SNDT Syllabus.
Palestine last event orientationfvgnh .pptxRaedMohamed3
An EFL lesson about the current events in Palestine. It is intended to be for intermediate students who wish to increase their listening skills through a short lesson in power point.
The French Revolution, which began in 1789, was a period of radical social and political upheaval in France. It marked the decline of absolute monarchies, the rise of secular and democratic republics, and the eventual rise of Napoleon Bonaparte. This revolutionary period is crucial in understanding the transition from feudalism to modernity in Europe.
For more information, visit-www.vavaclasses.com
Macroeconomics- Movie Location
This will be used as part of your Personal Professional Portfolio once graded.
Objective:
Prepare a presentation or a paper using research, basic comparative analysis, data organization and application of economic information. You will make an informed assessment of an economic climate outside of the United States to accomplish an entertainment industry objective.
Instructions for Submissions thorugh G- Classroom.pptxJheel Barad
This presentation provides a briefing on how to upload submissions and documents in Google Classroom. It was prepared as part of an orientation for new Sainik School in-service teacher trainees. As a training officer, my goal is to ensure that you are comfortable and proficient with this essential tool for managing assignments and fostering student engagement.
The Roman Empire A Historical Colossus.pdfkaushalkr1407
The Roman Empire, a vast and enduring power, stands as one of history's most remarkable civilizations, leaving an indelible imprint on the world. It emerged from the Roman Republic, transitioning into an imperial powerhouse under the leadership of Augustus Caesar in 27 BCE. This transformation marked the beginning of an era defined by unprecedented territorial expansion, architectural marvels, and profound cultural influence.
The empire's roots lie in the city of Rome, founded, according to legend, by Romulus in 753 BCE. Over centuries, Rome evolved from a small settlement to a formidable republic, characterized by a complex political system with elected officials and checks on power. However, internal strife, class conflicts, and military ambitions paved the way for the end of the Republic. Julius Caesar’s dictatorship and subsequent assassination in 44 BCE created a power vacuum, leading to a civil war. Octavian, later Augustus, emerged victorious, heralding the Roman Empire’s birth.
Under Augustus, the empire experienced the Pax Romana, a 200-year period of relative peace and stability. Augustus reformed the military, established efficient administrative systems, and initiated grand construction projects. The empire's borders expanded, encompassing territories from Britain to Egypt and from Spain to the Euphrates. Roman legions, renowned for their discipline and engineering prowess, secured and maintained these vast territories, building roads, fortifications, and cities that facilitated control and integration.
The Roman Empire’s society was hierarchical, with a rigid class system. At the top were the patricians, wealthy elites who held significant political power. Below them were the plebeians, free citizens with limited political influence, and the vast numbers of slaves who formed the backbone of the economy. The family unit was central, governed by the paterfamilias, the male head who held absolute authority.
Culturally, the Romans were eclectic, absorbing and adapting elements from the civilizations they encountered, particularly the Greeks. Roman art, literature, and philosophy reflected this synthesis, creating a rich cultural tapestry. Latin, the Roman language, became the lingua franca of the Western world, influencing numerous modern languages.
Roman architecture and engineering achievements were monumental. They perfected the arch, vault, and dome, constructing enduring structures like the Colosseum, Pantheon, and aqueducts. These engineering marvels not only showcased Roman ingenuity but also served practical purposes, from public entertainment to water supply.
How to Make a Field invisible in Odoo 17Celine George
It is possible to hide or invisible some fields in odoo. Commonly using “invisible” attribute in the field definition to invisible the fields. This slide will show how to make a field invisible in odoo 17.
A Strategic Approach: GenAI in EducationPeter Windle
Artificial Intelligence (AI) technologies such as Generative AI, Image Generators and Large Language Models have had a dramatic impact on teaching, learning and assessment over the past 18 months. The most immediate threat AI posed was to Academic Integrity with Higher Education Institutes (HEIs) focusing their efforts on combating the use of GenAI in assessment. Guidelines were developed for staff and students, policies put in place too. Innovative educators have forged paths in the use of Generative AI for teaching, learning and assessments leading to pockets of transformation springing up across HEIs, often with little or no top-down guidance, support or direction.
This Gasta posits a strategic approach to integrating AI into HEIs to prepare staff, students and the curriculum for an evolving world and workplace. We will highlight the advantages of working with these technologies beyond the realm of teaching, learning and assessment by considering prompt engineering skills, industry impact, curriculum changes, and the need for staff upskilling. In contrast, not engaging strategically with Generative AI poses risks, including falling behind peers, missed opportunities and failing to ensure our graduates remain employable. The rapid evolution of AI technologies necessitates a proactive and strategic approach if we are to remain relevant.
2. Unit 4 Syllabus-
• 4.2.1- Measuring Scales- Meaning and Statistical Use
• 4.2.2- Conversion and interpretation of Test Score
• 4.2.3- Normal Probability Curve
• 4.2.4- Central Tendency and its importance in Evaluation.
• 4.2.5- Dimensions of Deviation
3. The Unit 4 is all about Statistics…
Statistics is the study of the collection, analysis, interpretation,
presentation, and organization of data.
In other words, it is a mathematical discipline to collect,
summarize data.
Also, we can say that statistics is a branch of applied
mathematics.
Statistics is simply defined as the study and manipulation of
data. As we have already discussed in the introduction that
statistics deals with the analysis and computation of numerical
data.
4. Projective methods of Evaluation through
Statistics-
• Measurement is a process of assigning numbers to individuals
or their characteristics according to specific rules.” (Eble and
Frisbie, 1991, p.25).
• This is very common and simple definition of the term
‘measurement’.
• You can say that measurement is a quantitative description of
one’s performance. Gay (1991) further simplified the term as a
process of quantifying the degree to which someone or
something possessed a given trait, i.e., quality,
characteristics, or features.
5. Measurement assigns a numeral to quantify certain aspects of
human and non-human beings.
It is numerical description of objects, traits, attributes,
characteristics or behaviours.
Measurement is not an end in itself but definitely a means to
evaluate the abilities of a person in education and other fields
as well.
6. Measurement Scale-
• Whenever we measure anything, we assign a numerical value. This numerical value is
known as scale of measurement. A scale is a system or scheme for assigning values
or scores to the characteristics being measured (Sattler, 1992). Like for measuring
any aspect of the human being we assign a numeral to quantify it, further we can
provide an order to it if we know the similar type of measurement of other
members of the group, we can also make groups considering equal interval scores
within the group.
• Psychologist Stanley Stevens developed the four common scales of measurement:
1. Nominal
2. Ordinal
3. Interval &
4. Ratio
• Each scale of measurement has properties that determine how to properly analyze
the data.
7. Nominal scale-
In nominal scale, a numeral or label is assigned for characterizing
the attribute of the person or thing.
That caters no order to define the attribute as high-low, more-
less, big-small, superior-inferior etc.
In nominal scale, assigning a numeral is purely an individual matter.
It is nothing to do with the group scores or group measurement.
Statistics such as frequencies, percentages, mode, and chi-square
tests are used in nominal measurement.
• Examples include gender (male, female), colors (red, blue, green), or
types of fruit (apple, banana, orange).
8. Ordinal scale-
• Ordinal scale is synonymous to ranking or grading.
• It includes nominal scale and provides an order to the measurement, like; when
we know the achievement scores of students in a group, we can arrange them
either in ascending (lowest to highest) or descending (highest to lowest) order.
• We can also interpret the result like; who stood first, second, 10th in the group,
even the last one in the group.
• In ordinal scale, we can use the statistics such as median (measures of central
tendency), quartile and percentile measures, correlation in rank difference
method, and non-parametric test.
• Examples include rankings (1st, 2nd, 3rd), customer satisfaction ratings (poor,
fair, good, excellent), or educational levels (high school, college, graduate).
9. Interval scale-
• Interval scale carries all the characteristics of earlier scales like nominal and
ordinal and added with an arbitrary zero point.
• That is, there is no absolute zero-point or true zero point.
• In this scale, we can group the scores in to equal intervals like, scores within the
intervals of : 0-5; 5-10; 10-15; 15-20; 20-25; 25-30 etc.
• This is also called as equal interval scale as the size of the classes are equal, i.e.
size of the class 0-5 is 5; 5-10 is 5; 10-15 is 5; 15-20 is also 5.
• As there is no absolute zero point in this measurement and the existing zero value
is an arbitrary one, that’s why all types of measurement done in education and social
sciences are usually done by interval scale.
• The statistics like mean, standard deviation, product moment correlation, t-test
and f-test can be used in interval scale.
• Examples include temperature in Celsius or Fahrenheit, IQ scores, or Likert scales.
10. Ratio scale-
• Ratio scale is called as the highest scale in measurement.
• It carries all the characteristics of earlier discussed scale with a true
or absolute zero point.
• As there is absolute zero point in this measurement, we can say that
zero height means no height. But in the case of interval scale, we can
not say that zero intelligence means no intelligence.
• All types of measurements conducted in Physical Sciences such as
Physics, Mathematics, etc. are done by ratio scale.
• Ratio scale are almost non-existence in psychological and educational
measurement except in the case of psycho-physical measurement.
• Examples include height, weight, age, income, and time in seconds.
11. • We usually use four types or scales of measurement, i.e. nominal, ordinal,
interval and the ratio scale.
• In educational measurement, generally, we use nominal, ordinal and equal
interval scale.
• Ratio scale is used in measurement of physical sciences where there is a
concept of absolute zero point in measurement.
• But in educational measurement, we consider zero point measurement as
the relative zero point.
• The use of different methods of calculating measures of central
tendency is depends upon the nature of the data and its scales of
measurement.
13. Z Score-
• Z-score (or standard score) is a statistical
measure that expresses the relationship of a
data point to the mean of a group of data
points. It is often used in statistics to
standardize scores and make them comparable
across different scales.
• Here's a breakdown of the components:
• Z: The Z-score.
• X: The individual data point.
• μ: The mean of the dataset.
• σ: The standard deviation of the dataset.
• The Z-score tells you how many standard
deviations a particular data point is from the
mean.
• Z-score of 0 indicates that the data point's
score is identical to the mean score, a Z-score
of 1.0 indicates a value that is one standard
deviation from the mean, and so on.
Z-scores are frequently used in fields such as
finance, education, and psychology for comparing
and standardizing data. They are particularly
valuable when dealing with datasets with
different units or scales, as they provide a
common metric for comparison.
14. Percentile-
• A percentile is a statistical measure
used to describe the relative
position of a particular value within
a dataset.
• It indicates the percentage of data
points that are equal to or below a
given value.
• provide a way to express the
relative standing of a particular
value within a group, making it
easier to interpret and communicate
the significance of that value.
• Percentiles are commonly used in
various fields, including statistics,
education, healthcare, and finance.
15. Percentile Rank-
• Percentile rank is a measure that
indicates the percentage of scores in a
dataset that are equal to or below a
particular value.
• It provides information about the
relative standing of a specific data point
within a distribution.
• Percentile rank is commonly used in
various fields, including education,
standardized testing, and healthcare.
• It provides a way to understand and
communicate the relative position of a
particular data point within a
distribution, making it easier to interpret
and compare scores across different
contexts.
17. NPC- Concept and Definition
• The "normal probability curve" refers to a specific type of distribution
known as the normal distribution or Gaussian distribution. This distribution
is often represented as a bell-shaped curve, and it has several important
characteristics.
• Applications: The normal distribution is commonly used in statistics and
research. Many natural phenomena, such as human height, test scores, and
measurement errors, approximate a normal distribution. This makes the
normal distribution a valuable tool for statistical analysis and hypothesis
testing.
• The normal probability curve is fundamental in statistics, providing a
theoretical framework for understanding the distribution of data in many
real-world scenarios. It is widely used in fields such as finance, biology,
psychology, and quality control. The normal distribution is also a key
assumption in many statistical methods and hypothesis tests.
18. Importance of NPC-
• The normal curve is used to characterize complex constructs containing
continuous random variables.
• Many phenomena observed in nature have been found to follow a normal
distribution.
• Some human attributes such as height, weight, intelligence, and even
social skills can be said to be normally distributed.
• Study of natural phenomenon through NPC
• Sampling Theory has its base on NPC
• NPC is useful for large sample tests.
19. Characteristics of NPC-
• it has a bell shape,
• the mean and median are equal-First, its mean (average), median (midpoint),
and mode (most frequent observation) are all equal to one another. Moreover,
these values all represent the peak, or highest point, of the distribution. The
distribution then falls symmetrically around the mean, the width of which is
defined by the standard deviation.
• The Empirical Rule - 68% of the data falls within 1 standard deviation. For all
normal distributions, 68.2% of the observations will appear within plus or minus
one standard deviation of the mean; 95.4% of the observations will fall within
+/- two standard deviations; and 99.7% within +/- three standard deviations.
This fact is sometimes referred to as the "empirical rule," a heuristic that
describes where most of the data in a normal distribution will appear.
20. Application of NPC in Evaluation-
1. Grading and Assessment
2. Standardized Testing
3. Student Performance Analysis
4. Setting Benchmarks and Goals
5. Assumption in Statistical Tests
6. Placement and Intervention Programs
7. Growth and Development Monitoring
8. Grading Curves
• In summary, the normal probability curve
is a valuable tool in education for
understanding, analyzing, and interpreting
student performance. It provides a
framework for making informed decisions
about assessment, grading, and
intervention strategies. Additionally, it is
a key component in the statistical analysis
of educational research data.
22. Mean-
• In statistics, the "mean" is a
measure of central tendency
that represents the average
of a set of values. T
• There are different types of
means, but the most common
one is the arithmetic mean.
• The arithmetic mean is
calculated by summing up all
the values in a dataset and
dividing the sum by the total
number of values.
1. Grading and Assessment
2. GPA Calculation
3. Program Evaluation
4. Benchmarking
5. Teacher Evaluation
6. Research and Data Analysis
7. Standardized Testing
8. Resource Allocation
9. Identification of Trends
10. Needs Assessment
11. Programmatic Decision-Making
• The mean is a fundamental concept in statistics and is widely
used in various fields to describe and summarize data.
23. Median-
• The median is a measure of
central tendency that
represents the middle value
in a dataset when the values
are arranged in numerical
order.
• It is one of the three main
measures of central
tendency, along with the
mean and mode.
• The median is less sensitive
to extreme values (outliers)
compared to the mean,
making it a robust statistic in
some situations.
In educational contexts, the median is commonly
used in a variety of scenarios, including-
1. grading
2. analyzing test scores
3. and evaluating student performance.
• It provides a useful summary statistic that
helps educators understand the central
position of values in a dataset, especially when
dealing with non-normally distributed data or
when extreme values may distort the
interpretation of the mean.
24. Mode-
• The mode is a measure of
central tendency that
represents the most
frequently occurring value in
a dataset.
• Unlike the mean and median,
which represent the average
and middle values,
respectively, the mode
identifies the value that
appears with the highest
frequency.
• Applicability-
• The mode is suitable for both numerical and categorical data.
For numerical data, it represents a specific value, while for
categorical data, it represents the category with the highest
frequency.
• While the mode provides information about the most common
value, it may not always be a sufficient statistic for
summarizing a dataset. In such cases, the mean and median
may also be considered to provide a more comprehensive
picture of the dataset's central tendency.
27. Range-
• Range may be defined simply as that interval between the lowest and the
highest scores. It is very common and general measure of spread and is
computed when we need to know at a glance comparison of two or more groups
for variability. Since, it is based on two extreme values and tells nothing about
the variation of the intermediate values, it is not an authentic measure of
dispersion. Range may be computed by the following formula:
• (Range = Highest Score – Lowest Score) .... (3)
• It is deceptive and not authentic. For example, in any class of 40 students, 1
student got 20 marks, while all the rest 39 students scored between 70 to 80
marks out of 100. Range informs you that there exist a range of 60 marks,
while the majority secured between 70 to 80 and the more appropriate and
near variation is of 100 marks only. Therefore, it may be used as a quick and at
a glance measure of dispersion, but you cannot be dependent on “Range” in
order to know true dispersion.
28.
29. Quartile Deviation and its Interpretation-
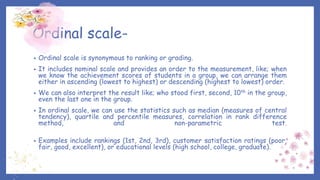
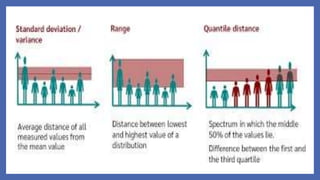
• The second measure of measures of dispersion is Quartile Deviation. It is also
known as ‘semi-interquartile range’. As you know the interval between highest and
lowest score is known as ‘range’, in a similar way distance between first and third
quartile divided by two is known as ‘Quartile deviation’. Therefore, it may be
expressed as: QD or Q = (Q3 -Q1) / 2 ............... (4)
• Since you are already aware on the concept of percentile, therefore, you may
simply infer the formula in the following manner: QD or Q = (P75 - P25) / 2 ..............
(5)
• In order to calculate Q, it is clear that we must first compute the 75th and 25th
Percentile and, therefore, the formula (1) previous discussed for calculating
percentile may be used in the following manner: Q1 = L + [(N/4 - Cfb) /fq] i
....................... (6)
• and Q3 = L+[(3N/4 - Cfb)/fq] i .................. (7)
• Note: You must remember that formula (1), used for Percentile has been taken
from the formula which you used in calculating the median.
30. Example: Calculate the Quartile Deviation for the data given in Table ’15.1’.
• Solution: Using the data given in Table ’15.1’ and Formula (6) and (7):
• (i) Q1 = P25 = 49.5+[(25-21)/35] 10 = 50.64
• (ii) Q3 = P75 = 59.5 + [(75-56)/20]10 = 69
• Therefore, QD = (Q3-Q1)/2 = (69-50.64)/2 = 9.18
• Q = 9.18
• Interpretation of Quartile Deviation
• Quartile deviation is easy to calculate and interpret, it is independent of the problem of extreme
values and, therefore, it is more representative and authentic than range. In distribution where
we prefer median as a measure of central tendency, the quartile deviation is also preferred as
measure of dispersion. However, both the measures are not suitable to algebraic operations,
because both do not consider all the values of the given distribution. In case of symmetrical
distribution, mean and median are equal and median lies at an equal distance from the two quartiles
i.e.
• Q3 – Median = Median – Q1
In case of non-symmetrical distribution, two possibilities may arise:
• I. Q3 – Median > Median – Q1 (Positive Skewed Curve)
• II. Q3 – Median < Median – Q1 (Negative Skewed Curve)
31. Mean Deviation-
• The mean deviation is defined as a statistical measure that is used to
calculate the average deviation from the mean value of the given data
set.
• It quantifies the dispersion or spread of data points in a dataset. Mean
deviation is also known as average deviation.
• Use in Descriptive Statistics:
• Mean deviation is used in descriptive statistics to quantify the average
amount by which individual data points deviate from the mean.
• Limitation:
• One limitation of mean deviation is that it does not have a clear mathematical
interpretation, especially when comparing datasets with different means.
32. Standard Deviation-
• The standard deviation is the average amount of variability in your
dataset. It tells you, on average, how far each value lies from the mean.
A high standard deviation means that values are generally far from the
mean, while a low standard deviation indicates that values are clustered
close to the mean.
33. Skewness-
• Skewness measures the degree of symmetry of a distribution.
The normal distribution is symmetric and has a skewness of zero.
• If the distribution of a data set instead has a skewness less than
zero, or negative skewness (left-skewness), then the left tail of
the distribution is longer than the right tail; positive skewness
(right-skewness) implies that the right tail of the distribution is
longer than the left.
34. Kurtosis-
• Kurtosis measures the thickness of the tail ends of a distribution in
relation to the tails of a distribution. The normal distribution has a
kurtosis equal to 3.0.
• Distributions with larger kurtosis greater than 3.0 exhibit tail data
exceeding the tails of the normal distribution (e.g., five or more
standard deviations from the mean). This excess kurtosis is known in
statistics as leptokurtic, but is more colloquially known as "fat tails."
The occurrence of fat tails in financial markets describes what is known
as tail risk.
• Distributions with low kurtosis less than 3.0 (platykurtic) exhibit tails
that are generally less extreme ("skinnier") than the tails of the normal
distribution.
35. Questions for Self Study-
1. What problems may be encountered while interpreting the test scores?
2. How is Frequency Distribution Table prepared?
3. What are Z Test and T Test? How are they calculated?
4. What is Percentile and Percentile Rank?
5. What are the various categories for classifying measurement scales?
6. Discuss the importance and Characteristics of Normal Probability Curve.
7. Explain the uses and characteristics of Mean.
8. What are the advantages of Mode?
9. What are the various Dimensions of Deviation? Discuss the Standard
Deviation with example.